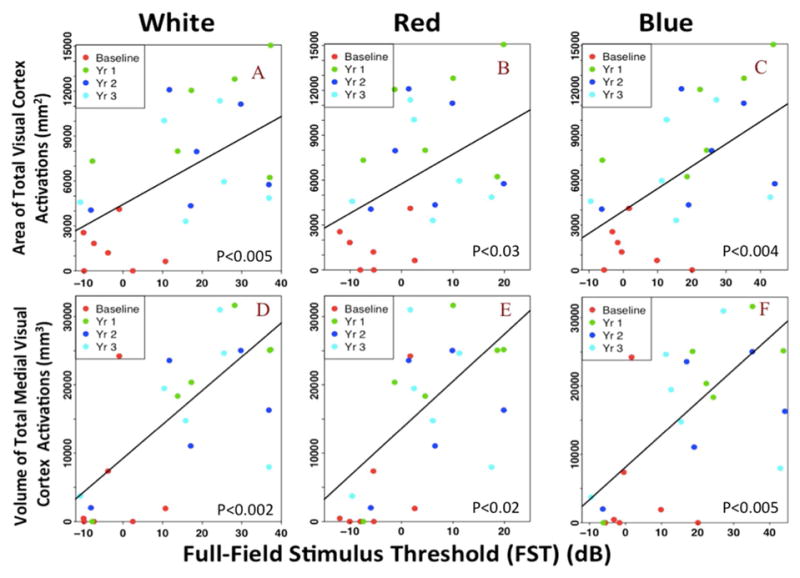
Figure 3. Association between FST clinical measures and visual cortical activations.

Scatterplot with linear regression lines from the mixed effect model for the association of cortical activations and FST measures using white, red and blue light sources. The top portion presents the association between the FST measures of (A) white, (B) red, and (C) blue light stimuli and the area of the total visual cortex activations. The bottom section shows the association between the FST measures of (D) white, (E) red, and (F) blue lights and the volume of the total medial visual cortex activations. Both values of the cortical activations are significantly associated with the increase in light sensitivity in RPE65 patients over time. However, the activation of the medial cortex are more strongly associated with the FST light sensitivity measures (see Discussion).
