

SUMMARY
The development of the nervous system involves a coordinated succession of events including the migration of GABAergic neurons from ventral to dorsal forebrain and their integration into cortical circuits. However, these interregional interactions have not yet been modelled with human cells. Here, we generate from human pluripotent cells three-dimensional spheroids resembling either the dorsal or ventral forebrain and containing cortical glutamatergic or GABAergic neurons. These subdomain-specific forebrain spheroids can be assembled to recapitulate the saltatory migration of interneurons similar to migration in fetal forebrain. Using this system, we find that in Timothy syndrome– a neurodevelopmental disorder that is caused by mutations in the CaV1.2 calcium channel, interneurons display abnormal migratory saltations. We also show that after migration, interneurons functionally integrate with glutamatergic neurons to form a microphysiological system. We anticipate that this approach will be useful for studying development and disease, and for deriving spheroids that resemble other brain regions to assemble circuits in vitro.
INTRODUCTION
The formation of the human cerebral cortex involves the assembly of circuits composed of glutamatergic neurons, which are generated in the dorsal forebrain (pallium), and GABAergic interneurons, which are born in the ventral forebrain (subpallium)1–3. After specification, interneurons migrate long distances over several months during human fetal development and subsequently undergo activity-dependent maturation and integration into cortical circuits1,4. Genetic or environmental perturbations of this process can lead to an imbalance of cortical excitation and inhibition and are thought to contribute to neuropsychiatric disorders, including epilepsy and autism spectrum disorders (ASD)5,6. These key developmental processes, which occur mostly in mid-to-late gestation, have been largely inaccessible for functional studies in humans7,8. Moreover, the directed differentiation, and particularly the functional maturation of cortical interneurons from human pluripotent stem cells (induced pluripotent stem cells, hiPSC, or embryonic stem cells, hESCs), has been challenging9,10. To date, no reliable, personalized models exist to study the migration of human interneurons and their functional integration into cortical ensembles.
Here, we leverage a 3D differentiation approach using hPSCs to specify neural spheroids resembling the pallium (human cortical spheroids, hCS) or the subpallium (human subpallium spheroids, hSS), and we subsequently assemble them in vitro to model for the first time the saltatory migration of human interneurons towards the cerebral cortex and their functional integration into microcircuits.
GENERATION OF SUBDOMAIN-SPECIFIC FOREBRAIN SPHEROIDS
We have previously described the generation of floating, 3D neural cultures from hPSCs resembling the pallium (hCS) that contain deep and superficial layer cortical glutamatergic neurons, as well as astrocytes11. To specify spheroids resembling the ventral forebrain or the subpallium (hSS), we exposed early spheroids that were patterned by double SMAD inhibition to small molecules modulating the WNT and SHH pathways in the presence of the growth factors FGF2 and EGF (Fig. 1a; Supplementary Table 1). At day 25 of hSS in vitro differentiation, we observed a strong induction of the transcription factor NKX2-1 in hSS accompanied by high levels of FOXG1 expression and down-regulation of the pallial marker EMX1, suggestive of a subpallial fate (Fig. 1b; Supplementary Table 2). We next examined the hSS cytoarchitecture in cryosections and noticed that NKX2-1 was expressed in ventricular zone (VZ)-like structures at day 25 (Fig. 1c) but was distributed more broadly at later stages (Fig. 1d). At day 60, we observed strong expression of GABA and the GABA-synthesizing enzyme GAD67 in neurons (Fig. 1e, f). Of the known markers that identify GABAergic subtypes, somatostatin (SST), calretinin (CR) and calbindin (CB) were the most strongly expressed; at later stages (> 200 days), and consistent its expression later in development in vivo12, parvalbumin (PV) was also present (Fig. 1g, h; Extended Data Fig. 1).
Figure 1. Characterization of hSS derived from hPSC.

(a) Generation of hCS and hSS. (b) Fold changes (relative to gene expression in hPSC; normalized to GAPDH) of NKX2–1 (n= 6 hPSC lines; Mann-Whitney test, P= 0.002), FOXG1 (n= 5 hPSC lines; t-test, P= 0.35) and EMX1 (n= 4 hPSC lines; Mann-Whitney test, P= 0.02) in hCS and hSS at day 25. (c, d) Immunostaining of hSS for NKX2–1, (e, f) GABA, GAD67 and MAP2, and (g, h) SST, CR, CB, PV. (i, j) Single cell profiling of hCS and hSS. (k) AT volume in hSS for MAP2, GFAP, SYN1 and VGAT. (l) Patch clamping in sliced hSS and a representative trace of whole-cell current-clamp recording. (m, n) Spontaneous IPSCs before (black) and during (blue) application of gabazine in an hSS slice (paired t-test, **P= 0.004).
To comprehensively characterize hSS and hCS, we performed single cell transcriptional profiling at day 105 of differentiation using stochastic barcoding13 (n= 11,838 cells from hCS and hSS; BD™ Resolve system; Fig. 1i). Clustering of cells isolated from either hCS or hSS using the t-Distributed Stochastic Neighbor Embedding (t–SNE)14 revealed a separation of the two conditions. Neurons expressing STMN2 were localized on the upper left of the t–SNE space, whereas progenitors and mitotically active cells were distributed in the lower right (Extended Data Fig. 2a–c). Further examination identified several subdomains in hCS (Fig. 1j, Extended Data Fig. 2d), including a group of glutamatergic neurons (VGLUT1+) expressing the cortical layer markers TBR1, FEZF2, CTIP2; two groups of intermediate progenitors expressing TBR2, INSM1, HES6; and a group of dorsal progenitors expressing LHX2, PAX6 and GLAST1 that also encompass HOPX+ outer radial glia-like cells. In contrast, hSS included a cluster of ventral neural progenitors, a group of GABAergic cells expressing DLX1, GAD1, SLC32A1, SCG2, SST, and a small group of oligodendrocyte progenitors (OLIG2, SOX10) (Supplementary Table 3; Extended Data Fig. 2e–m). Astroglia from both hCS and hSS clustered together and close to a small group of cells that resemble the choroid plexus (TTR+, SLC13A4+). No cells with mesodermal or endodermal identity were found.
We next explored the functional properties of hSS. We found that 7 days of exposure to the neurosteroid and GABAA receptor agonist allopregnanolone (AlloP) combined with a 3-day exposure to retinoic acid (RA), significantly increased the frequency of spontaneous calcium spikes (Extended Data Fig. 3a–c). Notably, exposure to AlloP with or without RA did not alter subpallial fate, neurotransmitter identity or the GABAergic subtypes in hSS (Extended Data Fig. 3d–l). As a result, these two conditions were used for subsequent experiments. Considering the presence of spontaneous calcium activity and astrocytes (Fig. 1j), we investigated synaptogenesis in hSS using array tomography (AT). We found expression of the presynaptic protein synapsin-1 (SYN1) and the vesicular GABA transporter VGAT (Fig. 1k). Lastly, we used whole-cell patch clamping to record from neurons in sections of hSS and found that ~75% of neurons generated action potentials in response to depolarization (Fig. 1l). At the same time, ~60% of neurons exhibit spontaneous inhibitory postsynaptic currents (IPSCs) that reverse in direction around the chloride reversal potential and are abolished by the GABAA receptor antagonist gabazine (10 μM) (Fig. 1m, n; in contrast to synaptic currents in hCS, as shown in Extended Data Fig. 4).
ASSEMBLY OF FOREBRAIN SPHEROIDS
To develop a model for the migration of interneurons into the cerebral cortex, we placed hCS and hSS adjacent to each other inside a conical tube (Fig. 2a). We used day 60 hCS that resembled the mid-gestation pallium11, a developmental stage characterized by extensive migration of interneurons. After 3 days, the two spheroids fused (Fig. 2b). we used viral labeling of spheroids before assembly to monitor cell migration, and used a previously described DNA element near the Dlx1 and Dlx2 locus (Dlxi1/2b) that labels medial ganglionic eminences (MGE) and derivatives15,16. Approximately 65% of Dlxi1/2b::eGFP+ cells in hSS expressed GAD67 and contained GABA and markers for GABAergic neuron subtypes (Extended Data Fig. 5a–d). We then used live imaging to monitor the position of Dlxi1/2b::eGFP+ cells in fused hSS-hCS over multiple weeks. We observed a progressive movement of eGFP+ cells from hSS into hCS (Fig. 2c; Supplementary Video 1). This movement was specific to fused hSS-hCS and unidirectional: we observed minimal movement either from hCS into hSS in fused hSS-hCS or from hSS into hSS in fused hSS-hSS (Fig. 2d; Extended Data Fig. 5e, f). The same pattern of migration could be observed for hSS-hCS assembled at later stages (Extended Data Fig. 5g). When hSS were plated on a coverslip, the migration was inefficient or absent (Extended Data Fig. 5h–j; Supplementary Video 2) similar to rodent cultures17. In the first 10 days after assembly, the vast majority of Dlxi1/2b::eGFP+ cells that migrated away from hSS had the leading process positioned towards hCS at either a 45° or 90° angle relative to the interface (Extended Data Fig. 5k). At 30–50 days after asssembly, 60% of the migrated cells were localized within the outer 100 μm of hCS (Extended Data Fig. 5l), and a large population of interneurons migrated into hCS as shown by optical clearing (Fig. 2e). Interestingly, we also observed processes of Dlxi1/2b::eGFP+ cells that briefly touched VZ-like regions, reminiscent of rodent ventricle-directed migration18 (Supplementary Video 3; Extended Data Fig. 5m–o). We next investigated the fate of Dlxi1/2b::eGFP+ cells in hSS after 2 weeks of migration from hSS into hCS by isolating single cells and performing transcriptome analysis (Extended Data Fig. 6a). We found that the majority of migrated cells expressed subpallial markers (DLX1, DLX2, DLX5, DLX6) and cortical interneuron markers (GAD1, GAD2, VGAT, CELF4) (Extended Data Fig. 6b; Extended Data Fig. 7a–d). We found few cells expressing PAX6 or TH, which are indicative of olfactory interneurons, or SP8, GSX2 or CHAT, which are indicative of striatal neurons, suggesting that the Dlxi1/2b reporter is primarily labelling cortical interneurons (Extended Data Fig. 6b).
Figure 2. Cell migration in fused hSS-hCS.

(a) Assembly of hCS and hSS. (b) Morphology before and after assembly. (c) Time-lapse of migration from hSS into hCS. (d) Assembly of hCS (AAV-hSYN1::mCherry) and hSS (Lenti-Dlxi1/2b::eGFP). (e) iDISCO-cleared hSS-hCS. (f, g) Saltatory migration of Dlxi1/2b::eGFP+ cells in fused hSS-hCS and (h) nucleokinesis. (I, j) Saltatory migration of Dlxi1/2b::eGFP+ cells in human fetal forebrain and (k) nucleokinesis.
We next used confocal imaging to capture the movement of Dlxi1/2b::eGFP-labelled cells in fused hSS-hCS. Interneurons moved in a saltatory pattern followed by extensive pauses (Fig. 2f). This characteristic, cyclical movement involved an extension of the leading process in one direction followed by a transient swelling of the soma and nuclear translocation (nucleokinesis) (Fig. 2g, h). This pattern of migration is similar to that observed in rodents19,20, although the ratio between the length of the leading process and the diameter of the soma in hSS-derived interneurons is almost double the ratio in mouse interneurons (Extended Data Fig. 8). To validate the biological relevance of interneuron migration in hSS-hCS, we performed live imaging of cells labelled with the Dlxi1/2b::eGFP reporter in human forebrain tissue (gestational weeks, GW18 and GW20; Fig. 2i). Dlxi1/2b::eGFP-labeled cells in fetal tissue co-expressed GABA and NKX2–1 (Extended Data Fig. 8a–f) and displayed a similar morphology and pattern of migration (Fig. 2j, k; Extended Data Fig. 8g–l; Supplementary Videos 4 & 5).
We tested pharmacological manipulation of interneuron migration in fused hSS-hCS (Extended Data Fig. 7e). We imaged the movement of Dlxi1/2b::eGFP cells before and after exposure to a CXCR4 receptor antagonist (AMD3100). This receptor is expressed in hSS (Extended Data Fig. 3l) and plays a key role in the migration of cortical interneurons21. AMD3100 treatment resulted in a significant reduction in saltation frequency, saltation length, speed when mobile (Extended Data Fig. 7f–h) and a change in the path directness (Extended Data Fig 7i, j; Supplementary Video 6).
USING ASSEMBLED SPHEROIDS TO MODEL TIMOTHY SYNDROME
We next investigated whether assembled hSS-hCS could be used to model migration defects. Previous work in rodents has indicated that L-type calcium channels (LTCCs) play a critical role in interneuron migration by regulating saltation frequency and migration termination17. LTCCs have been repeatedly associated with neuropsychiatric disease22,23, and gain-of-function mutations in the LTCCs-encoding CACNA1C gene lead to Timothy syndrome (TS)– a severe neurodevelopmental disorder characterized by autism spectrum disorder and epilepsy24,25. We generated hSS and hCS from hiPSCs from 3 patients with TS carrying the recurrent p.G406R substitution (Fig. 3a) and compared them to 4 control subjects (Extended Data Fig. 9a, b; Supplementary Table 1). We did not observe defects in the differentiation of TS hiPSC lines into hSS (Extended Data Fig. 9c–g). Calcium imaging showed increased residual calcium following depolarization in hSS-derived TS neurons, as well as in hCS-derived TS neurons compared to control cells (Fig. 3b; Extended Data Fig. 9h, i), similar to what we have previously shown in TS hiPSC-derived glutamatergic neurons26. We investigated the migration of Dlxi1/2b::eGFP+ cells in fused hSS-hCS (Fig. 3c; Extended Data Fig. 9j; Supplementary Video 7) and found an increase in saltation frequency in neurons from all three TS patients (Fig. 3d; Extended Data Fig. 9k) in agreement with the role of calcium in interneuron motility17. Interestingly, the saltation length and the speed when mobile were reduced in TS (Fig. 3d, e; Extended Data Fig. 9l, m) resulting in a less efficient migration (Fig. 3f). Moreover, this effect was cell-autonomous because migration of Dlxi1/2b::eGFP+ cells from TS-hSS into control-hCS did not influence the phenotype (Fig. 3d, e; Extended Data Fig. 9k–m). To further validate these results, we electroporated cDNA encoding TS– and wild type (WT)– CaV1.2 into slices of mouse E14 ganglionic eminences and performed live imaging (Extended Data Fig. 9n, o). We observed a defect in mouse TS-CaV1.2 electroporated neurons displaying more frequent but shorter saltations (Extended Data Fig. 9p, q). To determine if the TS migratory phenotype was a result of LTCCs activity and could be reversed, we treated fused hSS-hCS with LTCCs blockers (Fig. 3g; Extended Data Fig. 9r–u). We found that application of the LTCCs blocker nimodipine significantly reduced saltation length and speed when mobile in control Dlxi1/2b::eGFP+ cells. However, the deficit in these parameters was rescued in TS Dlxi1/2b::eGFP+ cells following exposure to nimodipine. Moreover, roscovitine, a cyclin-dependent kinase inhibitor that increases voltage-dependent inactivation of CaV1.227,28, also rescued saltation length in TS Dlxi1/2b::eGFP+ cells. These results indicate that the migration defect in interneurons carrying the TS gain-of-function mutation can be restored by reducing the activity of LTCCs.
Figure 3. Modeling of interneuron migration in hSS-hCS derived from Timothy syndrome.

(a) TS mutation in Cav1.2. (b) Calcium imaging in dissociated hSS (Ctrl: n= 38 cells from 2 subjects; TS: n= 68 cells from 2 subjects). (c) Migration of Dlxi1/2b::eGFP+ cells in TS and control hSS-hCS. (d, e) Number of saltations (Ctrl: n= 48 cells from 3 hiPSC lines derived from 3 subjects; TS: n= 51 cells from 3 hiPSC lines derived from 3 subjects; TS-Ctrl hybrid: n= 24 cells from 5 hiPSC line combinations from 2 TS and 2 Ctrl subjects), and saltation length (Ctrl: n= 21 cells from 3 hiPSC lines derived from 3 subjects; TS: n= 29 cells from 3 hiPSC derived from 3 subjects; TS-Ctrl hybrid: n= 12 cells from 3 hiPSC line combinations from 2 TS and 3 Ctrl subjects); one-way ANOVA with Dunnett’s multiple comparison test (***, P< 0.001). (f) Migration of TS and control Dlxi1/2b::eGFP+ cells in fused hSS-hCS (two-way ANOVA, interaction F(24, 408)= 17.71, P< 0.0001). (g) Saltation length following exposure to nimodipine (paired t-test; Ctrl: n= 13 cells from 3 hiPSC lines derived from 3 subjects, ***P< 0.001; TS: n= 12 cells from 2 hiPSC lines derived from 2 subjects, ***P< 0.001).
INTEGRATION OF INTERNEURONS IN ASSEMBLED SPHEROIDS
To investigate the hSS-derived neurons that migrated into hCS, we examined their single cell transcriptome at 4 weeks after assembly (Fig. 4a). t-SNE analysis indicated 3 clusters (Fig. 4b), with Dlxi1/2b::eGFP+ cells in hSS distributed primarily in cluster A, while Dlxi1/2b::eGFP+ cells migrated into hCS primarily distributed in clusters B and C (Fig. 4c). Cells in all clusters expressed similar levels of GAD1 and CELF4, but cluster B and C down-regulated the subpallial marker PBX3 (Extended Data Fig. 6c; Supplementary Table 4). Migrated cells displayed expression changes in genes previously associated with interneuron migration, including ERBB4, NNAT, MALAT1, SOX11 and NXPH129,30 (Fig. 4d). These neurons also had higher levels of activity-dependent genes, including FOS, the AMPA-receptor trafficking regulator GRIP231 and IGF132, as well as the disease-related genes RASD133, TCF434 (Fig. 4d; Extended Data Fig. 6c). We next examined dendrites of Dlxi1/2b::eGFP+ cells in hSS and in fused hSS-hCS. We found that hSS-derived cells that moved into hCS increased the complexity of their branching (Fig. 4e; Extended Data Fig. 10a, b). We then measured their electrical properties in hSS before and after assembly. We found that Dlxi1/2b::eGFP+ cells that had migrated into hCS had double the maximum action potential generation rate as compared to Dlxi1/2b::eGFP+ cells in unfused hSS or to non-migrated cells in fused hSS-hCS (Fig. 4f; Extended Data Fig. 10c). We then assessed the integration of migrated neurons by using AT and observed the presence of gephyrin (GPHN), a postsynaptic protein localized to GABAergic synapses, in hCS fused to hSS but not in unfused hCS (Fig. 4d; Extended Data Fig. 10d). We constructed ‘synaptograms’ consisting of a series of high-resolution sections through a single synapse, and found colocalization of eGFP from Dlxi1/2b-labeled cells with the presynaptic proteins SYN1 and VGAT and adjacent to the postsynaptic protein GPHN (Extended Data Fig. 10e). To investigate the presence of functional synapses in migrated Dlxi1/2b::eGFP+ neurons, we performed whole-cell voltage clamp recordings in sliced hSS-hCS. We found that Dlxi1/2b::eGFP+ that migrated into hCS display both excitatory postsynaptic currents (EPSCs, downward deflecting) and IPSCs (upward deflecting) (Fig. 4h). Moreover, after migration into hCS, these cells primarily receive EPSCs rather than IPSCs and their synaptic input increases approximately 3-fold (Fig. 4i; Extended Data Fig. 10f; Supplementary Table 5). In parallel, glutamatergic neurons from hCS, which exhibit only EPSCs before assembly, also begin receiving IPSCs and show an overall increase in synaptic input following the migration of interneurons from hSS (Fig. 4j; Extended Data Fig. 10g). Lastly, to assess the functional integration of hCS and hSS neurons into neural networks, we applied electrical stimulation to the hCS side of assembled hSS-hCS to trigger glutamate release from excitatory neurons in the vicinity of the stimulation electrode while simultaneously recording EPSCs and IPSCs in Dlxi1/2b::eGFP+ cells that migrated into hCS (Extended Data Fig. 10h, i). We found that electrical simulation evoked EPSCs (eEPSCs) immediately following simulation (> 5 ms); this was followed by presumed multisynaptic IPSCs (< 15 ms) that were sensitive to gabazine. Together, these data demonstrate that hSS integrate with hCS to assemble functional human microcircuits in 3D cultures.
Figure 4. Functional integration of interneurons in fused hSS-hCS.

(a) Isolation of Dlxi1/2b::eGFP+ cells for transcriptional analysis. (b) t-SNE visualization of single cell gene expression at day 121 (4 weeks after hSS-hCS assembly). (c) Distribution across clusters (χ2-test, χ2= 43.39, P< 0.0001). (d) Expression of ERBB4, NXPH1, IGF1, TCF4, FOS, RAD1. (e) Morphology of Dlxi1/2b::eGFP+ cells before and after migration into hCS (f) Action potential generation in Dlxi1/2b::eGFP+ cells (one-way ANOVA, F(2, 30)= 1.25; ***P< 0.001; Bonferroni post-hoc, **P< 0.01; ***P< 0.001). (g) GABAergic synapse (by AT) on the pallial side of hCS-hSS with SYN1, GPHN and VGAT. (h) EPSCs and IPSCs in Dlxi1/2b::eGFP+ cells after migration. (i) Synaptic responses in Dlxi1/2b::eGFP+ cells (two-way ANOVA, interaction F(2, 61)= 18.46, P< 0.0001; Bonferroni post-hoc for EPSCs, ***P< 0.0001, **P< 0.001). (j) Synaptic responses in excitatory cells (two-way ANOVA, cortical neurons in hCS before and after assembly F(1, 26)= 5.6, P< 0.05; Bonferroni post-hoc for IPSC, *P< 0.05).
DISCUSSION
We demonstrate the generation of a human 3D microphysiological system that includes functionally-integrated glutamatergic and GABAergic neurons. This platform has several advantages in comparison to previous adherent or 3D methods9,10,16,35–38. First, it involves the directed differentiation of subdomains of the forebrain that functionally interact in development. In contrast to whole-brain organoids and organoids resembling broader brain regions35,38, this approach allows for modularity by combining separately patterned spheroids into multi-region neural 3D cultures. Second, this system captures in vitro more elaborate developmental processes, including the saltatory migration of interneurons towards the cerebral cortex. Using live imaging of the human forebrain, we demonstrate that this migration is accurately recapitulated with our assembled 3D platform. Third, by enabling their migration into an active neural network, interneurons integrate into a synaptically-connected microphysiological system without the requirement of seeding onto rodent cortical cultures or brain slices. Assembling networks using this modular system may facilitate the study of excitation to inhibition interplay during cortical development.
We also demonstrate that forebrain subdomains derived from hiPSCs and fused in vitro can be used to identify the transcriptional changes associated with interneuron migration and to model disease processes that are otherwise inaccessible. We find that cortical interneurons derived from TS subjects display a cell-autonomous migration defect whereby they move more frequently but less efficiently. Moreover, the TS interneuron defect is rescued by pharmacologically manipulating LTCC. This aberrant interneuron migration, taken together with our previous studies in cortical glutamatergic neurons26,39,40, suggest the presence of abnormal cortical development and function in TS.
Lastly, the in vitro specification of various subdomains of the developing human brain from hPSC and their assembly into 3D cultures opens the opportunity for studying the interaction of specific neuronal cell types and for generating and probing neural circuits within personalized human microphysiological systems.
MATERIALS AND METHODS
Culture of hPSCs
The hPSC lines used in this study were validated using standardized methods as previously shown26,41. Cultures were tested for and maintained Mycoplasma free. A total of 6 control hiPSC lines derived from fibroblasts harvested from 5 subjects (2 males and 3 females), plus the human embryonic stem cell line H9, and 7 hiPSC lines derived from fibroblasts harvested from 3 subjects with TS (1 female and 2 males) carrying the pG406R mutation were used for experiments (Supplementary Table 1; subjects 7643 and 9862 are from26,41). The TS point mutation in exon 8a of CACNA1C was verified by PCR as previously described41. The hiPSC line H20961 was derived by the Gilad laboratory42. Approval for this study was obtained from the Stanford IRB Panel and informed consent was obtained from all subjects.
Generation from hPSC of hCS and hSS
Human pluripotent stem cells (hiPSC or hESC) were cultured on inactivated mouse embryonic fibroblast feeders (EmbryoMax PMEF; Millipore) in hPSC medium containing DMEM/F12 (1:1, Life Technologies, 11330), Knockout Serum (20%, Life Technologies, 10828), non-essential amino acids (1 mM, Life Technologies, 11140), GlutaMax (1: 200, Life Technologies, 35050), β-mercaptoethanol (0.1 mM; Sigma-Aldrich M3148), penicillin and streptomycin (1:100, Life Technologies, 15070), and supplemented with FGF2 (10 ng/ml diluted in 0.1% BSA; R&D Systems).
The generation of hCS from hPSC was performed as previously described11. To initiate the generation of hCS or hSS, intact hiPSC colonies were lifted from the plates using dispase (0.35 mg/ml) and transferred into ultralow attachment plastic dishes (Corning) in hPSC medium supplemented with the two SMAD inhibitors dorsomorphin (DM; 5 μM; Sigma) and SB-431542 (SB; 10 μM, Tocris), and the ROCK inhibitor Y-27632 (10 μM; EMD Chemicals). For the first five days, the hPSC medium was changed every day and supplemented with dorsomorphin and SB-431542. On the sixth day in suspension, neural spheroids were transferred to neural medium (NM) containing Neurobasal-A (Life Technologies, 10888), B-27 supplement without vitamin A (Life Technologies, 12587), GlutaMax (Life Technologies, 1:100), penicillin and streptomycin (Life Technologies, 1:100) and supplemented with the growth factors EGF (20 ng/ml; R&D Systems) and FGF2 (20 ng/ml; R&D Systems) until day 24. For the generation of hSS, the medium was supplemented with additional small molecules during the first 23 days in culture; a schematic showing the recipes is presented in Supplementary Fig. 4a). The hSS-IS condition involved the addition of the Wnt pathway inhibitor IWP-2 (5 μM; Selleckchem) from day 4 until day 24, and the SHH pathway agonist SAG (smoothened agonist; 100 nM; Selleckchem) from day 12 to day 24. The hSS-ISA condition also included IWP-2 (inhibitor of WNT production–2) and SAG (smoothened agonist) with the addition of allopregnanolone (AlloP 100 nM; Cayman Chemicals) from day 15 to day 23, while the hSS-ISRA condition included AlloP (100nM) from day 15–23, and a brief exposure (day 12–15) to retinoic acid (RA 100 nM; Sigma). From day 25 to 42, the NM for both the hCS and hSS conditions, was supplemented with the growth factors BDNF (20 ng/ml; Peprotech) and NT3 (20 ng/ml; Peprotech) with medium changes every other day. From day 43 onwards, hCS and hSS were maintained in unsupplemented NM with medium changes every four to six days.
Viral labeling and assembly of neural spheroids
The viral infection of the 3D neural spheroids was performed as previously described11,43. Briefly, hCS or hSS were transferred to a 1.5 ml microcentrifudge Eppendorf tube containing 300 μl ΝΜ with virus and incubated overnight. The next day, neural spheroids were transferred into fresh NM medium in ultralow attachment plates. Lentivirus (Lenti-Dlxi1/2b::eGFP; construct reported and applied in refs15,16 and received from J.L. Rubenstein) was generated by transfecting HEK293T cells with Lipofectamine 2000 (Thermo Fisher Scientific) and concentrating the supernatant with the Lenti-X concentrator (Clontech) 72 hrs later. Adenovirus (AAV-DJ1-hSYN::mCherry) was generated in the Stanford Gene Vector and Virus Core at Stanford.
To assemble the forebrain spheroids, hCS and hSS (~60 to 90 days of in vitro differentiation), which were virally labeled 8–10 days before, were transferred to a 1.5 ml microcentrifudge Eppendorf tube for three days and placed in an incubator. During this time, more than 95% of hCS and hSS fused. These hSS-hCS cultures were carefully transferred into 24 well ultralow attachment plates (Corning) using a cut P-1000 pipette tip and medium changes were performed very gently every two to three days.
Cryopreservation
hCS were fixed in 4% paraformaldehyde (PFA) and 8% sucrose for 30 min to 2 hrs. They were then washed in PBS, transferred to 15% sucrose solution overnight at 4°C and then to 30% sucrose for 48–72 hrs. Subsequently, they were transferred into embedding medium (Tissue-Tek OCT Compound 4583, Sakura Finetek), snap-frozen on dry ice and stored at −80°C. For immunohistochemistry, 10 to 20 μm thick sections were cut using a cryostat (Leica). Human brain tissue was fixed in 4% PFA for 48 hrs, washed in PBS and transferred to 30% sucrose for one week. Sections were then embedded in OCT and 30% sucrose (1:1) and sectioned into 30 μm sections using a Leica cryostat.
Immunohistochemistry
Cryosections were washed with PBS to remove excess OCT and blocked in 10% goat serum (NGS), 0.3% Triton X-100 diluted in PBS for 1 hr at room temperature. The sections were then incubated overnight at 4°C with primary antibodies diluted in PBS containing 10% GS and 0.3% Triton X-100. PBS was used to wash off the primary antibodies and the cryosections were incubated with secondary antibodies in PBS with 10% NGS and 0.3% Triton X–100 for 1 hr. The following primary antibodies were used for immunohistochemistry: anti–NKX2.1 (rabbit, 1:200; Santa Cruz: sc-13040), anti–MAP2 (guinea pig, 1:1,000; Synaptic Systems: 188004), anti–GABA (rabbit, 1:1,000; Sigma: A2052), anti–GAD67 (mouse, 1:1,000; Millipore: MAB5406), anti–SST (rat, 1:200; Millipore: MAB354), anti–CR (rabbit, 1:1,000; Swant: CR7697), anti–CB (rabbit, 1:1,000; Swant: CB38), anti–PV (rabbit, 1:6,000; Swant: PV27), anti–PV (mouse 1:1,000; Millipore: MAB1572), anti–GFP (chicken, 1:1,500; GeneTex: GTX13970), anti–DCX (guinea pig, 1:1,000; Millipore: AB2253); anti–TBR1 (rabbit, 1:200; Abcam: AB31940), anti–GFAP (rabbit, 1:1,000; DAKO Z0334), anti–CTIP2 (rat, 1:300; Abcam: AB18465), anti–OCT4 (rabbit, 1:200, Cell Signaling Technology), anti–SSEA4 (mouse, 1:200, Cell Signaling Technology). AlexaFluo Dyes (Life Technologies) were used at 1:1000 dilution for amplifying the signal. Nuclei were visualized with Hoechst 33258 (Life Technologies). Cryosections were mounted for microscopy on glass slides using Aquamount (Thermo Scientific) and imaged on a Zeiss M1 Axioscope or Leica TCS SP8 confocal microscope. Images were processed in ImageJ (Fiji).
Dissociation of hCS and hSS
For the enzymatic dissociation of hCS and hSS for culture in monolayer and immunocytochemistry, spheroids were incubated with Accutase (Innovative Cell Technologies) for 25 min at 37°C, washed with NM and gently triturated using a P-200 pipet. Cells were plated on poly-ornithine/laminin (Sigma) coated glass coverslips (15 mm; Werner) at a density of ~1 spheroid per two coverslips in NM supplemented with BDNF and NT3.
To dissociate hCS and hSS for single cell profiling, we adapted a previously published protocol used for primary human fetal brain tissue44. Briefly, up to 6 spheroids were chopped using a #10 blade and then incubated in papain enzyme solution (27.3 U/ml; Worthington), EBSS (1×, Sigma), 0.46% Sucrose (Sigma), 26 mM NaHCO3 (Sigma), 0.5 mM EDTA (Sigma) at 37°C for 70 min in an incubator (5% CO2). The digested spheroids were then washed and carefully triturated in a trypsin inhibitor solution EBSS, 0.46% Sucrose (Sigma), 26 mM NaHCO3 (Sigma), 15–30 mg Trypsin Inhibitor (Sigma). After centrifugation, the pellet was resuspended in 0.2% BSA diluted in PBS and supplemented with Y-27632 (10 μM; EMD Chemicals) and the cells were used for FACS.
Mouse slice cultures
Organotypic cultures of mouse coronal forebrain slices were prepared following published methods45 with some modifications. Whole brains from E14–E18 mouse embryos were embedded in 4% low-melting point agarose and slices were cut at 250–300 μm using a Leica VT1200 vibrotome in complete HBSS (100 ml of 10× HBSS without Ca or Mg, 2.5 ml of 1M HEPES buffer at pH 7.4, 30 ml of 1M D-glucose, 10 ml of 100 mM CaCl2, 10 ml of 100 mM MgSO4, and 4 ml of 1 M NaHCO3). Slices with visible forebrain structures were placed in membrane inserts (diameter, 13 mm; pore size, 8 μm; Costar) coated with Poly-L-orthinine and Laminin (Sigma) overnight. They were cultured in a Basal Medium Eagle (39 mL, Life Technologies, #21010046) supplemented with 12.9 ml of complete HBSS, 1.35 ml of 1M D-glucose, 250 μl of 200 mM GlutaMax (Life Technologies) and 5% heat-inactivated horse serum (Life Technologies, 26050070). Slices were imaged using a Leica SP8 confocal microscope. Approval for rodent experiments was obtained from the Stanford University’s Administrative Panel on Laboratory Animal Care (APLAC).
Electroporation of mouse slices
Coronal slices of mouse embryonic forebrain at E14 were prepared as described above. Sections were transferred into tissue culture dishes containing complete HBSS for ~1 hour, after which CAG-Cav1.2 (WT– or TS–CACNA1C) plasmids were focally co-injected with CAG::GFP at a ratio of 1:0.5 directly into the ganglionic eminence through a glass micropipette. Cav1.2 overexpression constructs were generated by insertion of PCR-amplified WT– and TS–Cav1.2 coding sequences from dihydropyridine-insensitive Cav1.2 constructs39 into pCAGIG (kind gift from C. Cepko through Addgene, plasmid 11159)46. Slices were then electroporated using two horizontally oriented platinum electrodes powered by a BTX Square Pulse Electroporator, and placed onto cell culture membrane inserts for subsequent live imaging 48 hrs later as described below.
Human Tissue
Human tissue was obtained under a protocol approved by the Research Compliance Office at Stanford University. The tissue was processed using an adapted protocol47. Briefly, GW18 or GW20 frontal brain tissue was embedded in 4% low-melting point agarose in bubbled artificial cerebrospinal fluid (ACSF: 125 mM NaCl, 2.5 mM KCl, 1 mM MgCl2, 2 mM CaCl2, 1.25 mM NaH2PO4, 25 mM NaHCO3, 25 mM D-(+)-Glucose) and either sectioned using a Leica VT1200 Vibratome at 300–500 μm in ice-cold, bubbled ACSF, or cut using the sharp end of a gauge–22 needle to obtain 1–2 mm thick sections. The sections were then placed in tissue culture plates containing culture media (66% BME, 25% Hanks, 5% FBS, 1% N-2, 1% penicillin, streptomycin and glutamine; all from Invitrogen) and 0.66% D-(+)-Glucose (Sigma) and incubated (37°C, 5% CO2) with the Dlxi1/2b::eGFP lentivirus for 30 min to 1 hr. Sections were then transferred to cell culture membrane inserts (diameter, 13 mm; pore size, 8 μm; Costar) and incubated in culture media at 37°C, 8% O2, 5% CO2 for up to 8 days. Half media changes were performed every other day. After ~5 days in culture, Dlxi1/2b::eGFP+ cells could be detected and were subsequently imaged as described below.
Live imaging and analysis of Dlxi1/2b::eGFP+ cell migration
The migration of Dlxi1/2b::eGFP+ cells was imaged for 8–12 hrs under environmentally controlled conditions (37°C, 5% CO2) in intact, fused hSS-hCS using a confocal microscope with a motorized stage (Leica SP8). Fused hSS-hCS were transferred to a well of a 96–well plate (glass-bottom plates, Corning) in 200 μl of NM. Spheroids were incubated in an environmentally controlled chamber for 30–60 min prior to imaging. During a given recording session, up to 8 fused hSS-hCS were imaged at a depth of 50–150 μm and at a rate of 15–20 min/frame. For pharmacological manipulation, cells were imaged for 12 hrs to record a baseline. Then, the media was carefully removed and new media with small molecules (AMD3100 at 100 nM; nimodipine at 5 μM; or roscovitine at 15 μM) was gently added to the well. The field of view was readjusted to capture the previous region of interest and cells in fused hSS-hCS were imaged for an additional 12 hrs.
For imaging of Dlxi1/2b::eGFP+ cells, E17–E18 slices were placed on inserts and infected with Dlxi1/2b::eGFP lentivirus after 24 hrs. The slices were imaged 2 days later using a Leica SP8 confocal microscope (see above).
For measuring the branch to soma length ratio of human cells on mouse slices, hSSs infected with Dlxi1/2b::eGFP lentivirus were dissociated and placed on top of E13–14 mouse slices, which were placed on cell culture inserts 8–24 hrs before. The hSS-derived Dlxi1/2b::eGFP+ cells were imaged with the Leica SP8 confocal microscope system at least 48 hrs later.
The migration of mouse Dlxi1/2b::eGFP+ cells or Cav1.2–electroporated cells and the migration of human fetal Dlxi1/2b::eGFP–infected cells were both imaged with the same setting described for intact, fused hSS-hCS. Slices were kept on the cell culture inserts during imaging.
For quantification of migration of Dlxi1/2b::eGFP+ cells after plating on coverslips, intact hSS were plated on Poly-ornithine/laminin (Sigma) coated glass coverslips (15 mm; Werner). Cells were imaged 7–10 days after using a confocal microscope (Leica SP8) as described above.
ImageJ and the Chemotaxis & Migration Tool (Ibidi) were used for the post-acquisition analysis of cell mobility. The StackReg plugin in ImageJ was used to correct for minor drifts during imaging. To estimate the length of individual saltations, Dlxi1/2b::eGFP cells displaying a swelling of the soma were identified, and distance (in μm) to the new position of the soma following nucleokinesis was recorded manually. The time necessary for this movement was used to calculate the speed when mobile. To estimate directness of movement, the x and y coordinates of each cell per frame and time were extracted with the Manual Tracking plugin (ImageJ) and the Chemotaxis & Migration Tool (Ibidi) was used to calculate the Accumulated (A) and Euclidian (E) distances traveled per cell over time. Path directness was calculated as the E/A ratio. Videos were processed using ImageJ and Final Cut Pro X.
Fura-2 calcium imaging of hSS or hCS cultures
Dissociated hSS (day 62) or hCS (day 123) derived from control and TS lines were cultured on poly-L-ornithine and laminin (Sigma) coated coverslips for 4–5 days. The cultures were incubated with 1 μM Fura-2 acetoxymethyl ester (Fura-2AM; Invitrogen) for 25 min at 37°C in NM medium, washed for 5 min and placed in a perfusion chamber on the stage of an inverted fluorescence microscope (TE2000U; Nikon). Cells were then stimulated with high-KCl Tyrode’s solution (67 mM KCl, 67 mM NaCl2 mM CaCl2, 1 mM MgCl2, 30 mM glucose and 25 mM HEPES, pH 7.4). Imaging was performed at room temperature (25°C) on an epifluorescence microscope equipped with an excitation filter wheel and an automated stage. Openlab software (PerkinElmer) was used to collect and quantify time-lapse excitation ratio images. Fluorescence images were analyzed using the IGOR Pro software (WaveMetrics). Residual calcium following high-KCl depolarization was calculated by dividing the plateau calcium level by the peak calcium elevation ((C – A)/(B – A); Fig. 3b).
Fluo-4 calcium imaging in intact hSS
Intact hSS at day 43–52 were incubated with 10 μM Fluo-4 acetoxymethyl ester (Fluo-4AM; Invitrogen) for 30 min in NM media followed by a 15 min wash with NM. A Leica SP8 confocal microscope with a resonant scanner was used for imaging. Spontaneous calcium activity was recorded for 10 min (one frame every 8–10 s) in one 10 μm z-stack plane. Fluorescence intensity (F) was exported as mean gray values in ImageJ. Signal decay was controlled by subtracting the mean fluorescence of the background (Fb). To estimate changes in intracellular calcium, ΔF was computed as (Fcell– Fb)/F0, where F0 represents the minimum F value per cell across the whole 10 min of recording from which Fb was subtracted. A ΔF >1.2 was defined as a spike.
iDISCO
To optically clear fixed fused spheroids, we adapted the iDISCO protocol described by Renier et al48. Briefly, after fixation with 4% PFA for 3 hrs, spheroids were dehydrated with a day-long methanol (MetOH) dilution series (20% to 100% MetOH). Next, they were incubated in 5% H2O2 overnight at 4°C. The following day, they were rehydrated with a reverse MetOH dilution series and incubated overnight in 0.2% Triton-X, 20% DMSO, 0.3 M Glycine/PBS at 37°C. The spheroids were then blocked with 0.2% Triton-X, 10% DMSO, 6% goat serum/PBS at 37°C for 2 days, followed by a heparin treatment for 2 hrs (PTwH: 0.2% Tween-20, 10 μg/mL Heparin/PBS) to reduce non-specific antibody binding. They were next incubated with a chicken anti–GFP (1:1500; GeneTex: GTX13970) antibody for 2 days in PTwH with 5% DMSO and 3% goat serum at 37°C. After a day-long wash series with PTwH, a secondary antibody diluted in PTwH, 3% goat serum was added for an additional two days at 37°C. After 2 days of PTwH washes, the spheroids were cleared by a three-step tetrahydrofuran (THF) series (80%, 100%, 100% THF/H2O), a 10 min dichloromethane step, and a short incubation in dichloromethane (DBE). The cleared spheroids were stored and imaged in DBE on a Leica SP8 confocal microscope.
Real time quantitative PCR (qPCR)
mRNA was isolated using the RNeasy Mini Kit and RNase-Free DNase set (Qiagen), and template cDNA was prepared by reverse transcription using the SuperScript III First-Strand Synthesis SuperMix for qRT-PCR (Life Technologies). Real time qPCR was performed using SYBR GREEN (Roche) on a ViiA7 machine (Applied Biosystems, Life Technologies). Data was processed using the QuantStudio RT-PCR software (Applied Biosystems). Primers used are listed in Supplementary Table 2.
Single cell gene expression (BD Resolve system)
To capture transcriptomic information of hiPSCs-derived hCS and hSS (IS) single-cells, we used the BD Resolve system (BD Genomics, Menlo Park, CA) as previously reported with modifications13. Multiple hCS or hSS at day 105 of differentiation were combined and dissociated enzymatically into single cells, and processed in one batch. Single cell capture was achieved by random distribution of a single cell suspension across >200,000 microwells via a limited dilution approach. Beads with oligonucleotide barcodes were added to saturation such that a bead was paired with a cell in a microwell. Cell lysis buffer was added such that poly-adenylated RNA molecules hybridize to the beads. Beads were collected into a single tube for reverse transcription. Upon cDNA synthesis, each cDNA molecule was tagged on the 5′ end (i.e., 3′ end of mRNA transcript) with a molecular index and cell label indicating its cell of origin. Whole transcriptome libraries were prepared using the BD Resolve single cell whole transcriptome amplification workflow. Briefly, second strand cDNA was synthesized, followed by ligation of adaptor for universal amplification. Eighteen cycles of PCR were used to amplify the adaptor ligated cDNA products. Sequencing libraries were prepared using random priming PCR of the whole transcriptome amplification products to enrich the 3′ end of the transcripts linked with the cell label and molecular indices.
Sequencing libraries were quantified using a High Sensitivity DNA Chip (Agilent) on a Bioanalyzer 2100 and the Qubit High Sensitivity DNA Assay (Thermo Fisher Scientific). 1.5 pM of the library for each sample was loaded onto a NextSeq 500 system and sequenced using High Output sequencing kits (75 × 2bp) (Illumina).
The BD Resolve analysis pipeline was used to process sequencing data (fastq files). Cell labels and molecular indices were identified, and gene identity was determined by alignment against the gencode comprehensive hg19 reference. A table containing molecule counts per gene per cell was output. 7,663 and 4,983 cells were identified for hCS and hSS, respectively, with an average number of reads of ~14,800, an average of ~3,710 molecules and ~1,700 number genes detected per cell with an average molecular index coverage (i.e. number of times a molecule was sequenced) of ~2. A total of 34,242 genes were detected across all cells. Cells with mitochondrial gene (with gene symbol starting with MT) content > 25%, were discarded retaining 7,126 and 4,712 cells for hCS and hSS (IS), respectively. Pseudogenes were removed. The distribution of reads per single cell is shown in Extended Data Fig. 2m. For visualization and clustering, the data tables of the two libraries were concatenated, and the combined table was further reduced to retain only the most variable genes using the method outlined in Macosko et al49, yielding 1,102 genes. t–SNE projection of the data was performed using default parameters14. To determine the set of genes contributing to the separation of cell clusters, differential gene expression analysis (DEseq) based on negative binomial distribution50 was conducted to compare gene expression profiles in cells in each cluster versus those in the rest of the data set. Genes were ranked by smallest P values (expressed in terms of –log10) and the list of significantly over-represented genes with –log10 (P-value) < 10 of each cluster is provided as Supplementary Table 3. Patterns of expression for the top 25 genes in each cluster are shown in Extended Data Fig. 2e–l). A very small group of hCS-derived cells clustered with the GABAergic interneuron subdomain, and differential gene expression indicated that these cells expressed TBR1, RELN, PAX6 and CALB2.
Single cell RNA-seq (Smart-seq2)
For assessing gene expression in Dlxi1/2b::eGFP+ cells in hSS and in hCS of fused hSS-hCS, we used a single-cell RNA-Seq assay adapted from the Smart-seq-2 protocol reported by Picelli et al51. In short, hSS and hCS that had been fused for ~15 days were separated with a scalpel blade and dissociated independently as described. Single-cells were isolated by FACS into a 96-well PCR plate containing 5 μl of lysis buffer containing 0.04% Triton X-100 (10%, Sigma BioUltra), 0.1 μl recombinant RNase inhibitor (TaKaRa), 1 μl Oligo-dT30VN (10 μM), 1 μl of 10 mM dNTP mix (Fermentas) and nuclease-free H20 for a final volume of 5 μl. A known number of internal RNA control (ERCC) was added to the lysis master mix to estimate the technical variability between the wells of the same plate and between plates. Reverse transcription and PCR amplification were performed using the parameters described by Picelli et al51. The quality of the cDNA library was checked using a High-Sensitivity DNA chip (Agilent Bioanalyzer). Libraries were prepared using the Nextera XT library prep kit (96 index primers, Illumina). Because the Nextera XT kit is very sensitive to the concentration of cDNA, we screened pre-amplified cDNA libraries from all plates using the Qubit dsDNA HS Assay kit and used 125 pg cDNA from each positive well to further process the tagmentation and indexing. Twelve additional PCR cycles were performed to further enrich for pre-amplified tagmented DNA. The quality of the tagmented library was checked using the High-Sensitivity Bioanalyzer chip. The final pooled library was diluted to 2 nM using the elution buffer (Qiagen), and 10 pM was loaded on an Illumina HiSeq 2500 instrument for sequencing. Libraries were sequenced to obtain 50 bp single end reads (TruSeq Rapid kit, Illumina) with 8 additional cycles for indexing. On average, we obtained 2 million pass filter reads per single cell (Extended Data Fig. 6c). We considered a gene expressed if there were at least 10 reads detected for that gene. Cells that expressed more than 1,000 genes and <10% mitochondrial RNAs were kept for analysis. To avoid bias during FACS from RNA contamination from the glutamatergic neurons on the hCS side of the fused hSS-hCS, we analyzed STMN2+ cells that did not express SLC17A6 or SLC17A7. To control for technical noise, we used a quantitative statistical analysis52 to detect biological variable genes and used them for further analysis. To cluster and visualize the cells, we used the t-SNE method in the computational software package Seurat53.
Array tomography (AT)
AT was used to collect high-resolution images of synapses within neural spheroids using previously published protocols11,54. Briefly, fused hSS-hCS were fixed in 4% paraformaldehyde in phosphate buffered saline. To preserve GFP fluorescence, the tissue was dehydrated with up to 70% alcohol only, with processing through 50% ethanol, 70% ethanol, 1:3 70% ethanol:LR White Resin (LRW, medium grade, SPI supplies), and LRW overnight before embedding in LRW. The embedded tissue was sectioned into ribbons of 70 nm thick sections (~30 sections/ribbon) and each ribbon was immunostained in 2–3 rounds of staining with the antibodies eluted after each round. The following primary antibodies were used for immunostaining: anti–GFP (chicken, 1:200; Genetex: 13970, 1:200), anti–SYN1 (rabbit, Cell Signalling: 5297S, 1:500), anti–PSD95 (rabbit, Cell Signalling: 3450S), anti–VGUT1 (guinea pig, 1:5000; Millipore: AB5905), anti–Gephyrin (mouse, 1:100; BD Biosciences: 612632), anti–VGAT (guinea pig, 1:200; Synaptic Systems 131004), anti–VGAT (mouse, 1:200; Synaptic Systems: 131011), anti–GFAP (chicken, 1:300; Aves), anti–MAP2 (guinea pig, 1:1000; Synaptic Systems: 188004). Sections were visualized on a Zeiss Axio Imager.Z1 upright fluorescence microscope using AxioVision software (rel 4.7, Zeiss). Images were processed and registered using FIJI/ImageJ with standard and custom plugins (code.google.com/p/smithlabsoftware). FIJI/ImageJ was used for volume reconstruction.
Electrophysiology
Sections of hCS, hSS (day 96–141) or fused hSS-hCS (29–53 daf) for physiological recordings were obtained using an approach we previously described11. Briefly, spheroids were incubated in bicarbonate buffered artificial cerebrospinal fluid (aCSF) at 23°C and equilibrated with a mixture of 95% O2 and 5% CO2. The aCSF solution contained: 126 mM NaCl, 26 mM NaHCO3, 10 mM glucose, 2.5 mM KCl, 1.25 mM NaH2PO4, 1 mM MgSO4, and 2 mM CaCl2. Slicing was performed using a Leica VT1200 vibratome. Immediately after sectioning, slices were moved to a circulation chamber containing oxygenated aCSF at 32°C. For patch-clamp recording, cells were identified by the presence of a fluorescent reporter using an upright Axoscop II microscope (Zeiss). Recording electrodes of borosilicate glass had a resistance of 4–6 MΩ when filled with internal solution. A low Cl− internal solution was used to distinguish between EPSCs and IPSCs containing: 145 mM K+ gluconate, 0.1 mM CaCl2, 2.5 mM MgCl2, 10 mM HEPES, 0.2 mM EGTA, 4 mM Na+ phosphocreatine. Cl− reversal was calculated to be at −91 mV according to the Nernst equation. A high Cl− internal solution was used to measure EPSCs in a subset of unfused hSS containing: 135 mM CsCl, 10 mM HEPES, 10 mM EGTA, 3 mM MgATP, 0.3 mM GTP. The Cl− reversal potential was calculated to be 0 mV according to the Nernst equation. IPSCs were blocked by application of the GABAA receptor antagonist gabazine (10 μM, Abcam), which was added to superfused aCSF. EPSCs were blocked by application of the glutamate receptor antagonist kynurenic acid (1 mM, Abcam), which was added to superfused aCSF. Electrical simulation was delivered using a bipolar tungsten electrode (FHS) placed 200–400 μM away from a recorded neuron. Stimulations were delivered to slices for 0.1 ms at 300 μV and separated by at least 10 s. Inward EPSCs and outward IPSPs were recorded by filling the patch pipette with a low chloride internal solution (ECl–= −90 mV) and holding the cell at −40 mV, which is near the midpoint between ECl– and EK+/Na+. Notably, the average shape of sIPSCs recorded in hSS displayed a prolonged decay as compared to the average EPSCs recorded from hCS, as is commonly observed in cortical neurons55 (Extended Data Fig. 4b).
Data were collected using a 1550A digitizer (Molecular Devices), a 700B patch-clamp amplifier (Molecular Devices) and acquired with the pClamp 10.6 software (Molecular Devices). Recordings were filtered at 10 kHz. Synaptic recordings were analyzed using custom software developed by J.R.H. (Wdetecta). Action potentials were analyzed using custom MATLAB (MathWorks) programs. IPSCs and EPSCs were detected based on their direction and shape. We calculated the first time derivative of the current recording and set a detection threshold that was above the noise for each trace. Detected responses were then evaluated to confirm the detection accuracy.
Statistics
Data are presented as mean ± s.e.m. unless otherwise indicated. Distribution of the raw data was tested for normality of distribution; statistical analyses were performed using the Student’s t-test, Mann-Whitney U-test, χ2-test, or ANOVA with posthoc tests as indicated. Sample sizes were estimated empirically or based on power calculations. Blinding was used for all analyses comparing patients and control samples.
Extended Data
Extended Data Figure 1. Immunostaining of hSS in cryosections showing PV neurons.

Two anti–PV antibodies have been used to validate specificity; co-localization with the neuronal marker DCX (day 209).
Extended Data Figure 2. Single cell gene expression of hCS and hSS at day 105 of differentiation (n= 11,838 cells; BD Resolve system).

(a) Distribution of expression of the neuronal marker STMN2, (b) the progenitor marker VIM and of (c) a set of genes associated with the M cell cycle phase (AURKB, TPX2, UBE2C, HMMR, TOP2A, CCNB1, NUSAP1, NUF2, CDC6, HIST1H4C, BIRC5, CKS2). (d) Boxplots for genes enriched in each t-SNE cluster shown in Fig. 1j. (e–l) Top 25 genes in each of the 8 clusters shown in Fig. 1j (proportion of molecules per cells). (m) Scatter plot showing the number of genes detected versus the number of useful reads.
Extended Data Figure 3. Characterization of hSS differentiation conditions.

(a) Schematic illustrating the differentiation conditions for deriving hCS or hSS: IS, ISA and and ISRA. (b) Representative traces of intracellular calcium measurements (Fluo-4) demonstrating spontaneous activity in hSS at ~day 50 of differentiation. (c) Average calcium spike frequency in 3 distinct hSS differentiation conditions: IS (n= 114 cells), ISA (n= 327 cells), ISRA (n= 136 cells); cells derived from 3 hiPSC lines; one-way ANOVA, F(3, 719)= 5.86, ***P< 0.001. (d) Gene expression (qPCR, normalized to GAPDH) showing down-regulation of OCT4 and the lack of mesoderm (BRACH) and endoderm (SOX17) markers following differentiation of hiPSC into hCS and hSS conditions. (e) Gene expression (qPCR, fold change versus hiPSC and normalized to GAPDH) showing upregulation of forebrain markers (SIX3, FOXG1) but not midbrain (LMX1B), hypothalamus (RAX1) or spinal cord (HOXB4) markers. (f) Expression of ventral forebrain genes in hSS and hCS (qPCR, normalized to GAPDH) at day 25. (g) Average percentage of the proportion of NKX2–1 by immunostaining in dissociated hCS or hSS at day 25. (h) Expression of ventral forebrain genes in hSS (qPCR, normalized to GAPDH) at day 60. (i) Expression of glutamatergic, GABAergic, dopaminergic and cholinergic neurotransmitter identify genes in hSS (qPCR, normalized to GAPDH) at day 60. (j) Average percentage of the proportion of MAP2/Hoechst and GAD67/MAP2 by immunostaining in dissociated hSS at day 60. (k, l) Expression of interneuron subtypes genes and markers associated with interneuron migration in hSS (qPCR, normalized to GAPDH) at day 60. Number of lines hiPSC used indicated on each column. Data are mean ± s.e.m.
Extended Data Figure 4. Electrophysiological recordings of hCS and hSS.
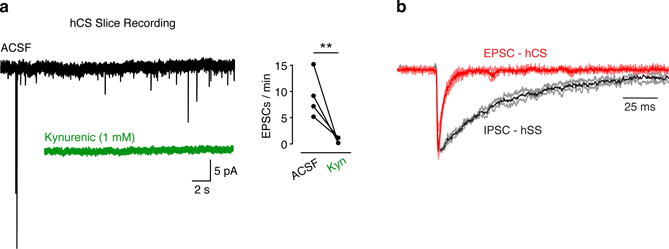
(a) Representative EPSC traces of recordings from hCS neurons (sliced preparation) before (black) and during (green) exposure to the glutamate receptor blocker kynurenic acid (1 mM) (Mann-Whitney U-test, **P= 0.007). (b) Overlap of averaged EPSCs (red) recorded in hCS neurons (n= 6 cells) and averaged IPSCs (black) recorded in hSS (n= 5 cells). Data are mean ± s.d.
Extended Data Figure 5. Migration of Dlxi1/2::eGFP+ cells in fused hSS-hCS.

(a, b) Representative immunostaining in cryosections of hSS showing co-expression of Dlxi1/2::eGFP and GAD67 and GABA. (c) Quantification by immunostaining of the proportion of Dlxi1/2::eGFP+ cells that co-express GAD67 in hSS derived using the ISA or ISRA condition (n= 3 hiPSC lines; t-test, P= 0.35). (d) Proportion of Dlxi1/2::eGFP and GAD67 positive cells in hSS derived using the ISA or ISRA condition that co-express SST (t-test, P= 0.48), CR (t-test, *P= 0.04) or CB (t-test, P= 0.43); n = 3 hiPSC lines. (e) Representative images of hSS-hCS at day 60 showing migration of Dlxi1/2b::eGFP+ cells (from fluorescently labeled hSS) in fused hSS-hCS but not in hSS-hSS over time. (f) The number of Dlxi1/2b::eGFP+ (hSS-derived) or hSYN1::mCherry cells (hCS-derived) that moved in hSS-hCS or hSS-hSS was quantified in snapshots of live, intact spheroids at different time points (from day 3 to 25). The values shown are absolute number of cells that migrated to the other side (approximately the same area and thickness was imaged in each session); one-way ANOVA for cells at 17 days after assembly; F(2, 32)= 8.24, P= 0.001. (g) Representative images of fused hSS-hCS at day 91 showing migration of Dlxi1/2b::eGFP+ cells (from fluorescently labeled hSS) into fused hSS-hCS. (h) Representative image of an hSS that was plated on a glass coverslip and cultured for ~7 days. (i) Percentage of Dlxi1/2::eGFP inside the coverslip-plated hSS, in the rim (0–200 μm) or beyond this region (> 200 μm). (j) Quantification of the number of saltations of Dlxi1/2b::eGFP+ cells (n= 32 cells) inside the one-week coverslip-plated hSS, in the rim and outside this region (one-way ANOVA, interaction F (2, 30)= 22.12, P< 0.001; Bonferroni post-hoc ***P< 0.0001). (k) Diagram showing the angle of movement of migrating Dlxi1/2b::eGFP+ cells at 8–9 days after assembly of hSS-hCS. The angle was calculated between the leading process of Dlxi1/2b::eGFP+ cells that have moved into hCS and the fusion interface (n= 92 cells from 5 hiPSC lines). (l) Histogram showing the distribution of the distance of migrated Dlxi1/2b::eGFP+ cells relative to the edge of hCS in hSS-hCS at 30–50 days after assembly. The distance was measured in fixed 18 μm cryosections (n= 73 cells from 2 hiPSC lines). (m, n, o) Representative examples of Dlxi1/2b::eGFP+ cells migrated in the hCS that moved within a VZ-like region. The VZ-like region contains GFAP-expressing cells, is surrounded by TBR1+ cells and the migrated cells show GABA expression. Supplementary Video 2 shows movement of Dlxi1/2b::eGFP+ cells that is reminiscent of the ventricular-directed migration described in rodents.
Extended Data Figure 6. Single cell gene expression of Dlxi1/2b::eGFP+ cells in hSS and hCS (Smart-seq2).

(a) Scheme showing the isolation by dissociation and fluorescence-activated cell sorting (FACS) of Dlxi1/2b::eGFP+ cells from hSS or hCS for single cell transcriptional analysis. (b) Violin plots showing expression in Dlxi1/2b::eGFP+ cells of selected genes associated with cortical, striatal and olfactory interneurons in hSS (light green, n= 123 cells) or hCS (dark green; n= 106 cells) at 2 weeks after assembly of hSS-hCS. (c) Violin plots showing expression in Dlxi1/2b::eGFP+ cells (at 4 weeks after assembly of hSS-hCS) in clusters A, B, and C (likelihood ratio test; GAD1, CELF4: P> 0.05; PBX3: P< e−7 for A versus B & C; NNAT: P< e−16 for C versus A & B, P< e−16 for B versus A & C; MALAT1: P< e−9 for C versus A & B; SOX11: P< e−16 for B versus A & C, P< e−9 for A versus B & C; GRIP2: P< e−8 for B versus A & C). (d) Scatter plot showing the number of genes detected (≥ 10 reads cutoff) versus the number of reads (n= 410 cells from combined single cell RNA-seq experiments after 2 weeks or 4 weeks of assembly in hSS-hCS). (e) Graph illustrating biologically variable transcripts (red circles) and non-variable transcripts (black circles) along with the technical noise from the ERCC spike in RNAs (blue dots). Green line shows the technical noise fit.
Extended Data Figure 7. Immunocytochemistry and pharmacology in fused hSS-hCS.

(a, b, c, d) Representative images of immunostainings for SST, GAD67, GABA, CR, CB in Dlxi1/2b::eGFP+ cells after migration in fused hSS-hCS. (e) Scheme illustrating the pharmacological manipulation of Dlxi1/2b::eGFP+ cells that are migrating in hSS-hCS. (f, g, h, i) Quantification of Dlxi1/2b::eGFP+ cell migration before and after exposure to 100 nM of the CXCR4 antagonist AMD3100 (n= 8 cells from 2 hiPSC lines; paired t-tests, *P= 0.03 for number of saltations, **P= 0.006 for saltation length, **P= 0.006 for speed when mobile, *P= 0.02 for path directness). (j) Plot illustrating the trajectory of Dlxi1/2b::eGFP+ cells in fused hSS-hCS before and after exposure to AMD3100. Data are mean ± s.e.m.
Extended Data Figure 8. Migration of Dlx2i1/2b::eGFP cells in mouse and human forebrain brain slices versus hSS-hCS.

(a, b, c) Representative images of human fetal cortex at GW20 showing immunostaining with antibodies against GFAP, BCL11B (CTIP2) and GABA. (d) Representative image showing cell labeling with the Dlx2i1/2b::eGFP reporter in human forebrain at GW18 (6 days after lentivirus infection) (e, f) Representative immunostainings in cryosections of human tissue at GW18 showing co-localization of Dlx2i1/2b::eGFP with NKX2-1 and GABA. (g) Representative images showing cell labeling with the Dlx2i1/2b::eGFP reporter in hSS-hCS (9 days after assembly), in human forebrain (GW18) and in mouse slice cultures (E18). (h, i) Comparison of Dlx2i1/2b::eGFP+ cell size and quantification of the ratio of soma diameter to the length of the leading process in fused hSS-hCS (n= 25 cells from 4 hiPSC lines), human forebrain at GW18 (n= 19 cells; black) and GW20 (n= 15 cells; gray), hSS-derived cells cultured on E14 mouse forebrain slices (n= 14 cells), and E18 mouse forebrain slices (n= 30 cells from 2 litters) (one-way ANOVA, interaction F(3, 97)= 11.61, P= 0.001, Bonferroni post-hoc ***P< 0.001, **P< 0.05). (j, k, l) Comparison of the number of saltations (n= 56 cells from 2 hiPSC lines; one-way ANOVA, interaction F(2, 103)= 29.27, P= 0.001, Bonferroni post-hoc ***P< 0.001), saltation length (n= 44 cells from 3 hiPSC lines; one-way ANOVA, interaction F(2, 91)= 3.0, P= 0.50), speed when mobile (n= 38 cells from 3 hiPSC lines; one-way ANOVA, interaction F(2, 83)= 11.38, P= 0.001, Bonferroni post-hoc ***P< 0.001) for Dlx2i1/2b::eGFP+ in fused hSS-hCS, human fetal forebrain (GW18: n= 19 cells; GW20: n= 15 cells), and E18 mouse forebrain slices (n= 14 cells for saltation length and speed, n= 16 cells for number of saltations from 2 litters). Data are mean ± s.e.m.
Extended Data Figure 9. Derivation of TS hSS, migration and electroporation.

(a) Sequencing of PCR-amplified DNA showing the p.G406R mutation in exon 8a of CACNA1C in TS (subject: 8303). (b) Representative images of hiPSC colonies expressing pluripotency markers (OCT4, SSEA4) in one TS subject (c) Level of gene expression (RT-qPCR, normalized to GAPDH) for NKX2-1 showing no defects in ventral forebrain induction in TS (two-way ANOVA; interaction F(2,15)= 0.20, P= 0.81; TS versus Ctrl F(1,15)= 0.16, P= 0.68). (d–g) Representative immunostainings in cryosections of TS hSS (day 60) showing expression of NKX2-1, GABA, MAP2, GAD67, SST and CR. (h) Calcium imaging (Fura-2) in dissociated hCS derived from TS subjects and controls (Ctrl: n= 81 cells from 2 subjects; TS: n= 147 cells from 2 subjects). Quantification of residual intracellular calcium ([Ca2+]i) following 67 mM KCl depolarization of Ctrl and TS cells in hCS cells. Residual [Ca2+]i was calculated by dividing the plateau calcium (C–A) level by the peak calcium elevation (B−A); (t-test, ***P< 0.001). (i) Quantification of [Ca2+]i following depolarization of Ctrl and TS cells in hSS (t-test, ***P< 0.001). (j) Representative image of fused TS hSS-hCS showing Dlxi1/2b::eGFP expression and migration. (k, l) Quantification of the number of saltations and saltation length of Dlx2i1/2b::eGFP cells in fused hSS-hCS across multiple Ctrl and TS lines (related to Fig. 3d, e). (m) Quantification of the speed when mobile of Dlxi1/2b::eGFP cells in fused hSS-hCS (Ctrl: n= 21 cells from 3 hiPSC lines derived from 3 subjects; TS: n= 29 cells from 3 hiPSC lines derived from 3 subjects; TS-Ctrl hybrid: n= 12 cells from 3 hiPSC line shown combinations; one-way ANOVA with Dunnett’s multiple comparison test; ***P< 0.001). (n) Electroporation of cDNA encoding the TS– and WT– CaV1.2 channels into slices of mouse E14 ganglionic eminences (GE). (o) Representative example of time-lapse live imaging depicting the saltatory migration of GFP+ cells in slices electroporated with CAG::GFP and either the WT–or the TS– CACNA1C. (p, q) Quantification of the number of saltations (t-test; **P< 0.01) and saltation length (t-test; ***P< 0.001) of GFP+ cells in electroporated mouse forebrain slices (WT: n= 33 cells; TS: n= 23 cells; from 3 litters). (r) Scheme illustrating pharmacological manipulation of LTCC during live imaging of fused hSS-hCS. (s) Quantification of speed when mobile following exposure to the LTCC blocker nimodipine (5 μM) (paired t-test; Ctrl: n= 13 cells from 3 hiPSC lines derived from 3 subjects, ***P< 0.001; TS: n= 12 cells from 2 hiPSC lines derived from 2 subjects, **P< 0.005). (t) Quantification of saltation length following exposure to roscovitine (15 μM) (paired t-test; Ctrl: n= 7 cells from 2 hiPSC lines derived from 2 subject, **P< 0.005; TS: n= 12 cells from 2 hiPSC lines derived from 2 subjects; ***P< 0.001). (u) Quantification of speed when mobile following exposure to roscovitine (15 μM) (paired t-tests; Ctrl: n= 9 cells from 2 hiPSC lines derived from 2 subjects, ***P< 0.001; TS: n= 12 cells from 2 hiPSC lines derived from 2 subjects; P= 0.05). Data are mean ± s.e.m.
Extended Data Figure 10. Characterization of Dlxi1/2b::eGFP+ cells after migration.

(a) Representative images of 3D–reconstructed Dlxi1/2b::eGFP+ cell morphologies before and after migration from hSS into hCS. (b) Quantification of dendritic branching of Dlxi1/2b::eGFP+ cells in hSS (n= 58 cells) and in hCS (n= 55 cells) of fused hSS-hCS (two-way ANOVA; interaction F(2, 129)= 11.29, P< 0.001; Bonferroni post-hoc *P< 0.05, ***P< 0.001). (c) Representative examples of action potentials (slice recordings) in Dlxi1/2b::eGFP+ cells in unfused hSS, in hSS of fused hSS-hCS and in hCS after migration in fused hSS-hCS. (d) AT showing expression of the GABAergic synapse marker GPHN (green) colocalized with SYN1 (red) in hCS of fused hSS-hCS but not in unfused hCS; the glutamatergic marker PSD95 (cyan) colocalized with SYN1 is found in both fused and unfused hCS (equal volumes 1.2 μm deep). (e) AT of a Dlxi1/2b::eGFP+ synapse illustrating the colocalization with SYN1 (red), GPHN (cyan), and VGAT (white); 5 consecutive 70 nm sections (3 × 3 μm). (f) Representative examples of whole-cell voltage clamp recordings of IPSCs and EPSCs from Dlxi1/2b::eGFP+ cells in unfused hSS, in fused hCS-hSS, or after migration in hCS (g) Representative examples of whole-cell voltage clamp recordings of IPSCs and EPSCs in cells recorded from unfused hCS cells and fused hCS cells. (h) Electrical stimulation and patch clamp recording in fused hSS-hCS showing evoked EPSCs and IPSCs before (black) and after exposure to 10 μM gabazine (red). (i) Average peri-stimulus synaptic events (IPSCs and EPSCs) in Dlxi1/2::eGFP+ cells recorded in the hCS side of fused hSS-hCS before and after electrical stimulation (paired t-test, *P< 0.05). Data are mean ± s.e.m.
Supplementary Material
Acknowledgments
We thank J. Y. Park, K. Sabatini, T. Khan, S. Yoon, H. Gai, L. Elahi at Stanford University, R.E. Dolmetsch at Novartis Institutes for Biomedical Research, and N. Bansal, J. Fan at BD Genomics for technical advice and support.
This work was supported by grants from NIH/National Institute of Mental Health (NIMH) grants 1R01MH100900 and 1R01MH100900-02S1, NIMH BRAINS Award R01MH107800, the California Institute of Regenerative Medicine (CIRM), the MQ Fellow Award, the Donald E. and Delia B. Baxter Foundation Scholar Award, the Kwan Research Fund and Stanford Start-up Funds (to S.P.P.), Child Research Health Institute Postdoctoral Fellowship (CHRI) (to F.B. and to N.H.), Idun Berry Postdoctoral Fellowship (to J.A.) the Stanford Medicine Dean’s Fellowship (to F.B., J.A., N.H.), the American Epilepsy Society and Wishes for Elliott Foundation Fellowship (to C.D.M.), NIH 5P01HG00020526 (to L.M.S.), the UCSF Program for Breakthrough Biomedical Research, Sandler Foundation (G.P.)
Footnotes
AUTHOR CONTRIBUTION
F.B., J.A. developed the differentiation platform and assays. C.D.M. and J.R.H. designed, conducted and analyzed the electrophysiological experiments. F.B, J.A., N.H., N.T. contributed to neural differentiation, live imaging experiments and analysis. F.B. and J.A. were able to replicate the differentiation and spheroid assembly independently. S.I., W.W., H. C.F., K.C.M., L.M.S. contributed the single cell experiments. N.A.O. performed the array tomography. J.A.B., J.F.H. recruited and characterized the subjects. G.P., J.A., F.B. performed or analyzed the electroporation experiments. F.B, J.A. and S.P.P. conceived the project, designed experiments and wrote the paper with input from all authors. S.P.P. supervised all aspects of the work.
COMPETING FINANCIAL INTERESTS
H. C.F. and K.C.M. were employees of BD Genomics during this study.
DATA AVAILABILITY STATEMENT:
Gene expression data are available in the Gene Expression Omnibus under accession codes: GSE93811 (BD Resolve) and GSE96045 (Smartseq-2).
The data that support the findings of this study are available on request from the corresponding author (S.P.P.).
Stanford University has filled a provisional patent application that covers the generation of region-specific neural spheroids and their assembly for studying development and disease.
References
- 1.Kepecs A, Fishell G. Interneuron cell types are fit to function. Nature. 2014;505:318–326. doi: 10.1038/nature12983. [DOI] [PMC free article] [PubMed] [Google Scholar]
- 2.Wonders CP, Anderson SA. The origin and specification of cortical interneurons. Nat Rev Neurosci. 2006;7:687–696. doi: 10.1038/nrn1954. [DOI] [PubMed] [Google Scholar]
- 3.Silbereis JC, Pochareddy S, Zhu Y, Li M, Sestan N. The Cellular and Molecular Landscapes of the Developing Human Central Nervous System. Neuron. 2016;89:248–268. doi: 10.1016/j.neuron.2015.12.008. [DOI] [PMC free article] [PubMed] [Google Scholar]
- 4.Bartolini G, Ciceri G, Marin O. Integration of GABAergic interneurons into cortical cell assemblies: lessons from embryos and adults. Neuron. 2013;79:849–864. doi: 10.1016/j.neuron.2013.08.014. [DOI] [PubMed] [Google Scholar]
- 5.Rubenstein JL, Merzenich MM. Model of autism: increased ratio of excitation/inhibition in key neural systems. Genes Brain Behav. 2003;2:255–267. doi: 10.1034/j.1601-183x.2003.00037.x. [DOI] [PMC free article] [PubMed] [Google Scholar]
- 6.Marin O. Interneuron dysfunction in psychiatric disorders. Nat Rev Neurosci. 2012;13:107–120. doi: 10.1038/nrn3155. [DOI] [PubMed] [Google Scholar]
- 7.Tabar V, Studer L. Pluripotent stem cells in regenerative medicine: challenges and recent progress. Nat Rev Genet. 2014;15:82–92. doi: 10.1038/nrg3563. [DOI] [PMC free article] [PubMed] [Google Scholar]
- 8.Pașca SP, Panagiotakos G, Dolmetsch RE. Generating human neurons in vitro and using them to understand neuropsychiatric disease. Annual review of neuroscience. 2014;37:479–501. doi: 10.1146/annurev-neuro-062012-170328. [DOI] [PubMed] [Google Scholar]
- 9.Maroof AM, et al. Directed differentiation and functional maturation of cortical interneurons from human embryonic stem cells. Cell Stem Cell. 2013;12:559–572. doi: 10.1016/j.stem.2013.04.008. [DOI] [PMC free article] [PubMed] [Google Scholar]
- 10.Nicholas CR, et al. Functional maturation of hPSC-derived forebrain interneurons requires an extended timeline and mimics human neural development. Cell Stem Cell. 2013;12:573–586. doi: 10.1016/j.stem.2013.04.005. [DOI] [PMC free article] [PubMed] [Google Scholar]
- 11.Pasca AM, et al. Functional cortical neurons and astrocytes from human pluripotent stem cells in 3D culture. Nature methods. 2015;12:671–678. doi: 10.1038/nmeth.3415. [DOI] [PMC free article] [PubMed] [Google Scholar]
- 12.Uylings HBM, Delallec I, Petanjekc Z, Koenderinka MJT. Structural and immunocytochemical differentiation of neurons in prenatal and postnatal human prefrontal cortex. Neuroembryology. 2002;1:176–186. [Google Scholar]
- 13.Fan HC, Fu GK, Fodor SP. Expression profiling. Combinatorial labeling of single cells for gene expression cytometry. Science. 2015;347:1258367. doi: 10.1126/science.1258367. [DOI] [PubMed] [Google Scholar]
- 14.van der Maaten L, Hinton G. Visualizing Data using t-SNE. J Mach Learn Res. 2008;9:2579–2605. [Google Scholar]
- 15.Potter GB, et al. Generation of Cre-transgenic mice using Dlx1/Dlx2 enhancers and their characterization in GABAergic interneurons. Mol Cell Neurosci. 2009;40:167–186. doi: 10.1016/j.mcn.2008.10.003. [DOI] [PMC free article] [PubMed] [Google Scholar]
- 16.Sun Y, et al. A deleterious Nav1.1 mutation selectively impairs telencephalic inhibitory neurons derived from Dravet Syndrome patients. eLife. 2016;5 doi: 10.7554/eLife.13073. [DOI] [PMC free article] [PubMed] [Google Scholar]
- 17.Bortone D, Polleux F. KCC2 expression promotes the termination of cortical interneuron migration in a voltage-sensitive calcium-dependent manner. Neuron. 2009;62:53–71. doi: 10.1016/j.neuron.2009.01.034. [DOI] [PMC free article] [PubMed] [Google Scholar]
- 18.Nadarajah B, Alifragis P, Wong RO, Parnavelas JG. Ventricle-directed migration in the developing cerebral cortex. Nat Neurosci. 2002;5:218–224. doi: 10.1038/nn813. [DOI] [PubMed] [Google Scholar]
- 19.Anderson SA, Marin O, Horn C, Jennings K, Rubenstein JL. Distinct cortical migrations from the medial and lateral ganglionic eminences. Development. 2001;128:353–363. doi: 10.1242/dev.128.3.353. [DOI] [PubMed] [Google Scholar]
- 20.Bellion A, Baudoin JP, Alvarez C, Bornens M, Metin C. Nucleokinesis in tangentially migrating neurons comprises two alternating phases: forward migration of the Golgi/centrosome associated with centrosome splitting and myosin contraction at the rear. J Neurosci. 2005;25:5691–5699. doi: 10.1523/JNEUROSCI.1030-05.2005. [DOI] [PMC free article] [PubMed] [Google Scholar]
- 21.Stumm RK, et al. CXCR4 regulates interneuron migration in the developing neocortex. J Neurosci. 2003;23:5123–5130. doi: 10.1523/JNEUROSCI.23-12-05123.2003. [DOI] [PMC free article] [PubMed] [Google Scholar]
- 22.Cross-Disorder Group of the Psychiatric Genomics, C. & Genetic Risk Outcome of Psychosis, C. Identification of risk loci with shared effects on five major psychiatric disorders: a genome-wide analysis. Lancet. 2013;381:1371–1379. doi: 10.1016/S0140-6736(12)62129-1. [DOI] [PMC free article] [PubMed] [Google Scholar]
- 23.Schizophrenia Working Group of the Psychiatric Genomics, C. Biological insights from 108 schizophrenia-associated genetic loci. Nature. 2014;511:421–427. doi: 10.1038/nature13595. [DOI] [PMC free article] [PubMed] [Google Scholar]
- 24.Splawski I, et al. Ca(V)1.2 calcium channel dysfunction causes a multisystem disorder including arrhythmia and autism. Cell. 2004;119:19–31. doi: 10.1016/j.cell.2004.09.011. doi:10.1016/j.cell.2004.09.011S0092867404008426[pii] [DOI] [PubMed] [Google Scholar]
- 25.Splawski I, et al. Severe arrhythmia disorder caused by cardiac L-type calcium channel mutations. P Natl Acad Sci USA. 2005;102:8089–8096. doi: 10.1073/Pnas.0502506102. [DOI] [PMC free article] [PubMed] [Google Scholar]
- 26.Pașca SP, et al. Using iPSC-derived neurons to uncover cellular phenotypes associated with Timothy syndrome. Nat Med. 2011;17:1657–1662. doi: 10.1038/nm.2576. doi:nm.2576 [pii]10.1038/nm.2576. [DOI] [PMC free article] [PubMed] [Google Scholar]
- 27.Yarotskyy V, et al. Roscovitine binds to novel L-channel (CaV1.2) sites that separately affect activation and inactivation. J Biol Chem. 2010;285:43–53. doi: 10.1074/jbc.M109.076448. doi:M109.076448 [pii]10.1074/jbc.M109.076448. [DOI] [PMC free article] [PubMed] [Google Scholar]
- 28.Yarotskyy V, Elmslie KS. Roscovitine, a cyclin-dependent kinase inhibitor, affects several gating mechanisms to inhibit cardiac L-type (Ca(V)1.2) calcium channels. Br J Pharmacol. 2007;152:386–395. doi: 10.1038/sj.bjp.0707414. doi:0707414 [pii]10.1038/sj.bjp.0707414. [DOI] [PMC free article] [PubMed] [Google Scholar]
- 29.Zechel S, Zajac P, Lonnerberg P, Ibanez CF, Linnarsson S. Topographical transcriptome mapping of the mouse medial ganglionic eminence by spatially resolved RNA-seq. Genome biology. 2014;15:486. doi: 10.1186/s13059-014-0486-z. [DOI] [PMC free article] [PubMed] [Google Scholar]
- 30.Batista-Brito R, Machold R, Klein C, Fishell G. Gene expression in cortical interneuron precursors is prescient of their mature function. Cereb Cortex. 2008;18:2306–2317. doi: 10.1093/cercor/bhm258. [DOI] [PMC free article] [PubMed] [Google Scholar]
- 31.Mao L, Takamiya K, Thomas G, Lin DT, Huganir RL. GRIP1 and 2 regulate activity-dependent AMPA receptor recycling via exocyst complex interactions. Proc Natl Acad Sci U S A. 2010;107:19038–19043. doi: 10.1073/pnas.1013494107. [DOI] [PMC free article] [PubMed] [Google Scholar]
- 32.Mardinly AR, et al. Sensory experience regulates cortical inhibition by inducing IGF1 in VIP neurons. Nature. 2016;531:371–375. doi: 10.1038/nature17187. [DOI] [PMC free article] [PubMed] [Google Scholar]
- 33.Lacaria M, Gu W, Lupski JR. Circadian abnormalities in mouse models of Smith-Magenis syndrome: evidence for involvement of RAI1. Am J Med Genet A. 2013;161A:1561–1568. doi: 10.1002/ajmg.a.35941. [DOI] [PMC free article] [PubMed] [Google Scholar]
- 34.Blake DJ, et al. TCF4, schizophrenia, and Pitt-Hopkins Syndrome. Schizophr Bull. 2010;36:443–447. doi: 10.1093/schbul/sbq035. [DOI] [PMC free article] [PubMed] [Google Scholar]
- 35.Lancaster MA, et al. Cerebral organoids model human brain development and microcephaly. Nature. 2013;501:373–379. doi: 10.1038/nature12517. [DOI] [PMC free article] [PubMed] [Google Scholar]
- 36.Mariani J, et al. Modeling human cortical development in vitro using induced pluripotent stem cells. Proc Natl Acad Sci U S A. 2012;109:12770–12775. doi: 10.1073/pnas.1202944109. [DOI] [PMC free article] [PubMed] [Google Scholar]
- 37.Kadoshima T, et al. Self-organization of axial polarity, inside-out layer pattern, and species-specific progenitor dynamics in human ES cell-derived neocortex. Proc Natl Acad Sci U S A. 2013;110:20284–20289. doi: 10.1073/pnas.1315710110. [DOI] [PMC free article] [PubMed] [Google Scholar]
- 38.Qian X, et al. Brain-Region-Specific Organoids Using Mini-bioreactors for Modeling ZIKV Exposure. Cell. 2016;165:1238–1254. doi: 10.1016/j.cell.2016.04.032. [DOI] [PMC free article] [PubMed] [Google Scholar]
- 39.Krey JF, et al. Timothy syndrome is associated with activity-dependent dendritic retraction in rodent and human neurons. Nat Neurosci. 2013;16:201–209. doi: 10.1038/nn.3307. [DOI] [PMC free article] [PubMed] [Google Scholar]
- 40.Tian Y, et al. Alteration in basal and depolarization induced transcriptional network in iPSC derived neurons from Timothy syndrome. Genome medicine. 2014;6:75. doi: 10.1186/s13073-014-0075-5. [DOI] [PMC free article] [PubMed] [Google Scholar]
- 41.Yazawa M, et al. Using induced pluripotent stem cells to investigate cardiac phenotypes in Timothy syndrome. Nature. 2011;471:230–234. doi: 10.1038/nature09855. doi:nature09855 [pii]10.1038/nature09855. [DOI] [PMC free article] [PubMed] [Google Scholar]
- 42.Gallego Romero I, et al. A panel of induced pluripotent stem cells from chimpanzees: a resource for comparative functional genomics. eLife. 2015;4:e07103. doi: 10.7554/eLife.07103. [DOI] [PMC free article] [PubMed] [Google Scholar]
- 43.Deverman BE, et al. Cre-dependent selection yields AAV variants for widespread gene transfer to the adult brain. Nat Biotechnol. 2016;34:204–209. doi: 10.1038/nbt.3440. [DOI] [PMC free article] [PubMed] [Google Scholar]
- 44.Zhang Y, et al. Purification and Characterization of Progenitor and Mature Human Astrocytes Reveals Transcriptional and Functional Differences with Mouse. Neuron. 2016;89:37–53. doi: 10.1016/j.neuron.2015.11.013. [DOI] [PMC free article] [PubMed] [Google Scholar]
- 45.Venkataramanappa S, Simon R, Britsch S. Ex utero electroporation and organotypic slice culture of mouse hippocampal tissue. Journal of visualized experiments : JoVE. 2015 doi: 10.3791/52550. [DOI] [PMC free article] [PubMed] [Google Scholar]
- 46.Matsuda T, Cepko CL. Electroporation and RNA interference in the rodent retina in vivo and in vitro. Proc Natl Acad Sci U S A. 2004;101:16–22. doi: 10.1073/pnas.2235688100. [DOI] [PMC free article] [PubMed] [Google Scholar]
- 47.Lui JH, et al. Radial glia require PDGFD-PDGFRbeta signalling in human but not mouse neocortex. Nature. 2014;515:264–268. doi: 10.1038/nature13973. [DOI] [PMC free article] [PubMed] [Google Scholar]
- 48.Renier N, et al. iDISCO: a simple, rapid method to immunolabel large tissue samples for volume imaging. Cell. 2014;159:896–910. doi: 10.1016/j.cell.2014.10.010. [DOI] [PubMed] [Google Scholar]
- 49.Macosko EZ, et al. Highly Parallel Genome-wide Expression Profiling of Individual Cells Using Nanoliter Droplets. Cell. 2015;161:1202–1214. doi: 10.1016/j.cell.2015.05.002. [DOI] [PMC free article] [PubMed] [Google Scholar]
- 50.Anders S, Huber W. Differential expression analysis for sequence count data. Genome biology. 2010;11:R106. doi: 10.1186/gb-2010-11-10-r106. [DOI] [PMC free article] [PubMed] [Google Scholar]
- 51.Picelli S, et al. Smart-seq2 for sensitive full-length transcriptome profiling in single cells. Nature methods. 2013;10:1096–1098. doi: 10.1038/nmeth.2639. [DOI] [PubMed] [Google Scholar]
- 52.Brennecke P, et al. Accounting for technical noise in single-cell RNA-seq experiments. Nature methods. 2013;10:1093–1095. doi: 10.1038/nmeth.2645. [DOI] [PubMed] [Google Scholar]
- 53.Satija R, Farrell JA, Gennert D, Schier AF, Regev A. Spatial reconstruction of single-cell gene expression data. Nat Biotechnol. 2015;33:495–502. doi: 10.1038/nbt.3192. [DOI] [PMC free article] [PubMed] [Google Scholar]
- 54.Micheva KD, Busse B, Weiler NC, O’Rourke N, Smith SJ. Single-synapse analysis of a diverse synapse population: proteomic imaging methods and markers. Neuron. 2010;68:639–653. doi: 10.1016/j.neuron.2010.09.024. [DOI] [PMC free article] [PubMed] [Google Scholar]
- 55.Jang HJ, et al. The development of phasic and tonic inhibition in the rat visual cortex. The Korean journal of physiology & pharmacology : official journal of the Korean Physiological Society and the Korean Society of Pharmacology. 2010;14:399–405. doi: 10.4196/kjpp.2010.14.6.399. [DOI] [PMC free article] [PubMed] [Google Scholar]
Associated Data
This section collects any data citations, data availability statements, or supplementary materials included in this article.