

Abstract
In mammals, taste buds typically contain 50-100 tightly packed taste receptor cells (TRCs) representing all five basic qualities: sweet, sour, bitter, salty and umami1,2. Notably, mature taste cells have life spans of only 5-20 days, and consequently, are constantly replenished by differentiation of taste stem cells3. Given the importance of establishing and maintaining appropriate connectivity between TRCs and their partner ganglion neurons (i.e. ensuring that a labeled line from sweet TRCs connects to sweet neurons, bitter TRCs to bitter neurons, sour to sour, etc.), we examined how new connections are specified to retain fidelity of signal transmission. Our results show that bitter and sweet TRCs provide instructive signals to bitter and sweet target neurons via different guidance molecules (Sema3A and Sema7A)4-6. Here, we demonstrate that targeted expression of Sema3A or Sema7A in different classes of TRCs produce peripheral taste systems with miswired sweet or bitter cells. Indeed, we engineered animals whereby bitter neurons now respond to sweet tastants, sweet neurons respond to bitter, or with sweet neurons responding to sour stimuli. Together, these results uncover the basic logic of the wiring of the taste system at the periphery, and illustrate how a labeled-line sensory circuit preserves signaling integrity despite rapid and stochastic turnover of receptor cells.
Unlike the wiring of the mammalian olfactory system, where odorant receptors play a key role in directing connectivity between olfactory neurons and their targets in the olfactory bulb7,8, taste receptors themselves are not essential for establishing connectivity between TRCs and their targets (i.e. TRCs lacking taste receptors still signal properly when expressing engineered receptors9,10). Thus, we reasoned that as new TRCs are produced, they must express dedicated molecular cues that act as permissive and/or instructive signals4 to establish connectivity with the right complement of taste neurons (Fig. 1a).
Figure 1. Sema3A is expressed in bitter TRCs.
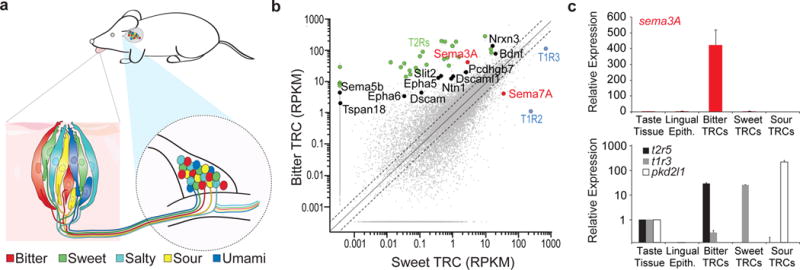
a, Anatomy of the taste system at the periphery. The lower insets illustrate the labeled-lines connecting the different TRCs in a fungiform papillae to matching geniculate ganglion neurons. b, RNASeq data plotting the normalized number of reads (RPKM) in bitter TRCs (TRPM5-BFP+;T2R-GFP+ double-labeled cells) versus in sweet/umami TRCs (TRPM5-BFP+;T2R-GFP−); see Extended Data Figure 1. Colored dots indicate transcripts of interest, including members of the T2R family of bitter taste receptors (green); T1R2 and T1R3 (blue), and candidate connectivity molecules enriched in bitter TRCs (black). Sema3A and Sema7A are labeled in red. c, Quantitative RT-PCR shows highly selective expression of sema3A in bitter TRCs. Lower panel validates the identity of each FAC-sorted TRC population with dedicated TRC marker genes. Data are presented as mean + s.e.m. relative to the expression levels in the taste tissue (circumvallate papilla); n=3. Expression data for candidate Semaphorin receptors in geniculate ganglion neurons is shown in Extended Data Figure 2.
We isolated sweet and bitter TRCs (see Methods for details), performed RNAseq and searched for candidate proteins that could potentially serve to specify the wiring of labeled lines (e.g. adhesion molecules, growth factors, axon guidance molecules, synaptic components)11-13. In this analysis, bitter cells were readily identified by the high levels of expression of bitter taste receptors (Fig. 1b, green symbols)10, while sweet TRCs were characterized by the presence of subunits of the sweet receptor (Fig.1b, blue symbols)9. Several candidate molecules were differentially expressed between classes of TRCs, including semaphorins, protocadherin, and dscams (Fig. 1b; Extended Data Fig. 1d; Supplementary Table 1)11-13.
Semaphorin 3A (Sema3A), a known connectivity molecule5,6, was enriched more than 100-fold in bitter TRCs versus other cells types (Fig.1 b,c). Semaphorins are a large family of membrane-associated and secreted proteins that are widely expressed throughout the nervous system, and are often implicated in axon guidance, neural circuit assembly, and synaptic refinement13-15. Sema3A, in particular, was first identified as a secreted repulsive axon guidance-signal mediating growth cone collapse16,17, but more recently it has also been implicated in chemoattraction18-20.
To probe the specificity of the ‘handshake’ between bitter ganglion neurons and TRCs, we performed in vivo functional calcium imaging experiments (see ref. 21). In essence, since the taste-selectivity of ganglion neurons reflect the identity of the TRCs they connect to (e.g. sweet TRCs, bitter TRCs, etc.), by recording the responses of ganglion neurons to stimulation of the tongue with all 5 tastes, we can directly infer their corresponding TRC input21,22. Therefore, we targeted the calcium indicator GCaMP6 to geniculate ganglion neurons using retrograde viral transduction, exposed a small imaging window through the tympanic bulla allowing optical access to the entire ganglion in vivo, and assessed the tuning properties of taste neurons using bitter, sweet, sour, salt, and umami stimuli (see Methods for details). In wild type controls, the vast majority of geniculate ganglion neurons respond to a single taste quality (Fig. 2a-c)21. For example, over 90% of bitter responsive neurons receive input from only bitter TRCs (see Fig. 2c).
Figure 2. Removal of Sema3A from bitter TRCs increases the population of multi-tuned bitter geniculate neurons.
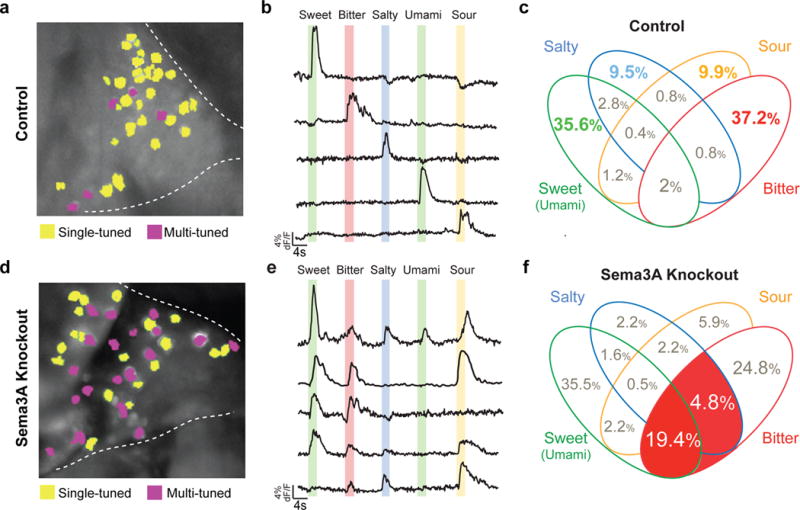
a, Image of a representative control geniculate ganglion expressing GCaMP6s highlighting neurons responding to a single taste quality (yellow) versus the small number that are multi-tuned (magenta). Dashed lines outline the geniculate ganglion with the facial nerve to bottom. b, Traces from five separate neurons (from a) illustrating the time course and amplitude changes in GCaMP6s signals (dF/F) during taste stimulation: sweet (acesulfame K, 30 mM), bitter (quinine, 5 mM), salty (NaCl, 60 mM), umami (monopotassium glutamate 50 mM + inosine monophosphate 1 mM) and sour (citric acid, 50 mM). Colored bars mark time and duration (2 s) of the stimulus. Note the specificity of the responses to single taste qualities. c, Venn diagram displaying all possible combinations of tuning properties in control mice, with numbers of neurons in each class indicated as % of total. Note that over 90% of all neurons are singly-tuned. Because there are very few umami responding neurons in the mouse geniculate ganglion (see ref. 21), we grouped sweet and umami cells in our analysis. Bitter-sour segments are merged as nearly all neurons responding to bitter and sour stimuli represent bitter TRCs that are sensitive to acid21; n=13 mice, 254 cells. d-f Corresponding panels from a conditional Sema3A knockout in bitter TRCs (T2R19-Cre; Sema3AFlox/Flox). Note the dramatic increase in bitter multi-tuned neurons (highlighted in red in panel f; n = 5 mice, 186 cells. See also Extended Data Table 1. Fisher’s exact test: P < 0.01 (19.4% vs. 2%) and P < 0.05 (4.8% vs. 0.8%).
How do bitter ganglion neurons, which do not turn over, recognize and re-connect to continuously turning over bitter taste receptor cells? To investigate the role of Sema3A in bitter TRCs, we engineered animals with a conditional deletion of Sema3A in bitter taste receptor cells (Sema3AFlox/Flox crossed to T2R19-Cre)10,23. Figure 2 shows that loss of Sema3A dramatically changed the responses of bitter neurons, such that nearly half of all bitter-responding neurons are now also activated by other tastants, including sweet, umami and salt (Fig. 2d-f; see Legend for details). These results suggest at least two possibilities: Sema3A, normally secreted by bitter TRCs, acts as an attractive signal to guide connectivity between bitter TRCs and bitter ganglion neurons. Alternatively, Sema3A acts as a repulsive signal preventing improper connections between bitter TRCs and non-bitter ganglion neurons.
We reasoned that if Sema3A functions as an attractive local signal released from bitter TRCs, we may be able to re-wire and redirect bitter neurons to another class of TRC by mis-expressing Sema3A ectopically in those cells (see Fig. 3a). Thus, we engineered a mouse line that expresses Sema3A in sweet (and umami) cells using the upstream regulatory regions of the sweet/umami T1R3 receptor subunit (T1R3::Sema3A; see Extended Data Fig. 3a). We hypothesized that bitter ganglion neurons would now be “attracted” to sweet TRCs, and consequently there should be a selective emergence of bitter-sweet ganglion neurons. Indeed, our results (Fig. 3b,c) demonstrated a 7-fold increase in the population of bitter-sweet doubly-tuned cells (from background levels in controls to over 20% in T1R3::Sema3A). Moreover, unlike the Sema3A knockout that produces multi-tuned cells across all taste qualities (e.g. bitter-salty, bitter-sweet-salty), the bitter phenotype of the mis-expressed animals is largely restricted to bitter-sweet.
Figure 3. Rewiring of bitter geniculate ganglion neurons.
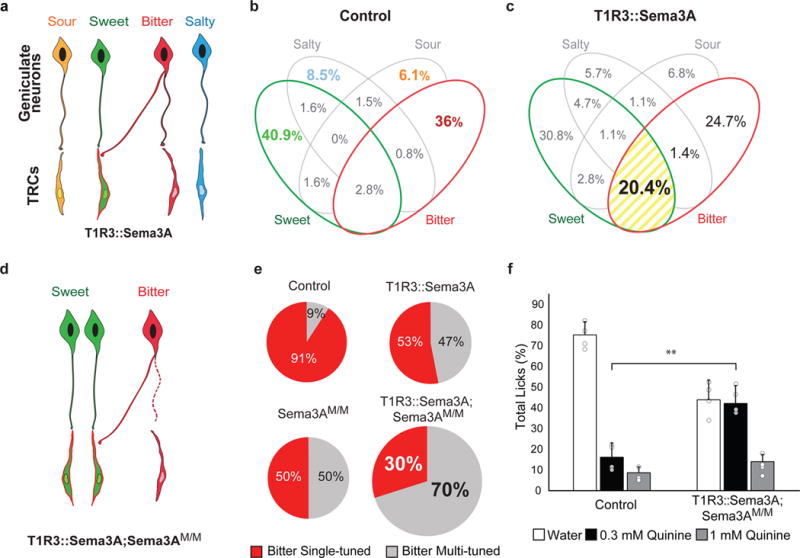
a, Directed mis-expression of Sema3A in sweet TRCs targets bitter neurons to sweet TRCs. b-c, Venn diagram displaying ganglion neuron tuning in control (n = 9 mice, 247 cells) and T1R3::Sema 3A animals (n = 6 mice, 270 cells); numbers of neurons in each class are indicated as % of total. Highlighted in yellow is the large increase of bitter/sweet multi-tuned cells (P < 0.01, Fisher’s exact test). d, Directed mis-expression of Sema3A in sweet TRCs of Sema3A mutant animals. e, Pie charts depicting the fraction of singly (red) and multi-tuned (grey) bitter responding neurons in the 4 different genetic backgrounds. Note the dramatic loss of singly tuned bitter cells in the T1R3::Sema3A;Sema3AM/M double mutant (T1R3::Sema3A;Sema3AM/M vs others: P < 0.01, Fisher’s exact test). Data for control and T1R3::Sema3A are from panels b and c, respectively. Sema3AM/M,, n= 9 mice (263 cells), T1R3::Sema3A;Sema3AM/M, n=9 mice (130 cells); see also Extended Data Table 2 and Extended Data Fig.4. f, Animals with bitter neurons re-wired to sweet TRCs exhibit a significant loss of bitter taste sensitivity. Animals were presented with water, 0.3 mM quinine and 1 mM quinine; shown are the relative fraction of licks to each stimuli in mutant and wildtype controls (n = 4; mean + s.d. ; **, P < 0.01, Student’s 2-tailed, unpaired T-test). Unlike controls, the mutant animals failed to distinguish moderate concentrations of bitter from water; see Extended Data Figure 5 for additional bitters.
The mis-expression studies described above used engineered animals that still carry wild-type copies of Sema3A. We anticipated that completely removing functional Sema3A24 from bitter cells should further decrease the remaining number of “properly wired” (singly-tuned) bitter cells in the sweet-expressing Sema3A animals (T1R3::Sema3A;Sema3AM/M; Fig. 3d). As predicted, mis-expression in the mutant background leads to nearly a halving of the remaining singly-tuned bitter cells (Fig. 3e, from ~50% in the mis-expressed to 30% in the mis-expressed lacking functional endogenous Sema3A). Of note, even in the absence of functional Sema3A in bitter TRCs, ganglion neurons can still connect to bitter cells, indicating that additional cues must guide their targeting to bitter TRCs.
Given that T1R3::Sema3A;Sema3AM/M animals have 70% of their bitter-responding neurons as multi-tuned (Fig. 3e), we examined their behavioral responses to bitter stimuli. Indeed, our results showed that sensitivity to bitter chemicals was markedly impaired, with animals exhibiting compromised aversive responses (Fig. 3f, Extended Data Fig. 5).
The results described above validate Sema3A as a key mediator of connectivity between bitter TRCs and their partner ganglion neurons. What about the wiring between sweet-TRCs and sweet ganglion neurons? Are similar rules guiding their handshake during the constant renewal of sweet TRCs? We searched for candidate molecules that may mediate the connectivity between sweet TRCs and sweet ganglion neurons. Our expression profiling studies (Fig. 1b, 4a-b) singled-out Sema7A, a membrane-bound member of the semaphorin family25,26, as highly selective for sweet cells. To investigate the role of Sema7A in guiding sweet TRC-ganglion connectivity, we engineered animals that mis-express Sema7A in bitter TRCs (Extended Data Fig. 3). We reasoned that if Sema7A functions in sweet cells by providing an instructive signal to sweet ganglion neurons (like Sema3A from bitter TRCs does to bitter ganglion neurons) then the peripheral taste system of animals mis-expressing Sema7A in bitter TRCs should now result in a re-routing of sweet ganglion connections to bitter TRCs. As predicted, our results (Fig. 4c,d) demonstrated the selective emergence of a very large number of sweet responding neurons that are also activated by bitter tastants in the engineered animals. Can these findings be extended to additional classes of TRCs? Next, we examined sour taste, and generated animals mis-expressing Sema7A in sour taste receptor cells. We anticipated that in this instance the taste system would be re-wired such that sour TRCs are now signaling to sweet ganglion neurons. Indeed, these engineered mice have a dramatic loss of singly-tuned sour TRC, with the vast majority of their sour responses in neurons that are also activated by sweet stimuli (Fig. 4e).
Figure 4. Rewiring of sweet geniculate ganglion neurons.
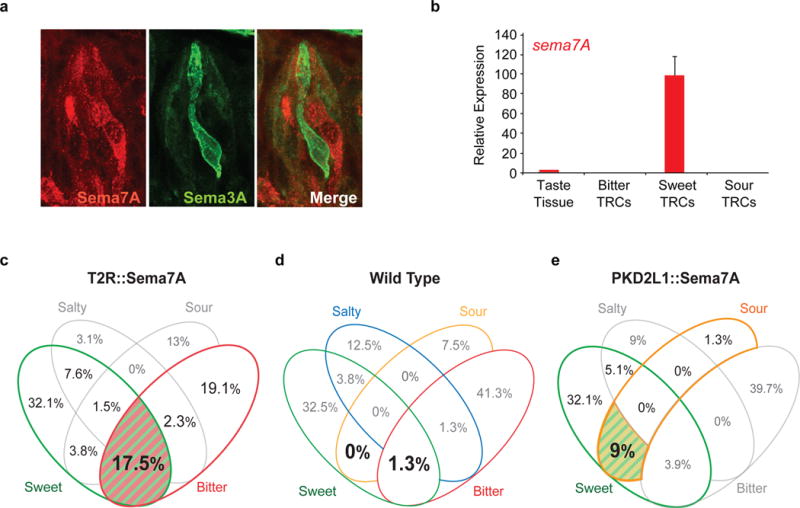
a, Confocal microscopy images of a taste bud showing expression of Sema7A (red) and Sema3A (marked by Sema3A-cre;Rosa-YFP reporter, green). b, Quantitative RT-PCR demonstrating highly selective expression of sema7A transcripts in sweet TRCs; data are presented as mean + s.e.m, n=3. c-e, Geniculate ganglion responses show that Sema7A directs sweet neuron connectivity. c, Animals expressing Sema7A in bitter cells (T2R::Sema7A; n=7 mice, 131 cells). Sweet-bitter multi-tuned cells are highlighted in color (P < 0.01, Fisher’s exact test). d, Wildtype (n=4 mice, 80 cells). e, Animals expressing Sema7A in sour cells (PKD2L1::Sema7A; n=4 mice, 78 cells). Sweet-sour doubly-tuned cells are highlighted (P < 0.01, Fisher’s exact test). See also Extended Data Table 3.
The taste system affords the unique opportunity to explore how labeled lines between primary sensory cells and neurons are wired and preserved. At the periphery, five basic classes of TRCs signal to a matching set of ganglion neurons. How do ganglion processes identify their proper TRC partners? The chemoaffinity hypothesis has been a tenet of neuronal connectivity for over 100 years27,28. Yet, despite much effort, there are limited examples in vertebrates where guidance molecules expressed by target cells direct cell to cell, rather than “regional” level connectivity29. Because taste cells are assembled into tightly packed taste buds (with a random distribution of TRCs representing each modality)30, they provide an ideal experimental platform to explore how connectivity rules may operate at a cell-to-cell level. Moreover, as TRCs are constantly renewed during the life of the animal, they require continuous re-establishment of connections between existing ganglion processes and newly born TRCs. Here, we combined single-cell functional imaging and mouse genetics to demonstrate that sweet and bitter TRCs use distinct semaphorins in a deterministic fashion to guide wiring of the peripheral taste system (likely with other connectivity molecules as part of a multi-component wiring specificity code; see also Extended Data Fig. 2). Our results showed how targeted mis-expression of even a single connectivity signal alters taste cell-neuronal communication in a predictable fashion (e.g. sweet signaling to bitter, or sour to sweet). Together, these studies reveal basic rules of TRC-neuron connectivity, substantiate the labeled line organization of the taste system, and help explain how a hard-wired sensory system maintains fidelity of signaling in the face of random turnover of receptor cells.
Materials and Methods
Animals
All procedures were carried out in accordance with the US National Institutes of Health (NIH) guidelines for the care and use of laboratory animals, and were approved by the Institutional Animal Care and Use Committee at Columbia University. Adult animals ranging from 2-12 months of age and from both genders were used in all experiments. No statistical methods were used to predetermine sample size, and investigators were not blinded to group allocation. No method of randomization was used to determine how animals were allocated to experimental groups. Transgenic mice were engineered by pronuclear injection of recombineered BAC constructs. FLAG tags were added to Sema3A and Sema7A mis-expression constructs using Gibson cloning (NEB) to detect mis-expressed proteins. T1R3::Sema3A was generated by insertion of a human Sema3A (GE Dharmacon MHS6278-211690268) into the T1R3 start codon in BAC RP23-236C12 (see Extended Data Fig. 3 for validation of the new mouse lines). Sema3A-Cre was generated by recombineering a Cre cassette at the start codon of the Sema3A gene in BAC RP23-151O24. T2R::Sema7A was generated by recombineering a human Sema7A cDNA (GE Dharmacon MHS6278-202857566) at the start codon of T2R19 gene in the BAC RP23-325J2. PKD2L1::Sema7A was engineered by insertion of the human Sema7A into the PKD2L1 start codon in BAC RP23-297K23. TRPM5-BFP was generated by insertion of p2A-BFP cassette (Evrogen) to replace the TRPM5 stop codon in BAC RP23-366M16. PKD2L1-tdTomato was generated by insertion of a tdTomato cassette at the PKD2L1 start codon in BAC RP23-297K23. Other mouse strains used were previously described: T2R-GFP (T2R32-Sapphire)31, Sema3AFlox/Flox (RIKEN RBRC01106)23, Sema3AM/M (JAX Stock#014646)24, Rosa-EYFP (JAX Stock#6148). All strains were backcrossed (for at least two generations) and maintained in a C57BL/6 background.
Taste receptor cell isolation and RNAseq
Tongues were extracted from euthanized mice expressing fluorescent reporters for specific TRCs and injected with a dispase/collagenase (Roche) enzyme cocktail. After a 10 minute incubation in 37°C, lingual epithelia were carefully peeled off from the muscle layer. Peeled lingual epithelia were placed in 0.25% Trypsin-EDTA (Invitrogen) for 15 minutes at 37°C, triturated, and sequentially passed through 70 μm and 40 μm filters (Corning) to obtain single cells. Fluorescently-labeled TRCs were isolated from dissociated cells using a fluorescence activated cell sorter (MoFlo Astrios, Beckman Coulter).
Bitter and sweet/umami TRC populations were isolated from a mouse line harboring both T2R-GFP and TRPM5-BFP transgenes (labeling sweet, umami and bitter TRCs)32. From these mice, GFP+BFP+ (bitter TRCs) or GFP−BFP+ TRCs (sweet/umami) were sorted by FACS into tubes containing cell lysis buffer. Each pool amounted to ~500 cells. Total RNA was extracted using the Arcturus PicoPure RNA Isolation kit (Thermo Fisher) according to manufacturer instructions and was immediately used for RNAseq library generation with the Ovation RNA-Seq System v2 (NuGEN). RNA-sequencing and analysis were performed by the Columbia Genome Center core facility. The RNAseq experiment was performed in three biological replicates.
Quantitative RT-PCR
Samples were from circumvallate papilla (taste tissue), lingual epithelia, T2R-GFP+TRPM5-BFP+ (bitter) TRCs, T2R-GFP−TRPM5-BFP+ (sweet/umami) TRCs, and PKD2L1-tdTomato+ (sour) TRCs. Total RNA from each sample was isolated and complementary DNA prepared using the Ovation RNA-Seq System v2 kit. Quantitative reverse transcription PCR was performed on a StepOne Plus (Applied Biosystems) cycler using the Taqman Gene Expression system (Thermo Fisher). Taqman probes were as follows: t1r3 (Mm0167446_g1), t2r5 (Mm0098502_s1), pkd2l1 (Mm00619572_m1), sema3A (Mm01230889_m1), bdnf (Mm04230607_s1), slit2 (Mm01216521_m1), dscaml1 (Mm01174253_m1), pcdhgb7 (Mm04209449_m1), tspan18 (Mm00806028_m1), nrxn3 (Mm04279482_m1), sema7A (Mm00441361_m1) and actb (Mm01205647_g1). For detection of semaphorin receptors, samples were from geniculate ganglia and fungiform papillae. qRT-PCR was performed using VeriQuest SYBR green master mix (Thermo Fisher) with the following primer pairs: plxna4 (ACCCGGATCTTCTTCAGCTT and CTCTGGGAGTTTCCGAAATG), plxnc1 (CAGTTTTCAAAGCTCCCAGC and TTGCAAACTGCAGTAAACGG), itgb1 (GGCCAAATACAGAACAAATCAA and ACACCGACCCGAGACCCT), nrp1 (AGGTGCAATCTTCCCACAGA and CCGGAACCCTACCAGAGAAT), actb (ATGGAGGGGAATACAGCCC and TTCTTTGCAGCTCCTTCGTT), p2x3 (TGATGGTGGGAATGATGTTG and TGTTTCCCCTGGCTACAACT), t1r3 (CTTTTCTCTGGGGACCACTG and AAAGGGCTTTCATTCCTGCT). Experiments were performed in three biological replicates. Data were normalized to beta-actin.
Immunostaining
Animals were euthanized and fixed by intracardiac perfusion with a 4% paraformaldehyde solution. Tongues were excised and placed in 30% sucrose solution overnight at 4°C for cryoprotection. Tissues were embedded in OCT compound and sectioned at 30 μm thickness on a cryostat. Sections were washed in PBS with 0.1% Triton X-100 (PBST), blocked with 10% donkey serum in PBST, incubated with primary antibodies overnight at 4°C, and incubated with fluorescence-tagged secondary antibodies (Jackson ImmunoResearch) for 2 hours at room temperature. Primary antibodies used were: anti-Sema7A (R&D Systems #AF1835; 1:300 dilution), anti-FLAG (Sigma #F7425; 1:1000 dilution), anti-T1R3 (Santa Cruz Biotechnology #sc-22458; 1:500 dilution), anti-Car4 (R&D Systems #AF2414; 1:500 dilution), anti-Plcβ2 (Santa Cruz Biotechnology #sc-206; 1:1000 dilution), anti-GFP (Abcam #ab13970; 1:500 dilution), anti-Nrp1 (R&D Systems #AF566; 1:200 dilution), and anti-PlxnC1 (R&D Systems #AF5375; 1:200 dilution).
Viral delivery of GCaMP sensors
Mice were anesthetized with ketamine and xylazine (100 mg/kg and 10 mg/kg, intraperitoneal), with subsequent booster doses to maintain depth of anesthesia. Body temperature was controlled using a closed-loop heating system. A small craniotomy (<1 mm diameter) centered approx. 6.5 mm dorsal to bregma and 1.25 mm from the midline was performed. AAV virus carrying AAV2.1-hSyn-GCaMP6s (Penn Vector Core) was delivered to the brain at three locations along the rostrocaudal axis: 1.25 mm/−4.0 mm (lateral coordinate relative to bregma/inferior coordinate relative to the dura), and −6.3 mm/−6.5 mm/−6.7 mm (anterior coordinates relative to bregma); approximately 200 nL was delivered per injection. After incision closure and recovery from surgery, mice were housed in their home cages for at least 1 week prior to imaging.
Calcium imaging
A metal bar was affixed to the dorsal cranium of an anaesthetized mouse (see above) with Vetbond Tissue Adhesive (3M) and dental cement as described previously21. The mouse was positioned in a supine position, and its head rigidly secured using a metal bar. A tracheotomy was performed to maintain a clear airway during tastant delivery to the oral cavity. The surgical strategy used to image the geniculate ganglion in vivo was as previously described21. Imaging data was obtained using an Evolve 512 EMCCD camera (Photometrics). All images were acquired at 5 Hz, at 10× magnification. A single field of view was analyzed for each ganglion.
Tastants were delivered (5-10 ml/min) using silicon tubing positioned approximately 8 mm inside the oral cavity, dorsal to the tongue. Tastants dissolved in water were delivered for 2 seconds each in serial order, interspersed with 13 s of water rinse. Images were acquired during epochs of continuous irrigation. The concentrations (and application order) of tastants used were: acesulfame K (AceK), 30 mM; quinine hydrochloride, 5 mM; NaCl, 60 mM; monopotassium glutamate + inosine monophosphate, 50 mM + 1 mM, respectively; citric acid, 50 mM. Additional tastants: sucrose (300 mM) and cycloheximide (100 μM).
Calcium imaging data analysis
Imaging data was analyzed using custom software implemented in Matlab (MathWorks) as described previously33. For each field of view, all image stacks were first registered for motion correction using Image Stabilizer for ImageJ21. To identify neurons, maps of peak activity (maximal pixel intensity over mean pixel intensity) median filtered, thresholded and separated by watershed segmentation to create candidate regions of interest representing active neurons, which were reviewed manually to identify ROIs for all active neurons. Fluorescence traces for each region of interest were normalized to neighborhood fluorescence intensity (defined as the average intensity within a two cell radius distance of each cell, excluding all other defined ROIs) to correct for neuropil signal33. Calcium transients were automatically detected as fluorescence excursions of >3 fold above noise (defined as median average deviation). We visually scored cells, by directly observing the aligned image data displayed as a relative fluorescence movie, as well as the putative cells’ fluorescence time series21. Note that if a ganglion neuron were completely mis-wired such that it lost its original tuning identity, it would not show up as multi-tuned, thus underrepresenting the extent of rewiring. To ensure that signals originated from a single neuron, and not from closely adjacent cells or out-of-focus fluorescence from deeper cell layers, we examined the correlation of pixels in the neighborhood of each ROI for each calcium transient, discarding from analysis any neuron contaminated by outside signals. Fisher’s exact test was used to determine statistical significance between cell populations.
Behavioral assays
Taste behavior was assayed using a short-term assay that directly measures taste preferences by counting immediate licking responses in a multi-channel gustometer (Davis MS160-Mouse gustometer; DiLog Instruments)32. Mice were water restricted for 24 hours before gustometer training. For 2-3 days, mice were acclimated to the gustometer, and trained to lick water from the gustometer spouts. After 10 minutes in the gustometer 2× per day, the mice were given 1 hour access to water in their home cage. On testing days, the mice were placed individually into the gustometer chamber, and presented with water or two different concentrations of a given bitter tastant at random (quinine hydrochloride, denatonium, or 6-n-propylthiouracil (PROP)). During each presentation, the shutter opens, and the mouse has a 60 s window to lick the spout to continue the trial, otherwise it proceeded to the next trial. After the first lick is detected, the mouse is given 10 s to lick before the shutter closes, and the next presentation starts. The number of licks, inter-lick interval, and lick latency are recorded for each presentation. The duration of the experiment was 20 minutes.
Nerve recordings
Lingual stimulation and recording procedures were carried out as described previously32; data analysis used the integrated response during the 5 s of tastant stimulation. Compounds used for nerve recordings were: acesulfameK (30 mM); quinine (0.625 - 5 mM), and NaCl (60 mM). Data were analyzed for statistical significance using an unpaired, one-tailed Student’s t-test and 95% confidence limits.
Data availability
The data that support the findings of this study are available from the corresponding author upon reasonable request. RNA-Seq data that support the findings of this study have been deposited in the NCBI Sequence Read Archive with the accession code PRJNA390545 (http://www.ncbi.nlm.nih.gov/bioproject/390545).
Extended Data
Extended Data Figure 1. Expression profiling of fluorescently labeled TRC populations identifies candidate signaling molecules enriched in bitter TRCs.
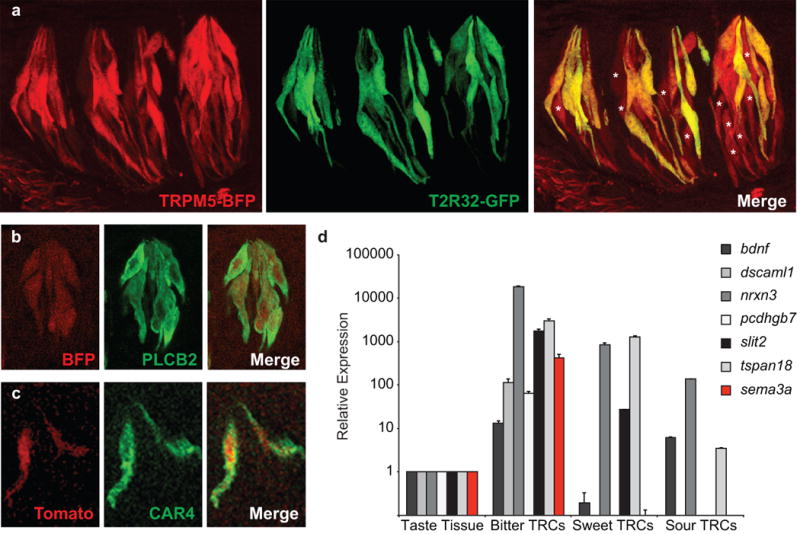
a, Confocal microscopy images of circumvallate papilla (CV) taste buds from a TRPM5-BFP (labeling sweet and bitter TRCs32, pseudo-colored red); T2R32-GFP (labeling bitter TRCs) double-labeled transgenic mouse. These are the animals used in the profiling of sweet/umami and bitter TRCs. Note the expected co-expression of bitter taste receptors and a subset of TRPM5-positive cells (right panel; TRPM5-positive but T2R-negative TRCs are indicated by stars). b, Taste bud from a TRPM5-BFP transgenic mouse showing co-expression of the BFP reporter (pseudo-colored red) and PLCβ2 (a marker of sweet, umami, and bitter TRCs32, green). c, Taste bud from a PKD2L1-TdTomato transgenic animal demonstrating expression of the TdTomato reporter (red) in sour TRCs (marked by CAR434, green). d, Quantitative RT-PCR illustrating the relative expression of several candidate connectivity molecules in bitter, sweet, and sour TRCs. Data are presented as mean + s.e.m. relative to the expression levels in the whole circumvallate papilla (referred to as taste tissue); n=3.
Extended Data Figure 2. Expression of Semaphorin receptors in geniculate ganglion neurons.
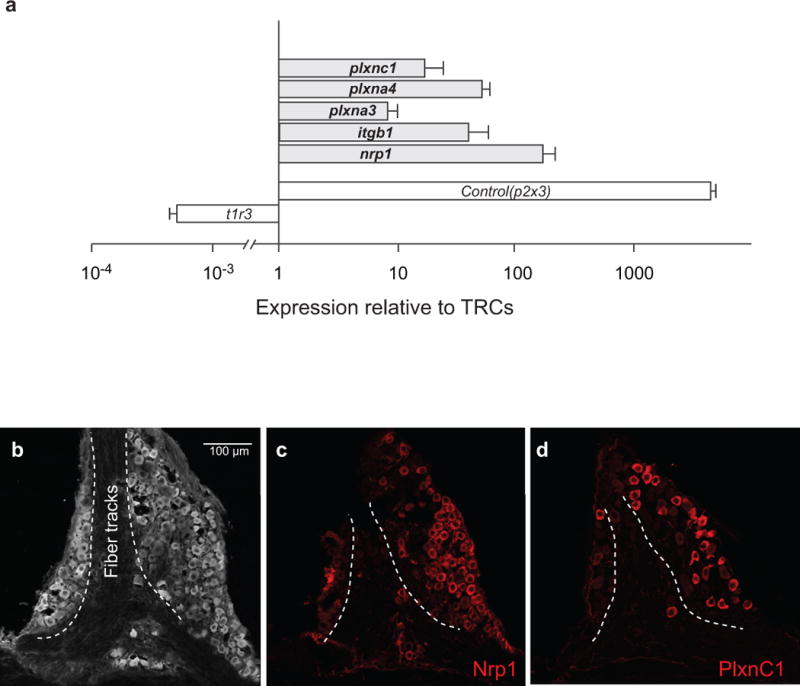
a, Quantitative RT-PCR analysis showing expression of candidate Sema3A receptors5,6 (Nrp1, PlxnA3, and PlxnA4) and Sema7A receptors5,6 (Itgb1 and PlxnC1) in the geniculate ganglia. P2x3 and T1r3 were used as controls for geniculate ganglia35 and TRC9 tissue integrity, respectively. Nrp1, Neuropilin 1; PlxnA3, Plexin A3; PlxnA4, Plexin A4; Itgb1, Integrin β1; PlxnC1, Plexin C1. Data are presented for each gene as its relative abundance in the ganglia compared with TRCs. Values are mean + s.e.m. (n = 3). b-d, Confocal microscopy images of immunostains illustrating the expression of Nrp1 (c) and PlxnC1 (d) in subsets of geniculate ganglion neurons. Panel b depicts the anatomy of the ganglion highlighting the location of fiber tracks.
Extended Data Figure 3. Targeted mis-expression of Sema3A and sema7A.
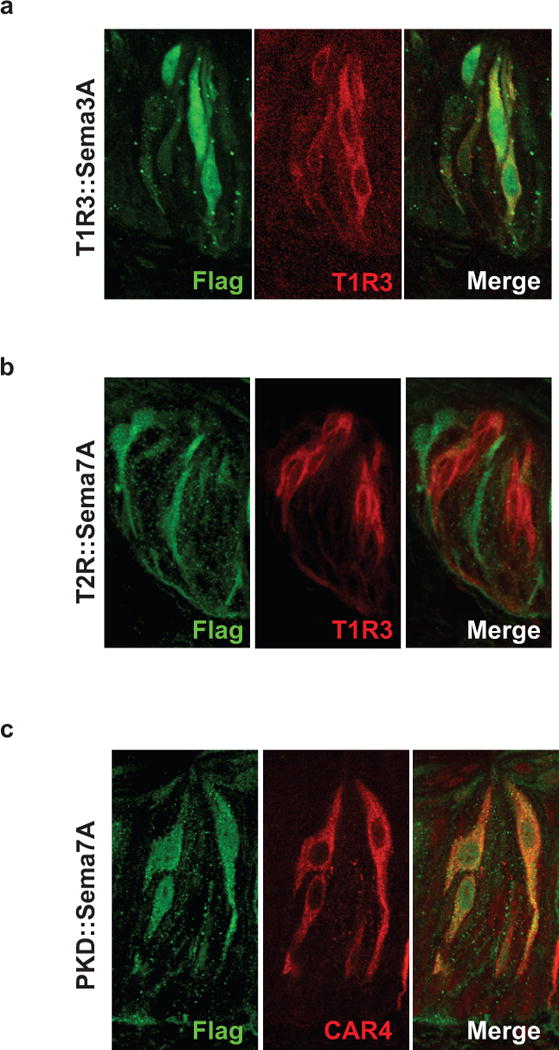
a, Confocal microscopy images of circumvallate papilla (CV) taste buds from a T1R3::Sema3A mouse demonstrating transgene expression (marked by Flag tag; green) in T1R3-expressing TRCs (red). b, The Sema7A transgene of T2R::Sema7A animals (green) is expressed in a subset of TRCs not overlapping with T1R3 (red). c, Sema 7A (green) in PKD2L1::Sema7A animals is expressed in sour TRCs (marked by CAR4, red).
Extended Data Figure 4. Responses of ganglion neurons in T1R3::Sema3A mice.
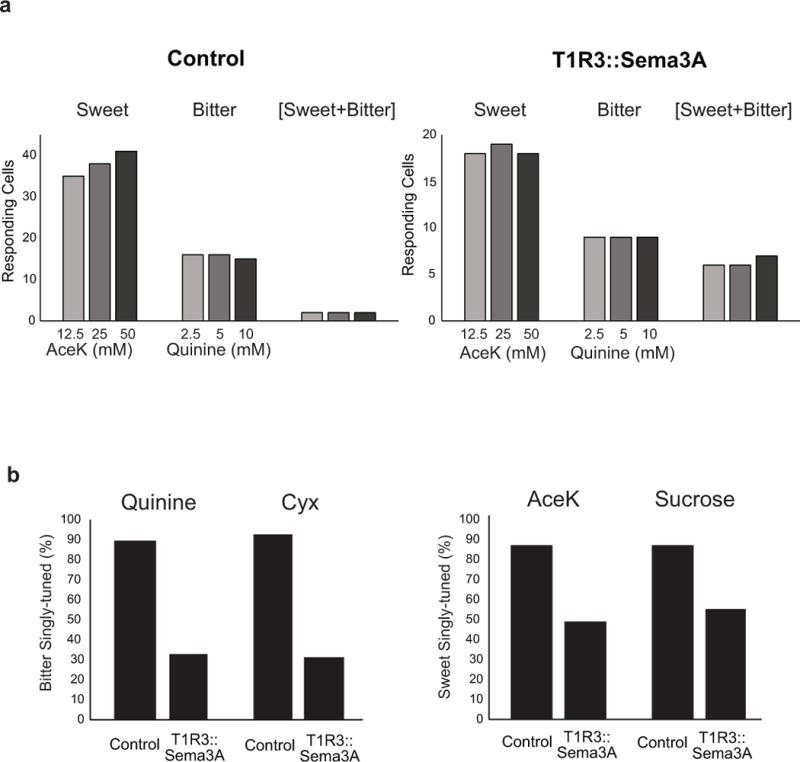
a, Dose responses to sweet and bitter in control and T1R3::Sema3A mice. Shown are the number of cells responding at each stimulus concentration, classified by their response profile (i.e. sweet-responding, bitter-responding, or sweet-bitter responding). Note that the tuning profiles are maintained at all three sweet and bitter concentrations, including extremely high concentrations of bitter10 and sweet9. Control, n = 58 cells; T1R3::Sema3A, n = 34 cells. b, Responses are similar for different tastants within a modality. Shown are tuning properties of bitter and sweet responding neurons in the T1R3:: Sema3A animals to two structurally different bitter and sweet tasting chemicals. Quinine (5 mM), cycloheximide (100 μM), AceK (30 mM) and sucrose (300 mM). Control: n = 178 bitter-responding cells, n = 227 sweet-responding cells (7 mice). T1R3::Sema3A, n = 130 bitter-responding cells, n = 165 sweet-responding cells (5 mice).
Extended Data Figure 5. Aversion to bitter tastants is impaired in T1R3::Sema3A;Sema3AM/M mice.
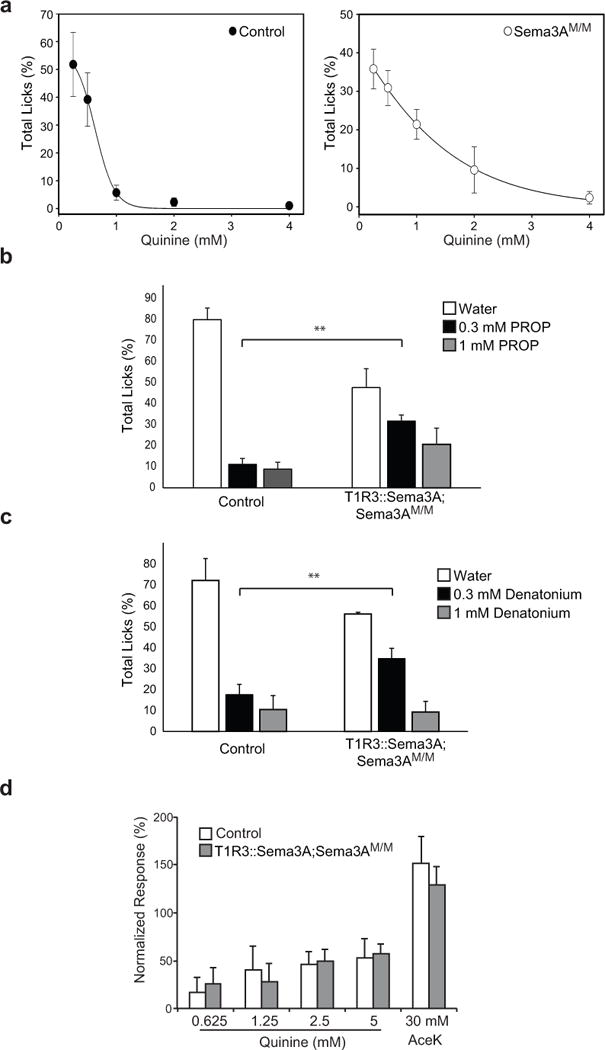
a, Dose response to the bitter quinine in control and Sema3AM/M mutant mice. Animals were tested using a brief-access lick assay as previously described10. Shown are the relative fraction of licks to each concentration of quinine (0.25 mM, 0.5 mM, 1 mM, 2 mM, 4mM). Control n = 4, Sema3AM/M n = 5, mean +/− s.d. b-c, Targeting bitter neurons to sweet TRCs results in a significant loss of bitter taste sensitivity (see also Fig. 3f). b, The graphs show the relative fraction of licks to water and to 2 different concentrations of PROP in control and T1R3::Sema3A;Sema3AM/M animals. c, The graphs show the relative fraction of licks to water and to 2 different concentrations of denatonium in control and T1R3::Sema3A;Sema3AM/M animals. n = 3, mean + s.d., ** P < 0.01, Student’s 2-tailed, unpaired T-test. d, Chorda tympani whole nerve recording32 in control and T1R3::Sema3A;Sema3AM/M mutant mice. Responses were normalized to 60 mM NaCl (n = 3, mean + s.d.). Note that whole nerve responses to bitter and sweet are unchanged, likely as nerve recording measure bulk neural activity, further highlighting the importance of recording single-neuron activity; GCaMP-based imaging of ganglion activity is significantly more informative than whole-nerve, or even single-fiber physiological recordings, as it allows simultaneous sampling of large numbers of neurons with single-cell selectivity.
Extended Data Table 1.
The table shows the distribution of geniculate ganglion neurons according to their responses to each of the five basic taste qualities. All responsive neurons are included in the table. Shown are numbers of cells responding to the various stimuli in Sema3A mutant animals, and their littermate controls; all the data are included in Fig. 2. Note that since bitter-sour tuned neurons reflect the activation of T2Rs (see ref. 21), they were grouped in the table and in Fig. 2.
| Response Profile | Control (13 mice) |
Sema3AKO (5 mice) |
|---|---|---|
| Sweet | 84 | 63 |
| Bitter | 94 | 48 |
| Sour | 25 | 11 |
| Umami | 2 | 0 |
| Salty | 24 | 4 |
| Bitter-Sweet | 2 | 15 |
| Bitter-Umami | 1 | 3 |
| Bitter-Salty | 2 | 9 |
| Bitter-Sweet-Salty | 2 | 5 |
| Bmer-Sweet-Umami | 0 | 2 |
| Bitter-Salty-Umami | 0 | 5 |
| Bitter-Sweet-Salty-Umami | 0 | 6 |
| Sweet-Sour | 3 | 4 |
| Sweet-Umami | 5 | 3 |
| Sweet-Salty | 7 | 3 |
| Sweet-Salty-Sour | 1 | 1 |
| Satty-Sour | 2 | 4 |
| Total cells | 254 | 186 |
Extended Data Table 2.
The table shows the distribution of geniculate ganglion neurons according to their responses to each of the five basic taste qualities in T1R3::Sema3A and control animals; shown are numbers of cells responding to the various stimuli. All the data are included in Fig. 3. Note that as bitter-sour neurons reflect responses of T2Rs (see ref. 21) they were grouped.
| Response profile | Control (9 mice) |
T1R3::Sema3A (6 mice) |
|---|---|---|
| Sweet | 94 | 80 |
| Bitter | 89 | 69 |
| Sour | 15 | 19 |
| Umami | 2 | 2 |
| Salty | 21 | 17 |
| Bitter-Sweet | 4 | 43 |
| Bitter-Umami | 0 | 0 |
| Bitter-Salty | 2 | 4 |
| Bitter-Sweet-Salty | 1 | 10 |
| Bitter-Sweet-Umami | 2 | 3 |
| Bitter-Salty-Umami | 0 | 0 |
| Bitter-Sweet-Salty-Umami | 0 | 1 |
| Sweet-Sour | 2 | 8 |
| Sweet-Umami | 7 | 4 |
| Sweet-Salty | 3 | 12 |
| Sweet-Salty-Sour | 0 | 2 |
| Sweet-Salty-Umami | 0 | 1 |
| Sweet-Salty-Umami-Sour | 0 | 1 |
| Salty-Sour | 4 | 3 |
| Salty-Umami | 1 | 0 |
| Salty-Umami-Sour | 0 | 0 |
| Total cells | 247 | 279 |
Extended Data Table 3.
The table shows the distribution of geniculate ganglion neurons according to their responses to each of the five basic taste qualities in T2R::Sema7A, wildtype controls, and PKD2l1::Sema7A transgenic animals. Because of differences in total numbers of cells between the genotypes, the data is presented as percent (%) of cells responding to the various stimuli. All the data are included in Fig. 4. Note that bitter-sour neurons reflect the activation of T2Rs (see ref. 21), and were grouped in Fig. 4.
| Response profile | T2R::Sema7A (7 mice) |
Wildtype (4 mice) |
PKD2L1::Sema7A (4 mice) |
|---|---|---|---|
| Sweet | 275 | 31.3 | 308 |
| Bitter | 19.1 | 41.3 | 39.7 |
| Sour | 13 0 | 7.5 | 1.3 |
| Umami | 0 | 1.3 | 0 |
| Salty | 3.1 | 125 | 9 |
| Sweet-Bitter | 13 0 | 0 | 2.6 |
| Sweet-Sour | 3.8 | 0 | 9 |
| Bitter-Umami | 0 | 1.3 | 0 |
| Bitter-Salty | 2.3 | 1.3 | 0 |
| Bitter-Sweet-Salty | 2.3 | 0 | 0 |
| Bitter-Sweet-Umami | 0.8 | 0 | 0 |
| Bitter-Salty-Umami | 0.8 | 0 | 0 |
| Bitter-Sweet-Salty-Umami | 0.8 | 0 | 1.3 |
| Sweet-Umami | 4.6 | 0 | 1.3 |
| Sweet-Salty | 7.6 | 3.8 | 5.1 |
| Sweet-Salty-Sour | 1.5 | 0 | 0 |
| Total cells | 131 | 80 | 78 |
Supplementary Material
Acknowledgments
We thank T. Yagi for providing the floxed Sema3A mice, R. Barretto and D. Yarmolinsky for help with in vivo imaging and analysis, and Z. Wu, I. Schieren, and S. O’Keeffe for advice and expert technical support. We also thank N. Balaskas and the members of the Zuker lab for helpful comments and suggestions. Research reported in this publication was supported by the National Institute On Drug Abuse of the National Institutes of Health under Award Number R01DA035025 (C.S.Z) and in part by the Intramural Research Program of the NIH, NIDCR (N.J.P.R.). L.J.M. was an HHMI Fellow of the Jane Coffin Childs Memorial Fund. C.S.Z. is an investigator of the Howard Hughes Medical Institute and a Senior Fellow at Janelia Farm Research Campus.
Footnotes
Supplementary Information is linked to the online version of the paper at www.nature.com/nature.
Author Contributions
H.L. and L.J.M. designed the study, carried out the experiments, analyzed data and wrote the paper, C.A.P. performed experiments, C.S.Z. and N.J.P.R. designed the study, analyzed data and wrote the paper.
The authors declare no competing financial interests.
References
- 1.Lindemann B. Receptors and transduction in taste. Nature. 2001;413:219–225. doi: 10.1038/35093032. [DOI] [PubMed] [Google Scholar]
- 2.Yarmolinsky DA, Zuker CS, Ryba NJP. Common sense about taste: from mammals to insects. Cell. 2009;139:234–244. doi: 10.1016/j.cell.2009.10.001. [DOI] [PMC free article] [PubMed] [Google Scholar]
- 3.Barlow LA, Klein OD. Developing and regenerating a sense of taste. Curr Top Dev Biol. 2015;111:401–419. doi: 10.1016/bs.ctdb.2014.11.012. [DOI] [PMC free article] [PubMed] [Google Scholar]
- 4.Zipursky SL, Sanes JR. Chemoaffinity revisited: dscams, protocadherins, and neural circuit assembly. Cell. 2010;143:343–353. doi: 10.1016/j.cell.2010.10.009. [DOI] [PubMed] [Google Scholar]
- 5.Yoshida Y. Semaphorin signaling in vertebrate neural circuit assembly. Front Mol Neurosci. 2012;5:71. doi: 10.3389/fnmol.2012.00071. [DOI] [PMC free article] [PubMed] [Google Scholar]
- 6.Pasterkamp RJ. Getting neural circuits into shape with semaphorins. Nature Rev Neurosci. 2012;13:605–618. doi: 10.1038/nrn3302. [DOI] [PubMed] [Google Scholar]
- 7.Wang F, Nemes A, Mendelsohn M, Axel R. Odorant receptors govern the formation of a precise topographic map. Cell. 1998;93:47–60. doi: 10.1016/s0092-8674(00)81145-9. [DOI] [PubMed] [Google Scholar]
- 8.Komiyama T, Luo L. Development of wiring specificity in the olfactory system. Curr Opin Neurobiol. 2006;16:67–73. doi: 10.1016/j.conb.2005.12.002. [DOI] [PubMed] [Google Scholar]
- 9.Zhao GQ, et al. The receptors for mammalian sweet and umami taste. Cell. 2003;115:255–266. doi: 10.1016/s0092-8674(03)00844-4. [DOI] [PubMed] [Google Scholar]
- 10.Mueller KL, et al. The receptors and coding logic for bitter taste. Nature. 2005;434:225–229. doi: 10.1038/nature03352. [DOI] [PubMed] [Google Scholar]
- 11.Hayashi S, Takeichi M. Emerging roles of protocadherins: from self-avoidance to enhancement of motility. J Cell Sci. 2015;128:1455–1464. doi: 10.1242/jcs.166306. [DOI] [PubMed] [Google Scholar]
- 12.Zipursky SL, Grueber WB. The molecular basis of self-avoidance. Annu Rev Neurosci. 2013;36:547–568. doi: 10.1146/annurev-neuro-062111-150414. [DOI] [PubMed] [Google Scholar]
- 13.Koropouli E, Kolodkin AL. Semaphorins and the dynamic regulation of synapse assembly, refinement, and function. Curr Opin Neurobiol. 2014;27:1–7. doi: 10.1016/j.conb.2014.02.005. [DOI] [PMC free article] [PubMed] [Google Scholar]
- 14.Coate TM, Spita NA, Zhang KD, Isgrig KT, Kelley MW. Neuropilin-2/Semaphorin-3F-mediated repulsion promotes inner hair cell innervation by spiral ganglion neurons. Elife. 2015;4 doi: 10.7554/eLife.07830. [DOI] [PMC free article] [PubMed] [Google Scholar]
- 15.Tran TS, et al. Secreted semaphorins control spine distribution and morphogenesis in the postnatal CNS. Nature. 2009;462:1065–1069. doi: 10.1038/nature08628. [DOI] [PMC free article] [PubMed] [Google Scholar]
- 16.Luo Y, Raible D, Raper JA. Collapsin: a protein in brain that induces the collapse and paralysis of neuronal growth cones. Cell. 1993;75:217–227. doi: 10.1016/0092-8674(93)80064-l. [DOI] [PubMed] [Google Scholar]
- 17.Messersmith EK, et al. Semaphorin III can function as a selective chemorepellent to pattern sensory projections in the spinal cord. Neuron. 1995;14:949–959. doi: 10.1016/0896-6273(95)90333-x. [DOI] [PubMed] [Google Scholar]
- 18.Song H, et al. Conversion of neuronal growth cone responses from repulsion to attraction by cyclic nucleotides. Science. 1998;281:1515–1518. doi: 10.1126/science.281.5382.1515. [DOI] [PubMed] [Google Scholar]
- 19.Polleux F, Morrow T, Ghosh A. Semaphorin 3A is a chemoattractant for cortical apical dendrites. Nature. 2000;404:567–573. doi: 10.1038/35007001. [DOI] [PubMed] [Google Scholar]
- 20.Telley L, et al. Dual function of NRP1 in axon guidance and subcellular target recognition in cerebellum. Neuron. 2016;91:1276–1291. doi: 10.1016/j.neuron.2016.08.015. [DOI] [PubMed] [Google Scholar]
- 21.Barretto RP, et al. The neural representation of taste quality at the periphery. Nature. 2015;517:373–376. doi: 10.1038/nature13873. [DOI] [PMC free article] [PubMed] [Google Scholar]
- 22.Wu A, Dvoryanchikov G, Pereira E, Chaudhari N, Roper SD. Breadth of tuning in taste afferent neurons varies with stimulus strength. Nat Commun. 2015;6:8171. doi: 10.1038/ncomms9171. [DOI] [PMC free article] [PubMed] [Google Scholar]
- 23.Taniguchi M, et al. Disruption of semaphorin III/D gene causes severe abnormality in peripheral nerve projection. Neuron. 1997;19:519–530. doi: 10.1016/s0896-6273(00)80368-2. [DOI] [PubMed] [Google Scholar]
- 24.Merte J, et al. A forward genetic screen in mice identifies Sema3A(K108N), which binds to neuropilin-1 but cannot signal. J Neurosci. 2010;30:5767–5775. doi: 10.1523/JNEUROSCI.5061-09.2010. [DOI] [PMC free article] [PubMed] [Google Scholar]
- 25.Carcea I, et al. Maturation of cortical circuits requires Semaphorin 7A. Proc Natl Acad Sci USA. 2014;111:13978–13983. doi: 10.1073/pnas.1408680111. [DOI] [PMC free article] [PubMed] [Google Scholar]
- 26.Pasterkamp RJ, Peschon JJ, Spriggs MK, Kolodkin AL. Semaphorin 7A promotes axon outgrowth through integrins and MAPKs. Nature. 2003;424:398–405. doi: 10.1038/nature01790. [DOI] [PubMed] [Google Scholar]
- 27.Langley JN. Note on Regeneration of Prae-Ganglionic Fibres of the Sympathetic. J Physiol. 1895;18:280–284. doi: 10.1113/jphysiol.1895.sp000566. [DOI] [PMC free article] [PubMed] [Google Scholar]
- 28.Sperry RW. Chemoaffinity in the Orderly Growth of Nerve Fiber Patterns and Connections. Proc Natl Acad Sci USA. 1963;50:703–710. doi: 10.1073/pnas.50.4.703. [DOI] [PMC free article] [PubMed] [Google Scholar]
- 29.Sanes JR, Yamagata M. Many paths to synaptic specificity. Annu Rev Cell Dev Biol. 2009;25:161–195. doi: 10.1146/annurev.cellbio.24.110707.175402. [DOI] [PubMed] [Google Scholar]
- 30.Zaidi FN, Whitehead MC. Discrete innervation of murine taste buds by peripheral taste neurons. J Neurosci. 2006;26:8243–8253. doi: 10.1523/JNEUROSCI.5142-05.2006. [DOI] [PMC free article] [PubMed] [Google Scholar]
References for Methods and Extended Data
- 31.Oka Y, Butnaru M, von Buchholtz L, Ryba NJP, Zuker CS. High salt recruits aversive taste pathways. Nature. 2013;494:472–475. doi: 10.1038/nature11905. [DOI] [PMC free article] [PubMed] [Google Scholar]
- 32.Zhang Y, et al. Coding of sweet, bitter, and umami tastes: different receptor cells sharing similar signaling pathways. Cell. 2003;112:293–301. doi: 10.1016/s0092-8674(03)00071-0. [DOI] [PubMed] [Google Scholar]
- 33.Yarmolinsky DA, et al. Coding and plasticity in the mammalian thermosensory system. Neuron. 2016;92:1079–1092. doi: 10.1016/j.neuron.2016.10.021. [DOI] [PMC free article] [PubMed] [Google Scholar]
- 34.Chandrashekar J, et al. The taste of carbonation. Science. 2009;326:443–445. doi: 10.1126/science.1174601. [DOI] [PMC free article] [PubMed] [Google Scholar]
- 35.Vandenbeuch A, et al. Postsynaptic P2X3-containing receptors in gustatory nerve fibres mediate responses to all taste qualities in mice. J Physiol. 2015;593:1113–1125. doi: 10.1113/jphysiol.2014.281014. [DOI] [PMC free article] [PubMed] [Google Scholar]
Associated Data
This section collects any data citations, data availability statements, or supplementary materials included in this article.
Supplementary Materials
Data Availability Statement
The data that support the findings of this study are available from the corresponding author upon reasonable request. RNA-Seq data that support the findings of this study have been deposited in the NCBI Sequence Read Archive with the accession code PRJNA390545 (http://www.ncbi.nlm.nih.gov/bioproject/390545).