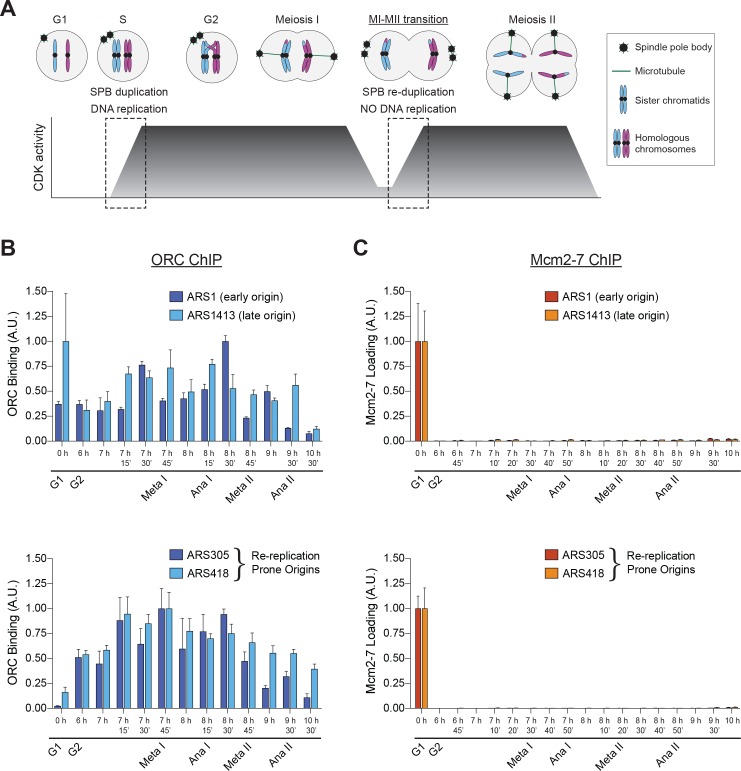
Figure 1. Mcm2–7 loading onto replication origins is inhibited during the MI–MII transition.
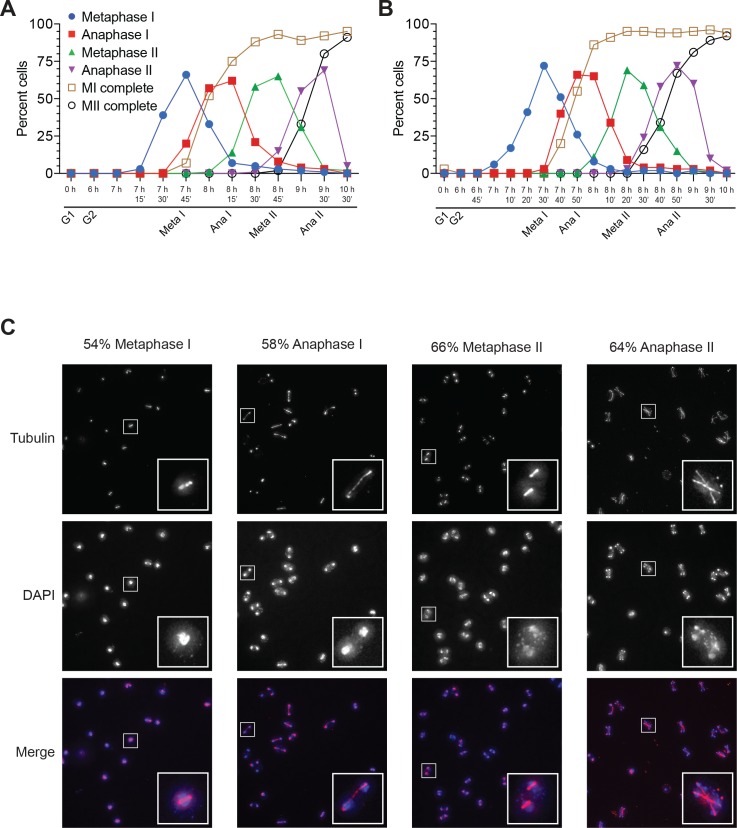
(A) The DNA replication program and chromosome segregation program are uncoupled during the MI–MII transition. Relative CDK activity at various stages of the meiotic cell cycle are shown (Carlile and Amon, 2008). The dashed boxes highlight the oscillations of low-to-high CDK activity during meiosis, and show the discrepancy between CDK-regulation of SPB duplication and DNA replication. See text for details. (B) ORC is bound to origins of replication throughout the meiotic divisions. The strain yDP71 was put through meiosis. ChIP–qPCR was used to detect ORC binding at the early–firing origin ARS1 (top graph, dark blue), the late–firing origin ARS1413 (top graph, light blue), and at the re–replication prone origins ARS305 (bottom graph, dark blue) and ARS418 (bottom graph, light blue). The time after transfer into sporulation medium and the associated meiotic stages are indicated below each lane. For cell–cycle stage quantification for this experiment, see Figure 1—figure supplement 1A. The peak % of input DNA immunoprecipitated (set to arbitrary unit (A.U.) =1.0) was 9.1% for ARS1, 2.2% for ARS1413, 46.7% for ARS305, and 10.9% for ARS418. (C) Mcm2–7 is bound to origins of replication in G1 phase but does not reassociate with origins during or between the meiotic divisions. The strain yDP71 was put through meiosis. ChIP–qPCR was used to detect Mcm2–7 binding at the early–firing origin ARS1 (top graph, red), the late–firing origin ARS1413 (top graph, orange), and at the re–replication prone origins ARS305 (bottom graph, red) and ARS418 (bottom graph, orange). The time after transfer into sporulation medium and the associated meiotic stages are indicated below each lane. For cell–cycle stage quantification for this experiment, see Figure 1—figure supplement 1B. The peak % of input DNA immunoprecipitated (set to A.U. = 1.0) was 7.4% for ARS1, 5.0% for ARS1413, 35% for ARS305, and 19.5% for ARS418.


