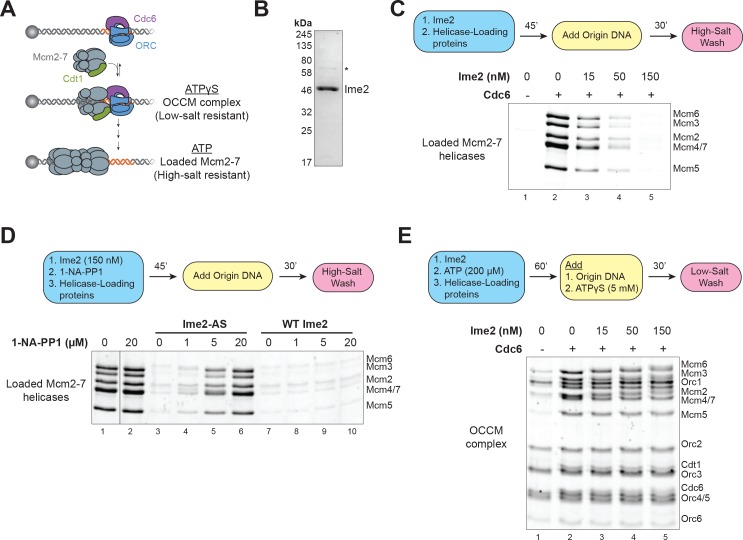
Figure 3. Ime2 is sufficient to inhibit helicase loading in vitro.
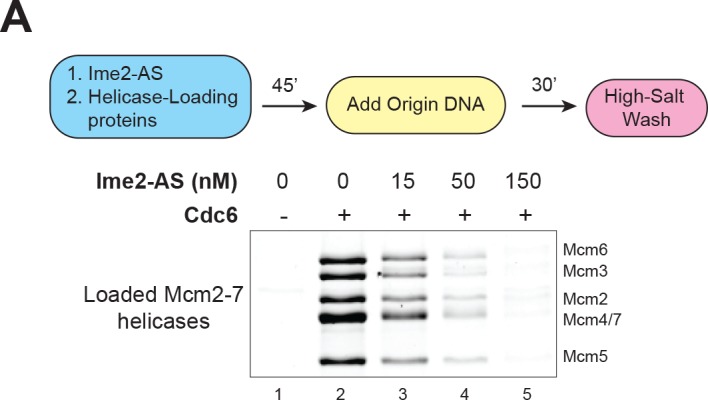
(A) Diagram of helicase–loading and OCCM–complex–formation assays. Origin–containing DNA (red) is bound to a magnetic bead. Origin bound ORC–Cdc6 complexes recruit Cdt1–Mcm2–7 heptamers to form the OCCM complex. In ATPγS, the reaction stops at this point, and the whole complex is stable in low–salt washes. In ATP, helicase loading proceeds to completion resulting in Mcm2–7 complexes encircling the DNA that are stable in high–salt washes. (B) Purification of Ime2stable–3XFlag. Asterisk (*) marks a slight contaminant. (C) Pre–incubation of Ime2 with the helicase–loading proteins inhibits Mcm2–7 loading onto replication origins in vitro. Top: Flowchart of experiment. Bottom: Helicase–loading assay at the indicated Ime2 concentration. Reaction lacking Cdc6 (lane 1) shows that Mcm2–7 complex DNA association depends on the helicase–loading reaction. (D) Ime2 inhibition of Mcm2–7 loading depends on its kinase activity. Top: Flowchart of experiment. Bottom: Helicase–loading assay. Purified Ime2–AS (150 nM) can inhibit Mcm2–7 loading (lane 3), and this inhibition can be prevented by increasing 1–NA–PP1 concentration (lanes 3–6). Wild–type Ime2 can inhibit Mcm2–7 loading regardless of 1–NA–PP1 concentration (lanes 7–10). (E) Ime2 cannot inhibit Mcm2–7-Cdt1 recruitment to ORC-Cdc6 in ATPγS. Top: Flowchart of experiment. Bottom: OCCM–complex–formation assay at the indicated Ime2 concentration (lanes 2–5). Mcm2–7-Cdt1 recruitment depends on Cdc6 (lane 1).
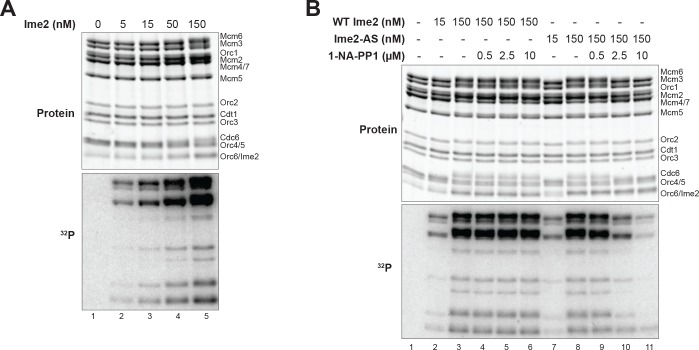
Figure 3—figure supplement 1. Ime2-AS inhibits helicase loading.


