

Abstract
Background:
The aim of this study is to compare microRNA expression patterns in different stages of colorectal cancer (CRC) and to discuss the significance of the application of microRNAs in the clinical treatment of CRC.
Methods:
The study used gene chip technology to analyze genetic sequences in CRC tissues and surrounding normal tissues at different cancer stages. The bioinformatics profiles of the target genes of the different microRNAs were analyzed to clarify the target gene-related pathways and their functions in the disease.
Results:
A total of 368 target genes with differential expression, including 275 upregulated and 93 downregulated genes, were screened from CRC patients in different stages of the disease. These microRNAs participated widely in the occurrence and development processes of CRC. The microRNA expression profiles obviously differed in tissues at different CRC stages.
Conclusion:
microRNA regulation of CRC samples can be used as a tool to control the occurrence and development of tumor cells.
Keywords: colorectal cancer, microRNA, target genes, tumor
1. Introduction
Colorectal cancer (CRC) is one of the most common malignant tumors of the digestive system, and the morbidity and mortality of the disease are increasing worldwide.[1] Due to the extreme difficulty involved in the diagnosis of CRC in its early stages and the shortage of simple and noninvasive detection tools, CRC is diagnosed in its advanced stages for most patients. Thus, the goal of our study is to develop a detection method with high sensitivity and specificity for the early diagnosis of CRC. MicroRNAs are single stranded, short (usually 18–22 nt), evolutionarily conserved, endogenous, and noncoding RNA molecules.[2] At present, more than 2500 microRNAs have been found in the human genome. These microRNAs are involved in gene expression regulation for approximately one-third of the human genome; additionally, microRNAs participate in the cell growth, proliferation, differentiation and apoptosis processes[3] and affect insulin secretion and various skeletal muscle-, brain- and heart-related processes.[3,4] MicroRNAs can serve as noninvasive tumor markers for the early diagnosis and prognostic evaluation of CRC.[5] Since microRNAs had the potential for use as regulators of the biological activities described above, gene chip technology was used to analyze colorectal cancer (C) and cancer-surrounding tissues (CS) from patients in 9 different stages. The microRNA expression profiles were obtained, and the identified microRNAs from both groups were screened to ultimately predict their target genes via bioinformatics analysis. KOBAS (KEGG Orthology-Based Annotation System) was employed to evaluate the differentially expressed microRNAs, analyze the target gene-related pathways and their functions in the disease, identify the significantly enriched GO (gene ontology) terms, and analyze the metabolism and signaling pathways. The results provide an innovative method for the early diagnosis and prognostic evaluation of CRC.
2. Materials and methods
2.1. Patients and tissue materials
A total of 35 cases of colorectal cancer patients from the Department of Anorectal Surgery of Gansu Provincial Hospital were collected from April to June in 2016. Nine patients were selected. Both cancer tissues and cancer-surrounding tissues were collected. The normal surrounding tissues were located 5 cm from the edge of the patients’ cancer tissues, and each piece weighed approximately 300 mg. First, the specimens were placed in prepared frozen storage tubes and immediately immersed in a liquid nitrogen tank. For long-term preservation, the samples were stored at −80°C. The patients approved the use of the samples for this experiment. A microarray was used to detect the microRNA expression profiles of CRC. Five patients were male, and the other patients were female. There were 5 cases in the primary stage of the disease (3 males and 2 females) and 4 cases in the late cancer stages (2 males and 2 females). All of the patients were diagnosed and staged based on the references.[6] The criteria for patient selection were as follows: the postoperative pathological diagnosis was clear adenocarcinoma; the preoperative imaging examination revealed no distant metastasis or other multiple cancers; the postoperative pathological stage of the tumor (TNM) staging was I, IIa, IIb and III, including I, IIa, and IIb for the primary stages and III for the advanced stages; the patients had no serious diseases of the heart, liver, brain, lung, or kidney or other diseases; and no patients received radiotherapy, chemotherapy or molecular targeted therapy prior to surgery. All patients were approved by the hospital's ethics committee.
2.2. Methods
Total RNA extraction and quality inspection of all samples were performed by CapitalBio Technology Corporation. The samples were analyzed by the Affymetrix microarray company for quality inspection.
2.2.1. Comparison of the similarities between samples from different stages and gene chip detection
Gene chip detection of the CRC samples was performed by the CapitalBio Technology Corporation. Box-whisker plots were used to analyze and compare the normalized expression values between different stages, and the AGCCC software (Affymetrix Gene Chip Command Console Software) was used to transform each sample's fluorescence by scanning images from this experiment. The RMA algorithm was used to preprocess the data,[7] and a correlation analysis of the preprocessed data was performed (Fig. 1A) to evaluate the similarity between the samples and to determine whether samples from different stages were grouped as expected.
Figure 1.
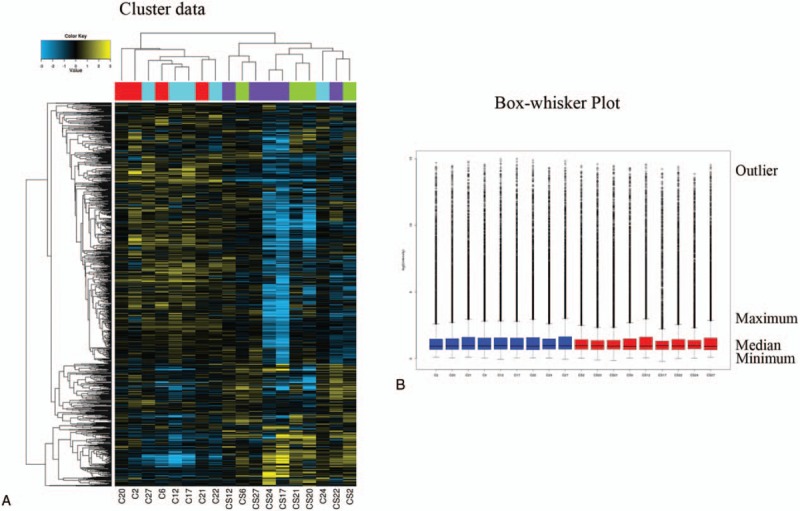
(A) Cluster data for all samples. In the diagram, each column represents a sample, and each row represents the degree of miRNA expression. (B) Box-whisker plots for all samples. In the image, the blue represents the cancer tissues, whereas red represents the cancer-surrounding tissues. C = cancer tissues, CS = cancer-surrounding tissues.
2.2.2. Detection of differentially expressed miRNAs in different disease stages
An Affymetrix miRNA 4.0 Array was used to detect the microRNA expression profiles of the samples in different stages and to characterize the up- and downregulated target genes. Then, the Affymetrix Expression Console and Affymetrix Transcriptome Analysis Console (TAC) were used to analyze the differentially expressed genes. A minimum of 3 experiments was performed. The SAM (significance analysis of microarray) R package was used to analyze the expression profiles of the differentially expressed genes. The screening criteria for the differentially expressed genes were as follows: a Q-value no higher than 5% and a fold change larger than 2 or less than 0.5.
2.2.3. KOBAS (KEGG Orthology-Based Annotation System)
KOBAS was used to predict the target gene-related pathways and their functions in the disease process, to identify the significantly enriched GO terms and pathways, and to analyze the metabolic and signaling pathways of these target genes.
3. Results
3.1. Quality inspection of all samples at different stages
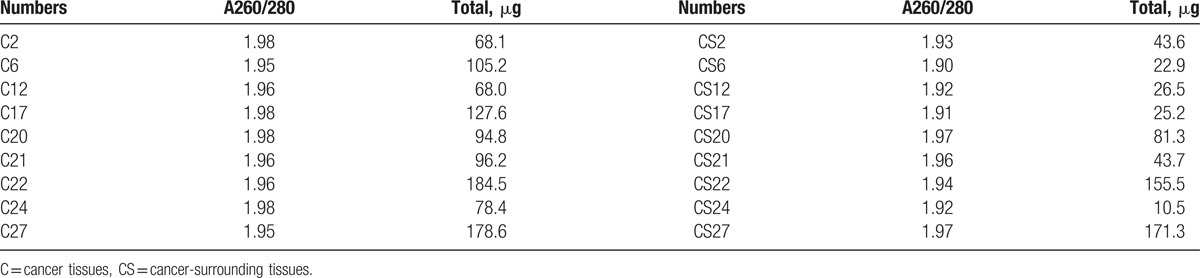
The RNA purity was evaluated in all samples as follows: the A260/280 was at least 1.70; the amount of total RNA larger than or equal to 1 mg; and all samples were in accordance with the requirements for miRNA expression profiling (Table 1).
Table 1.
The results of quality inspection for all samples.
3.2. Similarity comparisons between samples at different stages
The box-whisker plot (Fig. 1B) shows that the total gene expression levels in the different stages and different samples were essentially the same after normalization and that all of the samples had good consistency. According to the correlation of the expression patterns of the samples, a sample number more than 3 indicated that the samples would be clustered (Fig. 1A). Based on the top of the tree diagram and the expected color block, the actual clustering behaviors of the cancer tissues and cancer-surrounding tissues were better in all stages. The sample differences were small and were in accordance with the expected grouping.
3.3. Detection of differentially expressed genes in different stages and regulation of target genes by microRNAs
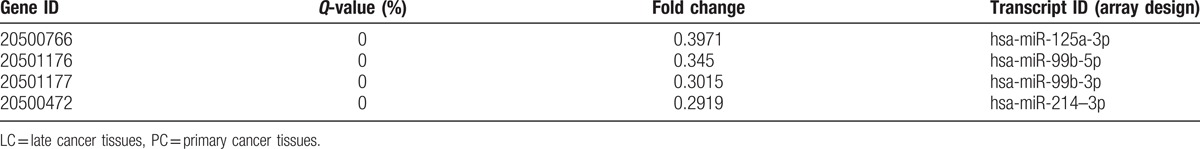
A total of 368 microRNAs with different expression profiles were screened out from the CRC samples at different stages. First, upon comparing the primary cancer-surrounding tissues (PCS) with the late cancer-surrounding tissues (LCS) (Fig. 2A), neither upregulated nor downregulated miRNAs were identified. Second, upon comparing the cancer tissues (C) with the cancer-surrounding tissues (CS) (Fig. 2B), 275 upregulated and 89 downregulated miRNAs were detected (Tables 2 and 3 ). Third, upon comparing the primary cancer tissues (PC) with the late cancer tissues (LC) (Fig. 2C), 4 downregulated and no upregulated miRNAs were detected (Table 4). In these experiments, a total of 3972 genes were regulated by the identified microRNAs. The regulated targeted miRNAs included 275 significantly upregulated miRNAs and 93 downregulated miRNAs, accounting for 6.92% and 2.34% of the total, respectively.
Figure 2.

(A) The scatter plot of signal values compared PCS with the LCS. (B) The scatter plot of signal values compared C with the CS. (C) The scatter plot of signal values compared PC with the LC. C = cancer tissues, CS = cancer-surrounding tissues, LC = later cancer tissues, LCS = later cancer-surrounding tissues, PC = primary cancer tissues, PCS = primary cancer-surrounding tissues.
Table 2.
Compared to C and CS, the number of differentially upregulated genes.
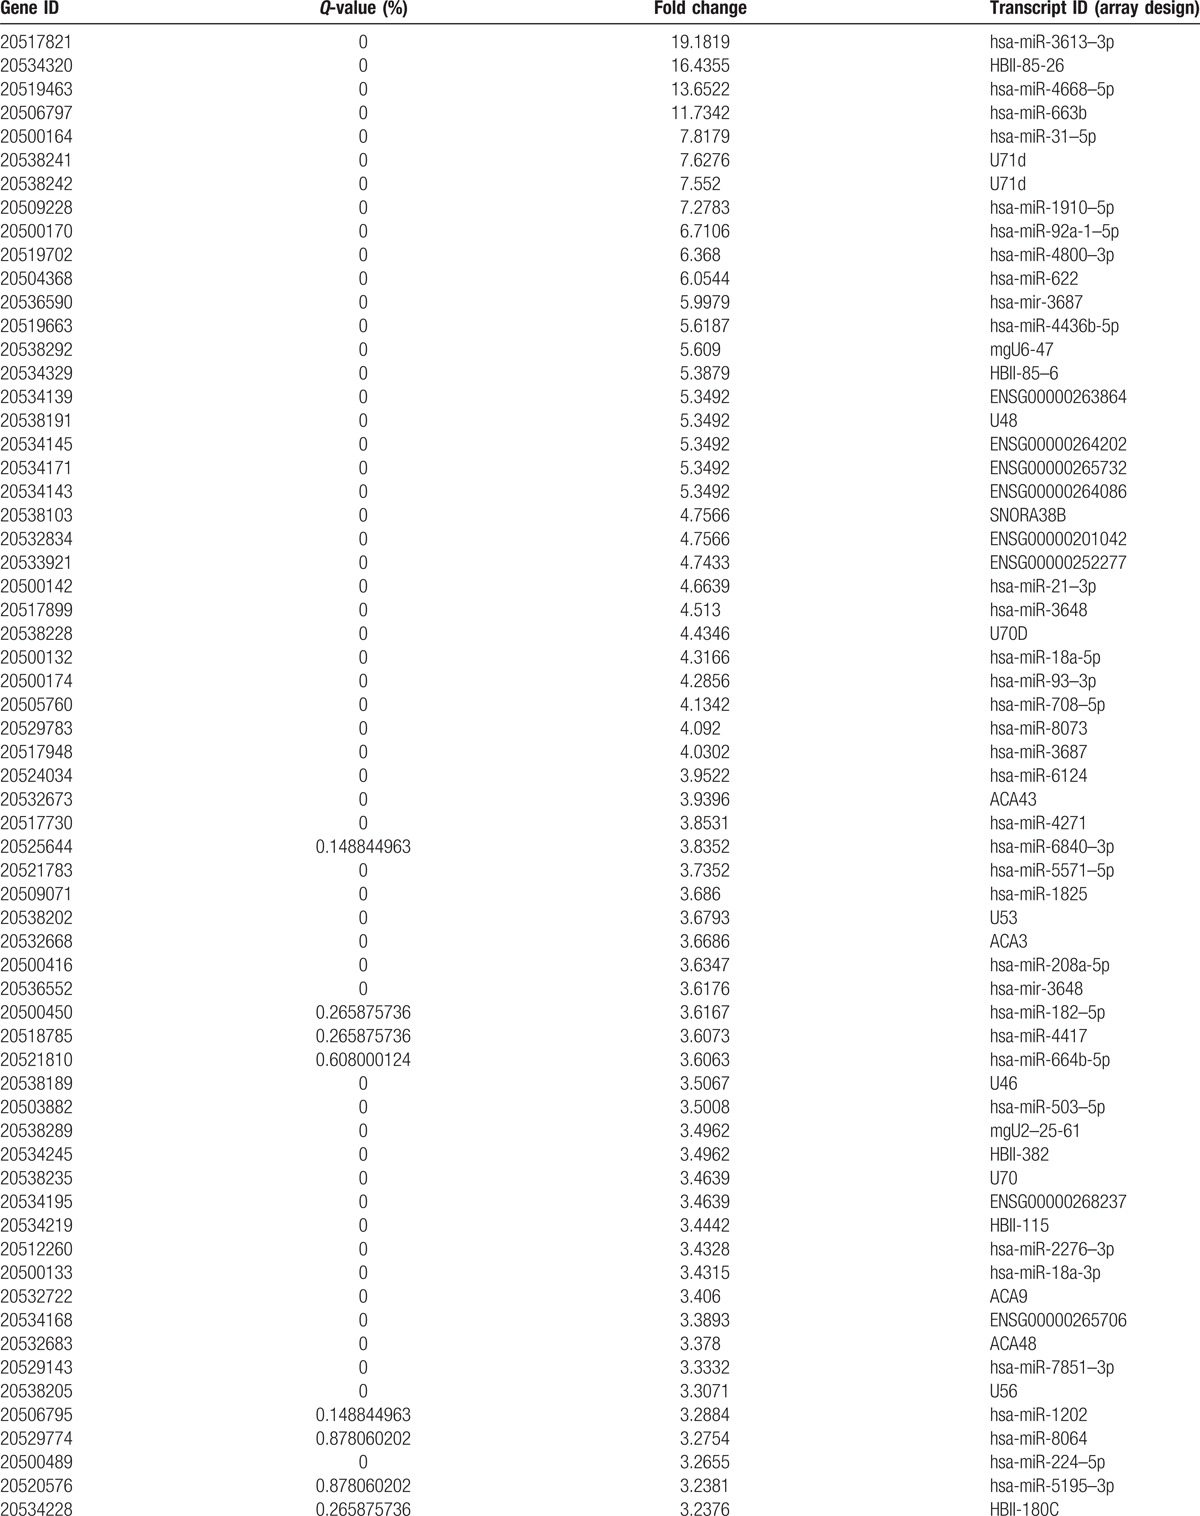
Table 2 (Continued).
Compared to C and CS, the number of differentially upregulated genes.

Table 2 (Continued).
Compared to C and CS, the number of differentially upregulated genes.
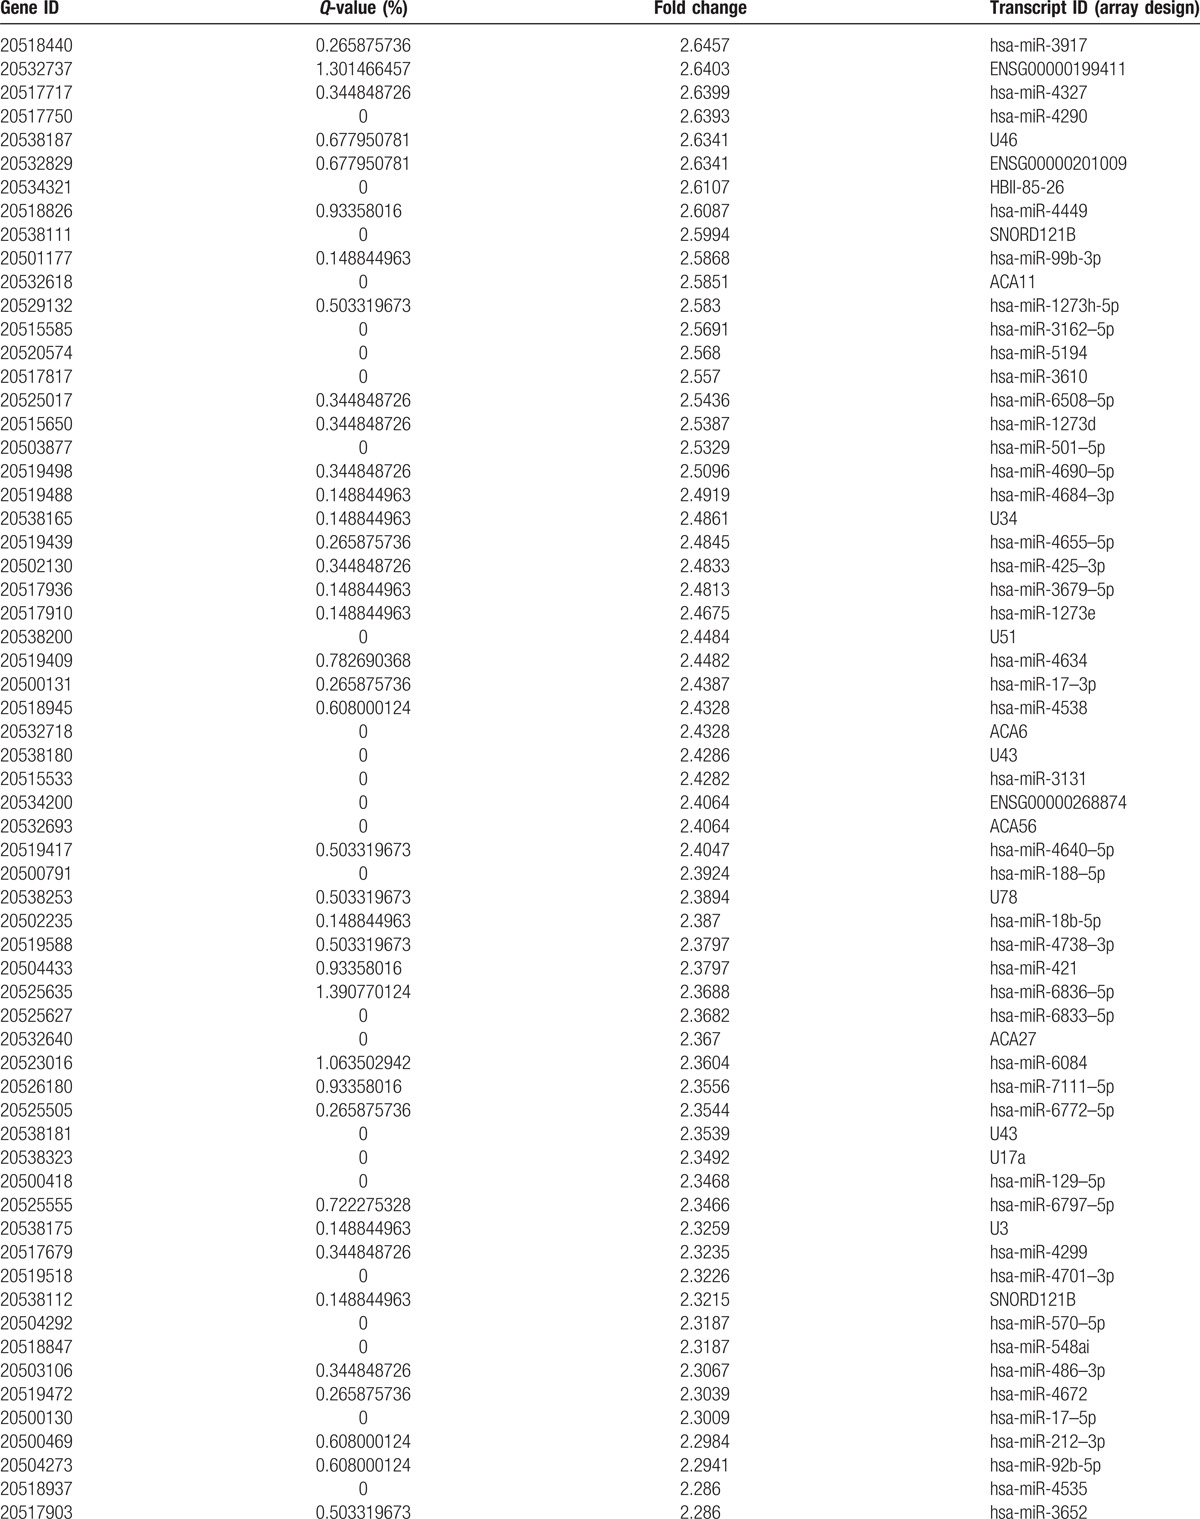
Table 2 (Continued).
Compared to C and CS, the number of differentially upregulated genes.
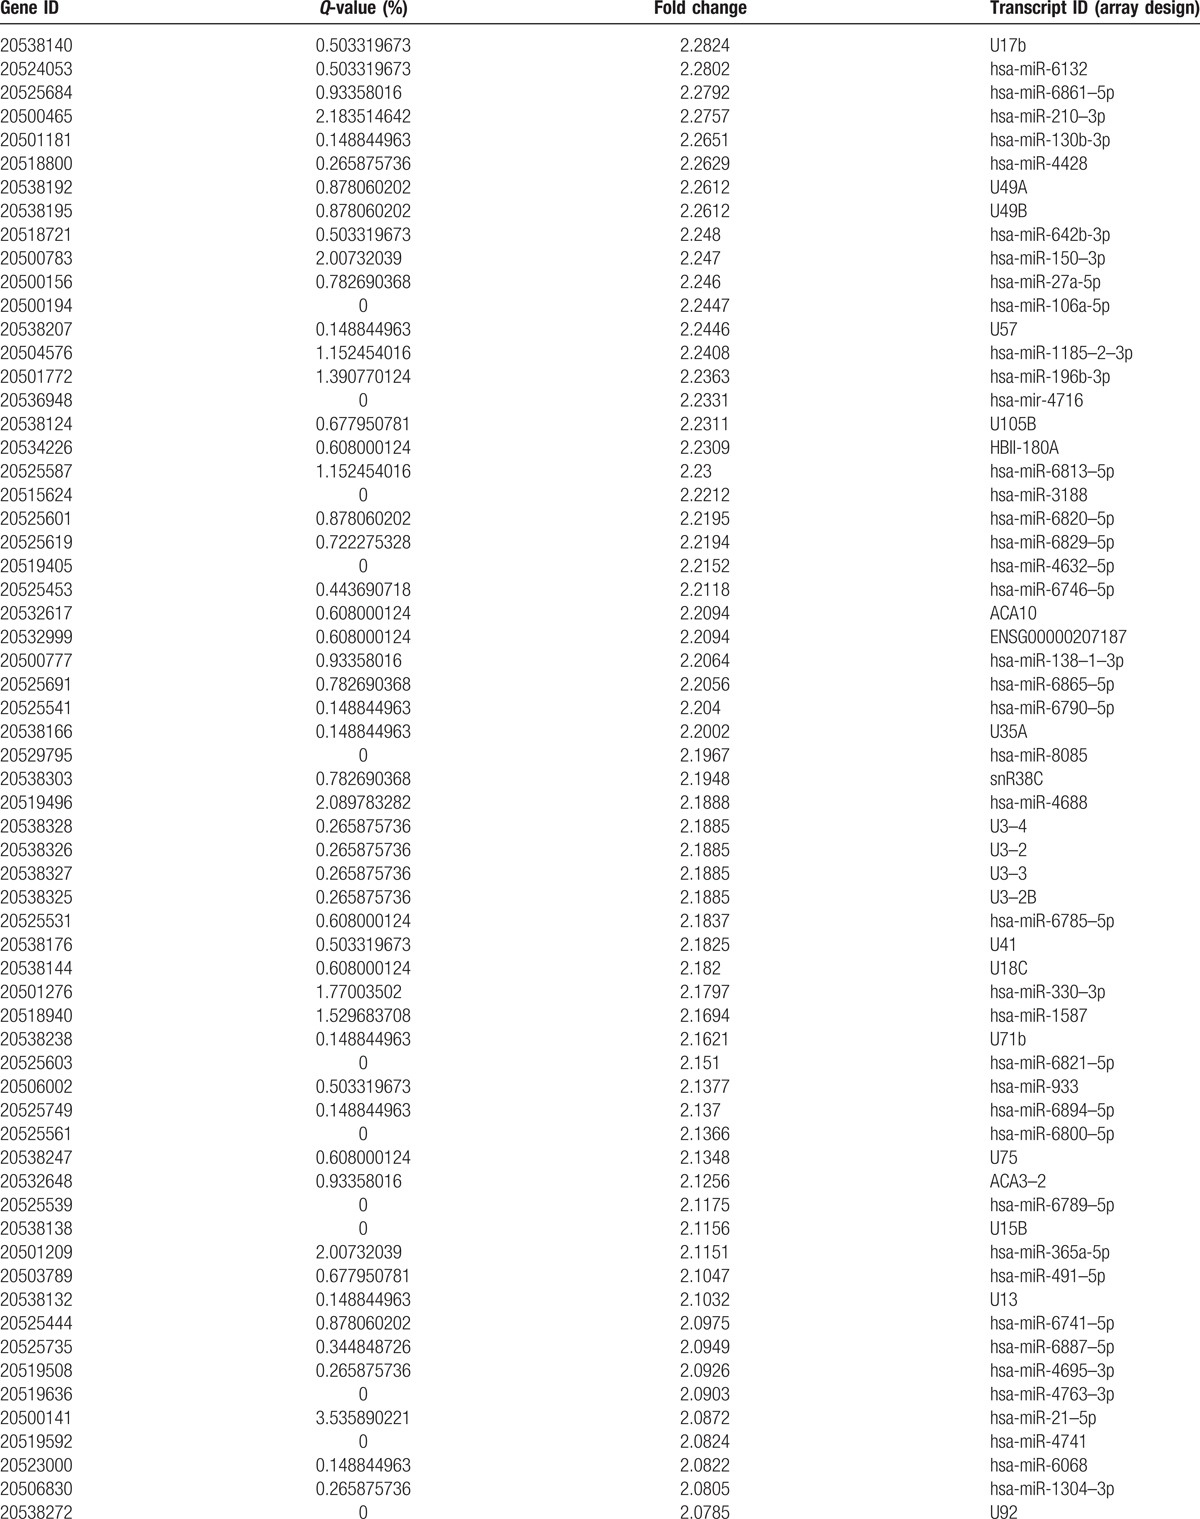
Table 2 (Continued).
Compared to C and CS, the number of differentially upregulated genes.

Table 3.
Compared to C and CS, the number of differentially downregulated genes.
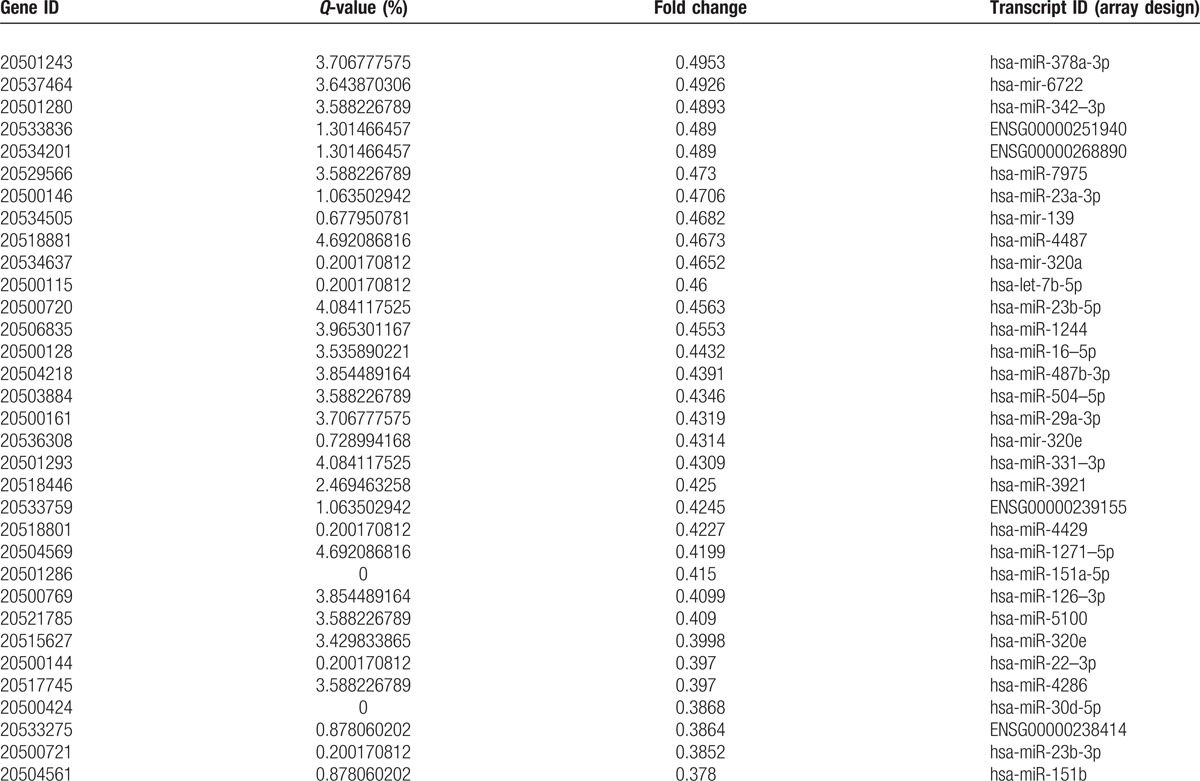
Table 3 (Continued).
Compared to C and CS, the number of differentially downregulated genes.

Table 4.
Compared to PC and LC, the number of differentially downregulated genes.
3.4. GO enrichment and pathway analysis results
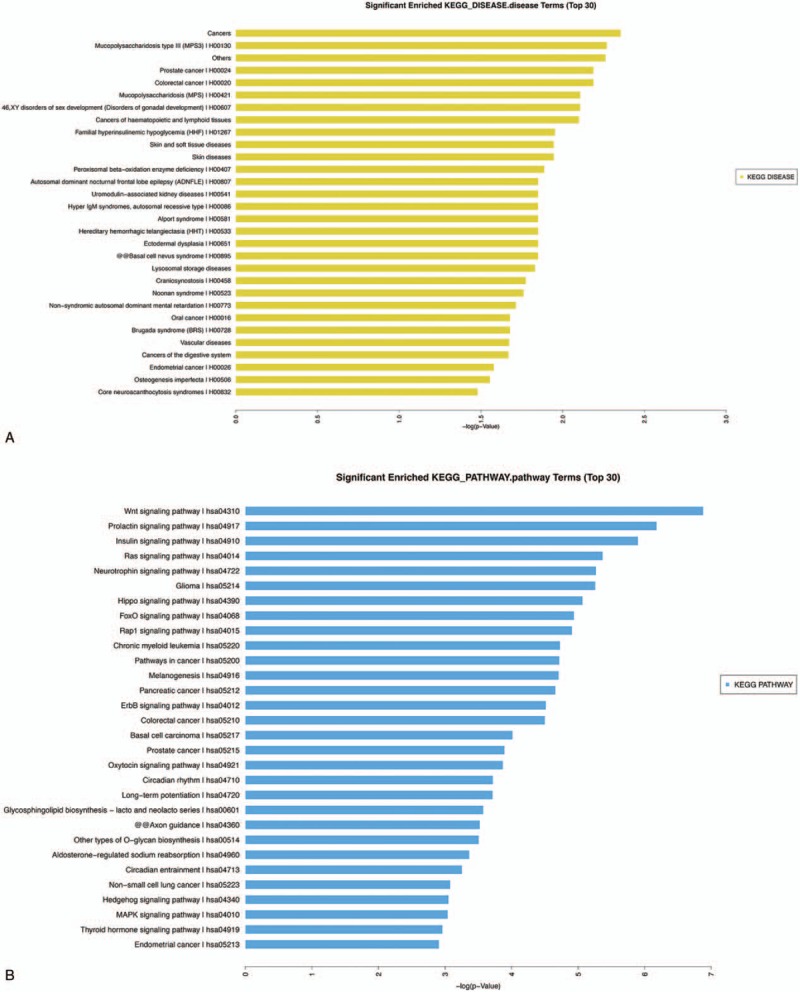
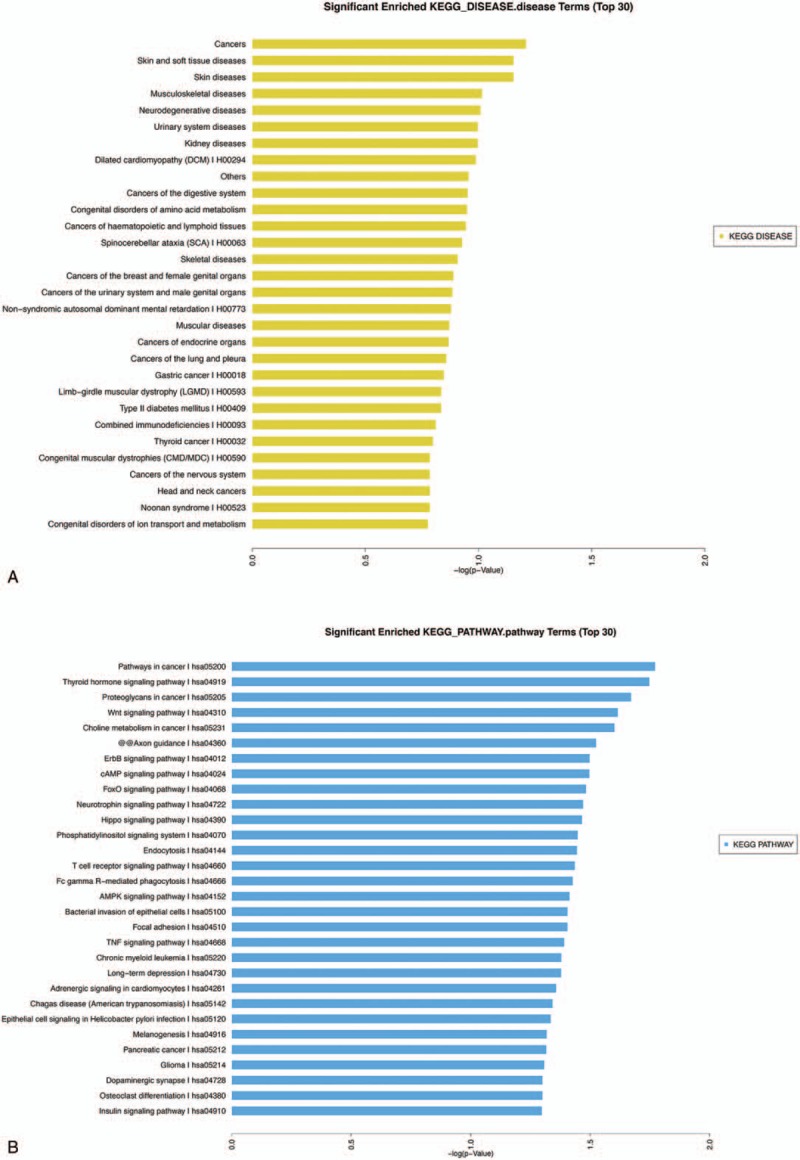
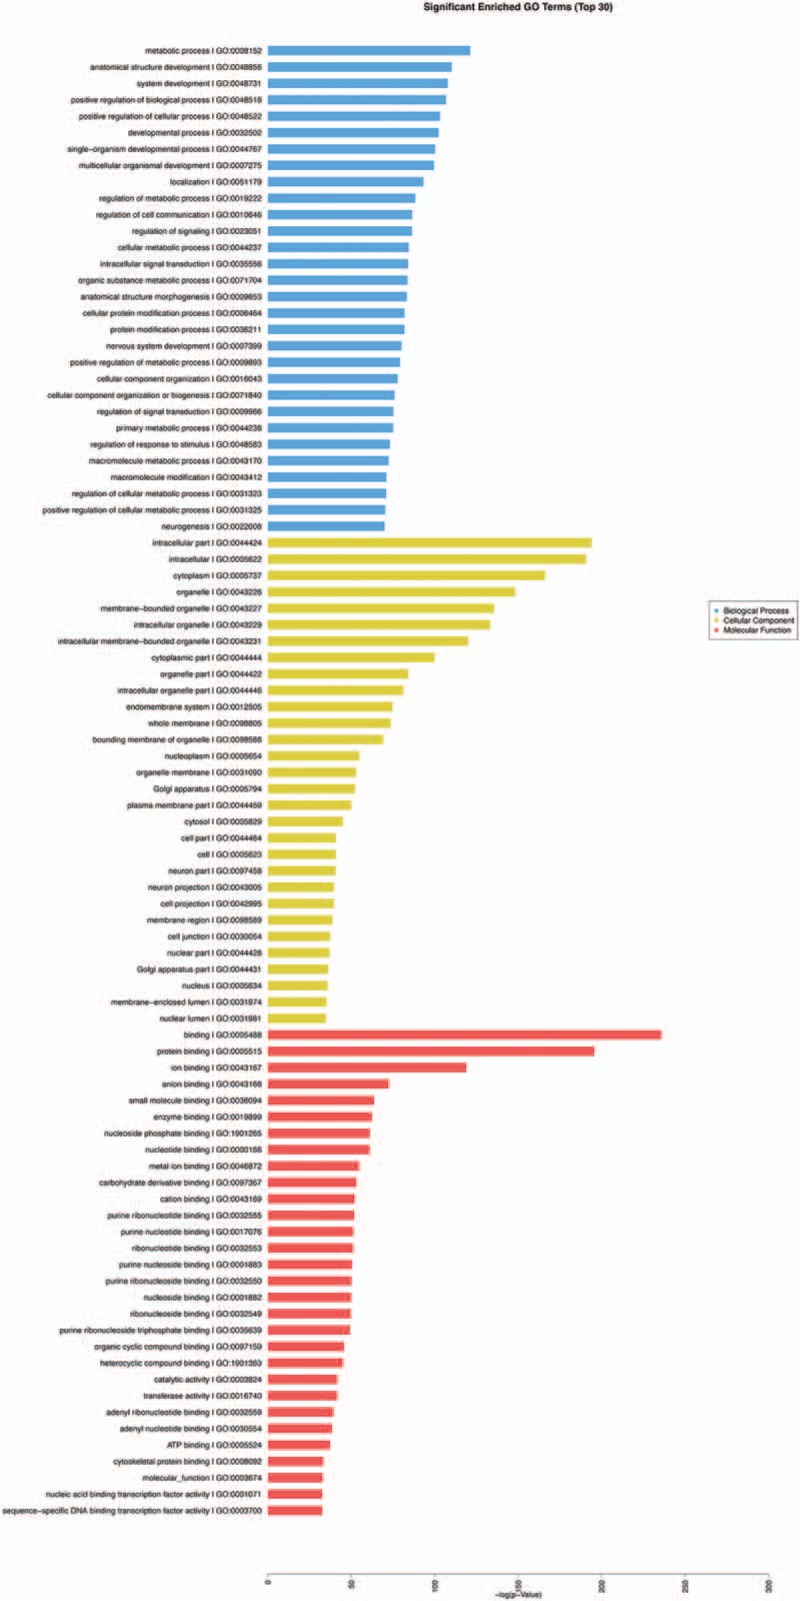
KOBAS analysis was conducted for the target genes and their potentially related diseases and pathways.[8] The analysis predicted target genes associated with MPS3 (mucopolysaccharidosis type III), prostate cancer and CRC (Fig. 3A) in the comparison of the PC and LC tissues. The pathway analysis (Fig. 3B) indicated that these target genes were related to the Wnt, prolactin, insulin, and Ras signaling pathways. Upon comparing C with CS, the target genes were predicted in the tumor, skin, and soft tissue disease categories (Fig. 4A). The pathway analysis (Fig. 4B) showed that the target genes were mainly related to the thyroid hormone signaling pathway, proteoglycans in cancer, Wnt signaling pathway, choline metabolism in cancer, cAMP signaling pathway, T cell receptor signaling pathway, AMPK signaling pathway, and TNF signaling pathway. After conducting the significance analysis of GO terms for the target genes (http://www.geneongoloty.org/), we obtained the corresponding significant GO terms and their genes. Figure 5 indicates that in the biological process category, the targeted genes were mainly related to metabolic processes, anatomical structure development, positive regulation of biological processes, and positive regulation of cellular processes. In the cellular component category, the target genes were mainly related to intracellular components, cytoplasm, organelles and membrane-bounded organelles. In the molecular function category, the target genes were mainly related to the aspects of binding, protein binding, ion binding, anion binding, small molecule binding, enzyme binding, and nucleoside phosphate binding. Figure 6 shows that the target genes with biological process terms were mainly related to the positive regulation of biological processes, positive regulation of cellular processes, regulation of cell communication, and multicellular organismal development. In the cellular components category, the target genes were mainly related to intracellular components, cytoplasm, intracellular organelles, neurons, cytoplasmic structures, and membrane-bounded organelles. In terms of molecular functions, the targeted genes were mainly related to the aspects of protein binding, enzyme binding, ion binding, zinc ion binding and protein domain-specific binding.
Figure 4.
(A) Significantly enriched KEGG-DISEASE terms (top 30). Following comparisons of the C and CS samples, the target gene annotation results were analyzed with the KEGG-DISEASE database. (B) Significantly enriched KEGG-PATHWAY terms (top 30). Following comparisons of the C and CS samples, the target gene annotation results were analyzed with the KEGG-PATHWAY database. C = cancer tissues, CS = cancer-surrounding tissues.
Figure 5.
Significantly enriched GO terms (top 30). The GO (gene ontology) annotation results following comparisons of the C and CS samples. C = cancer tissues, CS = cancer-surrounding tissues, GO = gene ontology.
Figure 3.
(A) Significantly enriched KEGG-DISEASE terms (top 30). Following comparisons of the PC and LC samples, the target gene annotation results were analyzed in the KEGG-DISEASE database. (B) Significantly enriched KEGG-PATHWAY terms (top 30). Following comparisons of the PC and LC samples, the target gene annotation results were analyzed in the KEGG-PATHWAY database. LC = later cancer tissues, PC = primary cancer tissues.
Figure 6.
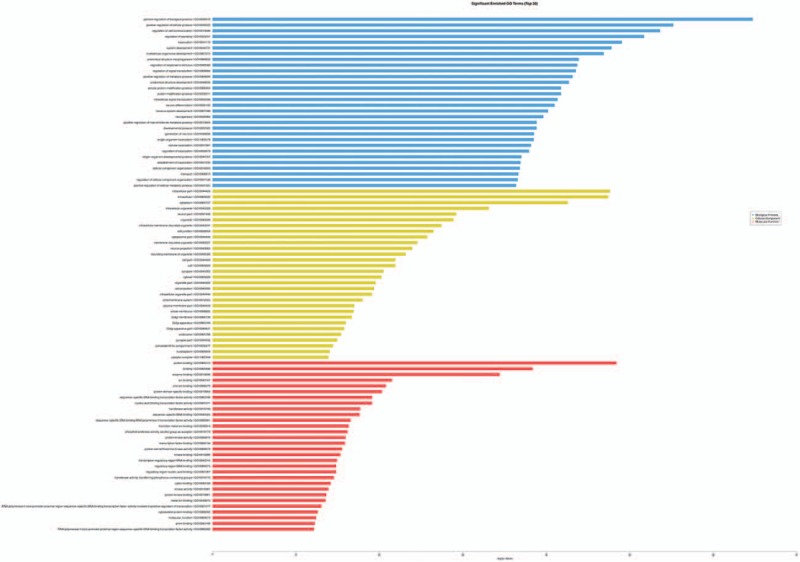
Significantly enriched GO terms (top 30). Following comparisons of the PC and LC samples, the target gene annotation results from the GO (gene ontology) analysis are shown. GO = gene ontology, LC = later cancer tissues, PC = primary cancer tissues.
4. Discussion
The occurrence of colorectal cancer is commonly due to multistep, multifactor, and polygenic effects and involves changes in multiple oncogenes and tumor suppressor genes.[9] In this study, we evaluated 9 pairs of C and CS tissues in different stages using gene chip technology and obtained a number of target genes that were differentially expressed due to regulation by microRNAs. Previous studies showed that abnormal microRNA expression profiles were related to the occurrence and development of many tumors, including colorectal cancer.[10,11] In this study, 275 upregulated and 93 downregulated miRNAs were screened out by comparing C with CS, no upregulated miRNAs and 4 downregulated miRNAs were identified by comparing PC with LC, and neither upregulated nor downregulated miRNAs were identified by comparing PCS with LCS. In the above 3 groups of comparisons, a total of 3972 miRNAs were regulated by microRNAs. Among the differentially regulated genes, 275 and 93 genes were up- and downregulated by the miRNAs, respectively. The microRNA expression profiles were not only different between C and CS but were also between the different CRC stages. Some researchers have suggested that the microRNA expression profile in CRC is significantly different from the profile in the surrounding tissues.[12,13] Qiu et al[14] also confirmed that miRNA-21 expression was related to the TNM stage and suggested that the later TNM stages were associated with higher miRNA-21 expression levels. Furthermore, some studies[15,16] showed that specific microRNAs were associated with the TNM stage of the tumor and suggested that microRNAs might be used for prediction of the tumor prognosis. In different stages of CRC, the microRNA families were associated with CRC-related genes and pathways, participated in tumor-related signaling pathways, and regulated the expression profiles of target genes and biological processes, such as cell proliferation and apoptosis, among others. Other studies showed that[17,18] microRNA alterations in cellular pathways affected the susceptibility and progression of diseases, inhibited or induced the expression of messenger RNAs, and ultimately affected the occurrence of oncogenes and tumor suppressor genes.
The KEGG-Disease analysis revealed that target genes in different stages of cancer were mainly related to tumor occurrence and development, and CRC was no exception. The abnormal regulation of microRNAs in different stages of CRC tissues often leads to the occurrence of many diseases, including tumor invasion and metastasis.[19,20] MicroRNAs regulate the expression of multiple target genes and participate in the regulation of normal physiological processes and tumor cell occurrence, development, and invasion.[21] For example, microRNAs regulate the invasion and metastasis of CRC cells via the PI3K/AKT pathway,[22] the transforming growth factor (TGF-β) signaling pathway,[23] and regulation of matrix metalloproteinases.[24] Similarly, the KEGG pathway analysis of tissues from different CRC stages showed that microRNAs regulated tumor-related cell signaling pathways, such as the Wnt, prolactin, insulin, Ras, thyroid hormone, proteoglycan, and choline signaling pathways. In addition, some of these signaling pathways are involved in the development of colorectal cancer, such as the Wnt and Ras signaling pathways.[25,26] Based on the previous research, the identification of some tumor-related signaling pathways, including the p53, Wnt, and TGF-β signaling pathways, which were mapped to some pathways in CRC, such as cell cycle and survival,[27] showed that microRNAs and their target genes were directly involved in the biological process of CRC and that CRC cell carcinogenesis was indirectly inhibited by the cell signaling pathways in different stages of CRC. Therefore, intervening in these signaling pathways may provide a new method for individualized treatment for and diagnosis of CRC.
These results suggested that microRNAs and their regulated target genes could affect the occurrence and development of CRC by regulating biological processes and that these microRNAs could play important roles in the assessment of the CRC prognosis. For example, over-expression of miRNA-21 in colon cancer was not associated with malignancy but was closely related to survival and treatment outcome.[28] Abnormal microRNA expression also affects the biological processes and molecular functions of other tumors, such as gastric cancer, thyroid cancer and cancer of the nervous system. Thus, microRNAs could become new therapeutic tools for the treatment of malignant tumors by inhibiting or enhancing the expression of target genes, thereby affecting the occurrence and development of malignant tumors.
In summary, the microRNA expression profiles significantly differed between different stages of CRC. The target mRNAs regulated by the affected microRNAs were mainly involved in biological processes, cellular components and molecular functions. MicroRNAs are involved in the entire CRC development process and have particularly important clinical value for the early diagnosis and prognostic evaluation of CRC.
Footnotes
Abbreviations: AGCCC = Affymetrix Gene Chip Command Console, C = cancer tissues, CRC = colorectal cancer, CS = cancer-surrounding tissues, GO = gene ontology, KOBAS = KEGG Orthology-Based Annotation System, LC = late cancer tissues, LCS = late cancer-surrounding tissues, MPS3 = mucopoly-saccharidosis type III, PC = primary cancer tissues, PCS = primary cancer-surrounding tissues, SAM = significance analysis of microarray, TAC = Transcriptome Analysis Console, TGF = transforming growth factor.
BD and WZ proposed the study. BD and DW wrote the first draft.
BD and DW collected and analyzed the data. All authors contributed to the design and interpretation of the study and to further drafts. WZ is the guarantor.
This work was supported by the Innovation and Entrepreneurship Projects in Lanzhou of Gansu Province (No. 2015-RC-37).
The authors have no conflicts of interest to disclose.
References
- [1].Torre LA, Bray F, Siegel RL, et al. Global cancer statistics, 2012. CA Cancer J Clin 2015;65:87–108. [DOI] [PubMed] [Google Scholar]
- [2].Pasquinelli AE, Reinhart BJ, Slack F, et al. Conservation of the sequence and temporal expression of let-7 heterochronic regulatory RNA. Nature 2000;408:86–9. [DOI] [PubMed] [Google Scholar]
- [3].Chi SW, Zang JB, Mele A, et al. Argonaute HITS-CLIP decodes microRNA–mRNA interaction maps. Nature 2009;460:479–86. [DOI] [PMC free article] [PubMed] [Google Scholar]
- [4].Lai EC. Micro RNAs are complementary to 3′ UTR sequence motifs that mediate negative post-transcriptional regulation. Nat Genet 2002;30:363–4. [DOI] [PubMed] [Google Scholar]
- [5].Ramzy I, Hasaballah M, Marzaban R, et al. Evaluation of microRNAs-29a, 92a and 145 in colorectal carcinoma as candidate diagnostic markers: an Egyptian pilot study. Clin Res Hepatol Gastroenterol 2015;39:508–15. [DOI] [PubMed] [Google Scholar]
- [6].Hari DM, Leung AM, Lee JH, et al. AJCC Cancer Staging Manual 7th edition criteria for colon cancer: do the complex modifications improve prognostic assessment? J Am Coll Surg 2013;217:181–90. [DOI] [PMC free article] [PubMed] [Google Scholar]
- [7].Irizarry RA, Hobbs B, Collin F, et al. Exploration, normalization, and summaries of high density oligonucleotide array probe level data. Biostatistics 2003;4:249–64. [DOI] [PubMed] [Google Scholar]
- [8].Xie C, Mao X, Huang J, et al. KOBAS 2.0: a web server for annotation and identification of enriched pathways and diseases. Nucleic Acids Res 2011;39:W316–22. [DOI] [PMC free article] [PubMed] [Google Scholar]
- [9].Bi DL, Wang YX. Progress in researches on microRNA in the colorectal cancer. Mod Oncol 2011;19:2117–20. [Google Scholar]
- [10].Chiang Y, Song Y, Wang Z, et al. microRNA-192, -194 and -215 are frequently downregulated in colorectal cancer. Exp Ther Med 2012;3:560–6. [DOI] [PMC free article] [PubMed] [Google Scholar]
- [11].Hashimoto Y, Akiyama Y, Yuasa Y. Multiple-to-multiple relationships between microRNAs and target genes in gastric cancer. PLoS One 2013;8:e62589. [DOI] [PMC free article] [PubMed] [Google Scholar]
- [12].Ling H, Pickard K, Ivan C, et al. The clinical and biological significance of MIR-224 expression in colorectal cancer metastasis. Gut 2016;65:977–89. [DOI] [PMC free article] [PubMed] [Google Scholar]
- [13].Zhang XM, Pei YB, Zhang F, et al. The diagnostic value of serum microRNA-224 in colorectal cancer. Tumor 2014;623–8. [Google Scholar]
- [14].Qiu S, Meng FX, Liu N, et al. The expression of microRNA-21 in colorectal cancer. Chin J Lab Diagn 2014;18:0091. [Google Scholar]
- [15].Shibuya H, Iinuma H, Shimada R, et al. Clinicopathological and prognostic value of microRNA-21 and microRNA-155 in colorectal cancer. Oncology 2010;79:313–20. [DOI] [PubMed] [Google Scholar]
- [16].Slaby O, Svoboda M, Fabian P, et al. Altered expression of miR-21, miR-31, miR-143 and miR-145 is related to clinicopathologic features of colorectal cancer. Oncology 2007;72:397–402. [DOI] [PubMed] [Google Scholar]
- [17].Schadt EE. Molecular networks as sensors and drivers of common human diseases. Nature 2009;461:218–23. [DOI] [PubMed] [Google Scholar]
- [18].Cordell HJ. Detecting gene-gene interactions that underlie human diseases. Nat Rev Genet 2009;10:392–404. [DOI] [PMC free article] [PubMed] [Google Scholar]
- [19].Olson MF, Sahai E. The actin cytoskeleton in cancer cell motility. Clin Exp Metastasis 2009;26:273–87. [DOI] [PubMed] [Google Scholar]
- [20].Sahai E. Mechanisms of cancer cell invasion. Curr Opin Genet Dev 2005;15:87–96. [DOI] [PubMed] [Google Scholar]
- [21].Ma Y, Li W, Wang H. Roles of miRNA in the initiation and development of colorectal carcinoma. Curr Pharm Des 2013;19:1253–61. [DOI] [PubMed] [Google Scholar]
- [22].Li N, Tang A, Huang S, et al. MiR-126 suppresses colon cancer cell proliferation and invasion via inhibiting RhoA/ROCK signaling pathway. Mol Cell Biochem 2013;380:107–19. [DOI] [PubMed] [Google Scholar]
- [23].Bu P, Wang L, Chen KY, et al. miR-1269 promotes metastasis and forms a positive feedback loop with TGF-beta. Nat Commun 2015;6:6879. [DOI] [PMC free article] [PubMed] [Google Scholar]
- [24].Tang W, Zhu Y, Gao J, et al. MicroRNA-29a promotes colorectal cancer metastasis by regulating matrix metalloproteinase 2 and E-cadherin via KLF4. Br J Cancer 2014;110:450–8. [DOI] [PMC free article] [PubMed] [Google Scholar]
- [25].Najafi H, Soltani BM, Dokanehiifard S, et al. Alternative splicing of the OCC-1 gene generates three splice variants and a novel exonic microRNA, which regulate the Wnt signaling pathway. RNA 2017;23:70–85. [DOI] [PMC free article] [PubMed] [Google Scholar]
- [26].Ye L, Wang G, Tang Y, et al. A population-specific correlation between ADIPOQ rs2241766 and rs 1501299 and colorectal cancer risk: a meta-analysis for debate. Int J Clin Oncol 2016;22:307–15. [DOI] [PubMed] [Google Scholar]
- [27].Li X, Liang L, De Vivo I, et al. Pathway analysis of expression-related SNPs on genome-wide association study of basal cell carcinoma. Oncotarget 2016;7:36885–95. [DOI] [PMC free article] [PubMed] [Google Scholar]
- [28].Schetter AJ, Nguyen GH, Bowman ED, et al. Association of inflammation-related and microRNA gene expression with cancer-specific mortality of colon adenocarcinoma. Clin Cancer Res 2009;15:5878–87. [DOI] [PMC free article] [PubMed] [Google Scholar]