Supplemental Digital Content is available in the text
Keywords: chemokines, cytokines, decade long ART, HIV-1
Abstract
Acute human immunodeficiency virus (HIV) infection is associated with a marked induction of several pathways that are linked to inflammation and CD4+ T-cell depletion. Many of these processes do not fully resolve on short-term combination antiretroviral therapy (cART) (<5 years), despite complete and durable suppression of viremia. The effects of long-term (>15 years) successful antiretroviral therapy (ART) and the linkage between levels of biomarkers remain unclear. Therefore, the present study aims to assess the host plasma proteome in a well-defined clinical material from HIV-1-positive male patients on successful long-term ART (>15 years) and compared them with age-matched healthy controls and treatment-naïve male patients with viremia in a cross-sectional manner.
Plasma samples were obtained from 3 categories of age-matched HIV-1-positive male patients on long-term successfully (ART, n = 10) with a median (Interquartile range, IQR) of 19 (17–20) years, treatment-naïve patients with viremia (VP, n = 14), and HIV-1-negative persons (HC, n = 11). Plasma proteome was analyzed using the proximity extension assay targeting 92 factors. Statistical analyses were performed with GraphPad Prism v7, R-packages, and Qlucore Omics Explorer v3.2. Functional enrichment analysis was performed by Kyoto Encyclopedia of Genes and Genomes (KEGG), and interactions of specific molecules were identified using Path Designer integrated into Ingenuity Pathway Analysis (IPA).
Group wise comparison identified 53 soluble factors, which differed between the groups (P < .05). Cluster analysis identified 13 discrete soluble factors (CD8A, CRTAM, CXCL13, EGF, CD5, CD40, CXCL9, Gal-1, IL12RB1, KLRD1, PD-1, CASP-8 and TNFRSF9) between the studied groups (adjusted P < .001). The long-term successfully ART-treated individuals clustered and networked with the HC while VPs clustered separately. All of the proinflammatory cytokines and chemokines were normalized back to levels of healthy controls in long-term successfully ART-treated individuals, but not the levels of KLRD1 and PGDFB.
sKLRD1 that is involved in the regulation of natural killer cell (NK) mediated cytotoxicity, failed to be restored to the level of HIV-negative individuals despite successful long-term ART. Additional analysis of NK cells along with T-cell subsets can provide insights into the long-term effects of ART on the immune system.
1. Introduction
Acute HIV infection is associated with a distinct induction of several pathways that are linked to inflammation, CD4+ T-cell depletion, and the establishment of the viral reservoir.[1] HIV-induced dysregulation of the inflammatory network is multidimensional based on the immune status of the patients, any co-infections, and microbial translocation.
The effect of combination antiretroviral therapy (cART) on mortality and morbidity of HIV-infected patients is remarkable.[2] However, the life spans of also well-treated patients are shorter than those of matched HIV-negative controls.[3] This is to a large extent due to an increased rate and deaths in co-morbidities and effect of antiretroviral therapy (ART) such as cardiovascular events,[4] kidney disease,[5] and others. This could be a result of persistent immune activation despite successful ART, which is poorly understood. Most of the studies have been conducted on small numbers of soluble biomarkers or analyzed only a shorter duration of therapy, given the technological challenges and limited availability of a long-term quality patients’ follow-up. The effects of successful long-term ART and the cross-talk between the soluble biomarkers and subsequent altered immunological pathways remain unclear and could provide useful insights into disease progression and pathogenesis. With the advancement of high-throughput technologies, it is now possible to analyze a large panel of soluble factors simultaneously. Proximity extension assay (PEA) technology (Olink Bioscience AB, Uppsala, Sweden) is one of these high-throughput multiplex immunoassays and measures 92 soluble factors simultaneously using only 1 μL plasma.[6] The method has high sensitivity and specificity[6] and can detect low abundant proteins[7] and be used in wellness study[8] and other diseases including cardiovascular,[9] inflammatory disease,[10] metabolic disorders,[11] and so on to identify novel biomarkers. Therefore, the aim of the present study is to assess the host plasma proteome in a well-defined clinical material from HIV-1-positive male patients on successful long-term ART (>15 years) and compared them with age-matched healthy controls and treatment-naïve male patients with viremia.
2. Materials and methods
2.1. Patients
Cross-sectional plasma samples were obtained from 3 categories of age-matched HIV-1-positive male patients on ART (n = 10) with a median (IQR) of 19 (17–20) years, treatment-naïve patients with viremia (VP, n = 14) and HIV-1-negative persons (HC, n = 11). The patients were selected based on the clinical data obtained from the Swedish InfCareHIV cohort who were attending the Infectious Disease Clinic at Karolinska University Hospital, Stockholm. The inclusion criteria for the successful long-term ART was male with at least 10 years of suppressive therapy with not more than 1 viral blips (viral load <100 copies/mL). The 2 decades long clinical data were obtained from the prospective Swedish InfCareHIV cohort.[12] Samples were collected between June 2015 and April 2016. Clinical data included here were between January 1982 and June 2017.
2.2. Plasma proteome
Plasma samples were analyzed using the PEA and the Olink Immuno-oncology panel (Olink Bioscience AB).[6] This panel includes 92 proteins. The protein analysis is reported as normalized protein expression levels (NPX), which are Ct values normalized by the subtraction of values for extension control, as well as interplate control; the scale is shifted using a correction factor (normal background noise) and reported in log2 scale.[13]
2.3. Functional enrichment and interactome analysis
Functional enrichment analysis was performed by Kyoto Encyclopedia of Genes and Genomes (KEGG), and interactions of specific molecules were identified using Path Designer integrated into QIAGEN's Ingenuity Pathway Analysis (IPA, QIAGEN Redwood City, www.qiagen.com/ingenuity).
2.4. Statistical analysis and visualization
Given the low number of samples, we applied non-parametric test using GraphPad Prism v7. Group-wise comparison was performed using Mann–Whitney U test for continuous variables and chi-square test for discrete variables. The multi-group analysis was performed by Kruskal–Wallis test. Change in CD4 T-cell count from the start of therapy and at the time of sampling was performed using Wilcoxon matched-pairs signed-rank test. The explorative analysis was carried out in Qlucore Omics Explorer version 3.2. Multi-group comparison was performed using analysis of variance (ANOVA) at false discovery rate (FDR) adjusted P(q) <.05. Cluster analysis (k-means) was performed at stricter FDR <0.001 using ANOVA. Venn diagram was created in InteractiVenn.[14] The differential profile (heatmap) of the soluble factors (proteome) was analyzed using Qlucore Omics Explorer version 3.2. CIRCOS plot was used to visualize the circular plot.
2.5. Ethical considerations
The study is approved by regional ethics committees of Stockholm (2013/1944–31/4). All participants have given informed consent.
3. Results
3.1. Patient characteristics
Patients clinical and demographic characteristics are given in Table 1. All the patients are male with a median age of 50 years. There was a significant difference in HIV-1 seropositivity between the individuals of VP and ART group (P < .001). The median (IQR) seropositivity year in the patients with long-term ART was 1995 (1991–1997). There was a significant difference in nadir CD4+ T-cell count (324 vs. 135; P < .001) and CD4+ T-cell count at the time of sample collection (390 vs 520; P = .008) between the VP and ART group of patients. The median (IQR) duration of ART in the long-term ART group was 19 years (17–20) with median (IQR) of 16 (15–18) years of suppressive therapy (viral load below detection level). The gain in the CD4+ T-cell count was statistically significant across the group (P = .002) (Fig. 1A). The 2-decade-long viral load count is given in Figure 1B. None of the patients had any co-infection at the time of sampling.
Table 1.
Patients’ clinical and demographic characteristics.
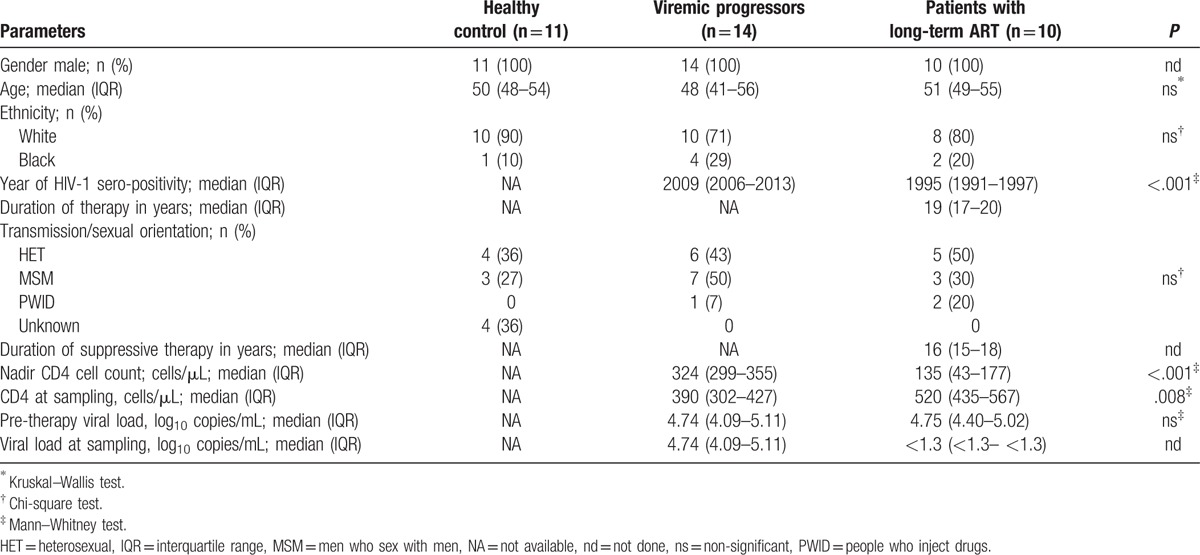
Figure 1.
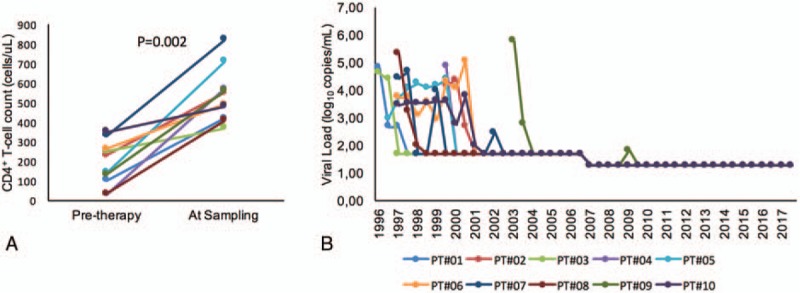
Longitudinal clinical follow-up of ART patients. (A) CD4+ T-cell count at the start of therapy and at the time of sampling. (B) Viral load.
3.2. Plasma proteome profiling
Group-wise comparison identified 53 soluble factors which differed between the groups (P < .05; Mann–Whitney U test), of which 47 factors were different between HC and VP, 45 between long-term ART and VP, and 3 between HC and ART (Fig. 2A and Supplementary file 1). Among those factors, 5 factors were unique between ART and VP (CCL13, CCL4, CXCL1, CD4, and CSF-1), while 7 factors were unique between HC and VP (DCN, PlGF, HO-1, CCL23, TNFRSF21, CXCL11, and VEGFR-2), and only 1 secretory factor between HC and ART, namely angiopoietin-2 (ANG-2). The 2 chemokines CCL4 and CCL13 were significantly elevated in ART-treated patients compared to VP, and even a trend was observed compared to HC (Fig. 2B). In patients on long-term suppressive ART, all of the pro-inflammatory molecules examined (IL-7, IL-12, and soluble IL receptor IL12RB1) went back to levels of healthy controls. Among the 29 cytokines tested, 93% (27/29) of them went back to physiological levels in the long-term ART group, but not the levels of the non-cytokine molecules soluble killer cell lectin-like receptor subfamily D member 1 (KLRD1, also CD94) (P = .02) and platelet-derived growth factor subunit B (PGDFB) (P = .0485) (Fig. 2B). ANG-2, an endothelial activation marker, did also not normalize to the healthy state following long-term suppressive therapy.
Figure 2.
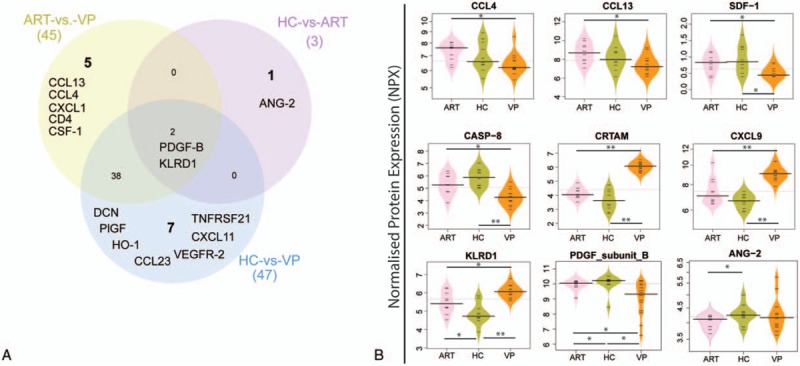
Level of plasma soluble factor. (A) Venn diagram of plasma soluble factors statistically difference (P < .05) of the NPX value in a case–control manner. The sum of the numbers in each large circle represents the total number of statistically different proteins among various combinations (ART vs HC, HC vs VP and ART vs VP). The overlapping part of the circles represents common proteins between combinations. (B) Bean plot is indicating the level of the selected soluble factor. P < .05 is marked with “∗” while P < .001 with “∗∗.” ART = antiretroviral therapy, HC = healthy control, VP = viremic progressors.
To further dissect which biomarkers can differentiate the groups, cluster analysis (k-means) was performed at significance level FDR < .05. Cluster analyses identified higher levels of CCL13, SDF-1, TWEAK, CXCL5, CD40-L, CASP8, TNFRSF12A, DCN, and TNFRSF21 in ART and HC, while CXCL11, Gal-9, IL-12, CXCL13, CXCL9, CXCL10, CCL19, KLRDI, CD8A, IL12RB1, CD27, Granzyme-H, and Granzyme-A in VP (Fig. 3A). The patients with successful long-term ART clustered and networked with HC, while VP grouped separately. We further used a stringent statistical significance to find the precise network and potential markers between the VP and ART/HC groups. Cluster and network analysis identified 13 soluble factors (CD8A, CRTAM, CXCL13, EGF, CD5, CD40, CXCL9, Gal-1, IL12RB1, KLRD1, PD-1, CASP-8, and TNFRSF9) which were significantly discrete at false discovery rate (FDR) adjusted to P(q) <0.001 using ANOVA (Fig. 3B).
Figure 3.
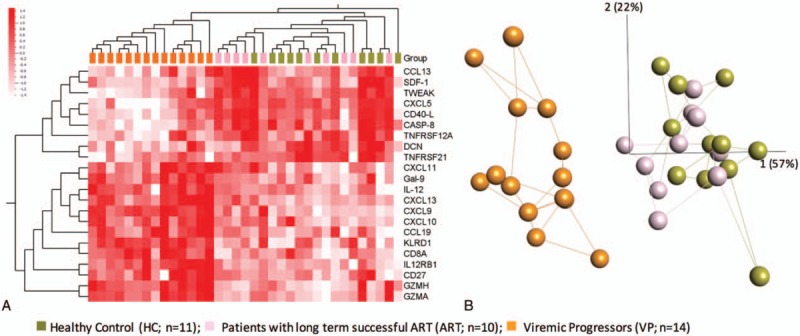
The plasma proteome profiles using hierarchical clustering. (A) Cluster analysis based on the soluble factors at FDR < 0.05. Heatmap shows fold change +1.5 (red) to −1.5 (white). (B) Cluster (k means) and network analysis with FDR < 0.001. FDR = false discovery rate.
3.3. Functional enrichment analysis
We performed functional enrichment analysis by Kyoto Encyclopedia of Genes and Genomes (KEGG) using 53 proteins (defined by Mann–Whitney U test significant differences between groups). In total, 32 pathways are enriched with FDR <0.05 (Supplementary data file 2). Among these pathways, cytokine–cytokine receptor interaction (FDR = 3.62 × 10⁻²⁹) and chemokine signaling pathway (FDR = 1.26 × 10⁻¹⁰) included together 29 soluble factors. Apart from that, antigen processing and presentation (FDR = 0.007), and natural killer cell mediated cytotoxicity (FDR = 0.037) are enriched. The CIRCOS plot indicates the difference of soluble marker levels between groups and subsequent signaling pathways the molecules are involved in (Fig. 4A). There are several factors, which are present in more than 1 pathway. Further Ingenuity Pathway analysis (IPA) identifies that the expression of KLRD1 is regulated by proinflammatory molecules (IL15, IL21, IL2, IL4, IL12 complex, etc) and it regulates the tumor necrosis factor (TNF) and cytokine signaling pathways (Fig. 4B).
Figure 4.
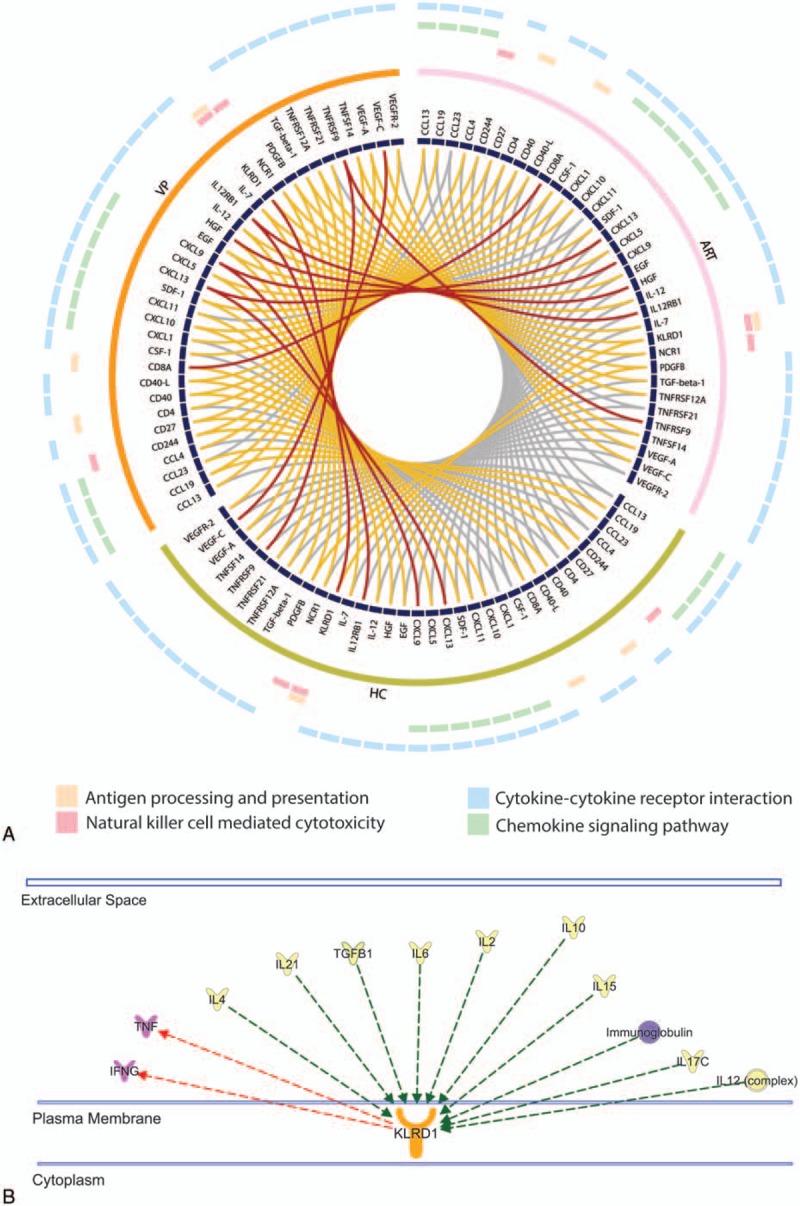
Functional enrichment analysis. (A) CIRCOS plot is indicating the significance of soluble factors between 2 groups. Outer 4 circles denote the corresponding KEGG pathways. Each ribbon which links 2 proteins represent the comparison, and different colour indicates its P-value (Wilcoxon rank-sum test) in the analysis. Grey ≥.05, yellow: <.05 to 0.001, red: <.001. (B) Interactions of KLRD1 identified in Ingenuity Pathway Analysis (IPA). Selected extracellular molecules are shown. KLRD1 was regulated by proinflammatory molecules, IL15, IL21, IL2, IL4, IL12 complex, and so on (green arrow) and it regulates the TNF and cytokine signaling pathway (red arrow). KEGG = Kyoto Encyclopedia of Genes and Genomes, TNF = tumor necrosis factor.
4. Discussion
Our study investigated the levels of soluble biomarkers in patients with nearly 2 decades successful ART with the highest number of proteins studied so far. Very long-term ART normalizes the level of most cytokines and chemokines explored to the degree of healthy individuals. However, some biomarkers, like KLRD1 and ANG-2, do not go back to healthy physiological levels indicating that immunological events still take place in HIV-1-infected patients despite long-term suppressive ART.
In concordance with other studies,[15] elevations of pro-inflammatory cytokines and chemokines were seen in VP. As observed earlier, the 2 chemokines CCL4 and CCL13 were significantly elevated in ART-treated patients compared to VP, and even a trend was observed compared to HC. CCL4 is known as a major HIV-suppressive factor for CCR5-tropic strains, which is produced by CD8+ T-cells, as it acts as a competitor for the viral binding site.[16] Since VP patients fail to control the infection, reduced CCL4 levels are explainable, either as one of the causes or the consequences of sustained viremia. But it is surprising, that CCL4 levels in patients on long-term ART were higher than for HC, though it was not statistically significant. The CCL13 ligand for receptor CCR2/CCR3 is a chemotactic factor for monocytes and macrophages.[17] However, its involvement during HIV infection is not evident. SDF-1 binds to CXCR4 and therefore competes with X4-tropic virus strains, but to a less extent than CCL4 does with CCR5-tropic strains.[16] In our study SDF-1 levels in ART were comparable with those in HC, but were significantly reduced in VP. Therefore, apart from suppressing the virus, ART might also boost the host's non-cytolytic antiviral immunity.
In earlier studies, levels of proinflammatory cytokines in patients on ART have not been reduced to levels of healthy individuals despite successful therapy.[18,19] In our study, we observed, that in patients on long-term suppressive ART, all of the proinflammatory molecules examined (IL-7, IL-12, and soluble IL receptor sIL12RB1) went back to normal physiological levels. Among the 29 cytokines tested, 93% (27/29) of them went back to normal physiological levels in long-term ART groups, This confirms, that very long-term successful ART does not only lead to a pronounced decline in viral load but also reconstitutes the inflammatory state almost to the physiological level of healthy individuals.
Together all analysis demonstrated, that in patients on ART, KLRD1 levels were in between those of HC and VP. This receptor is expressed mainly on NK cells and plays a significant role in mediating NK cytotoxicity. KLRD1 (CD94) forms heterodimers with NKG2 resulting in a receptor complex expressed on NK cells, and also on some CD8+ T cells. So far, 5 different members of the CD94/NKG2 family are known which are inhibitory receptors, CD94/NKG2A and CD94/NKG2B, or activating receptors, CD94/NKG2C, CD94/NKG2E, and CD94/NKG2H. It has further been shown, that some of these complexes recognize the non-classical Human Leukocyte Antigen (HLA) class I molecules, namely HLA-E, with different binding affinities.[20,21] Contradictory results have been observed in HIV-1 infection, for example increase and stabilization of the expression of HLA-E on lymphocytes in vivo, which might be a mechanism of immune evasion used by the virus.[20] Since HLA-E can bind to CD94/NKG2A, this interaction could lead to impaired NK cell function. In concordance, it has also been reported, that expression of inhibitory CD94/NKG2A is increased in viraemic patients.[20] In our data, an increased level of sKLRD1 was seen in VP. However, we do not know which heterodimer types are involved in that upregulation. Other groups have also observed increased expression of CD94 and NKG2A on NK cells and T-cells, which was associated with disease progression in HIV-infected patients.[22,23] That would support the hypothesis of upregulated CD94/NKG2A in VP leading to inhibition of NK cell activity and NK cell dysfunction. In contrast, there are also studies proposing a decrease in cells expressing CD94/NKG2A, along with an increase of cell expressing the activating receptor CD94/NKG2C in viremic HIV-infected patients.[24,25] Despite these contradictory results, it can be concluded that CD94/NKG2 signaling is altered in viral progressors and that long-term ART could not fully re-establish the physiological state of healthy individuals in our cohort.
Angiopoietin-2 binds to the cell surface receptor for angiopoietin-1 (ANG-1), namely TEK/TIE2; and thus, modulates ANG-1 signaling. An earlier study in females from Kenya observed, that increased ANG-2 plasma levels in chronic HIV-1 infection decrease after ART.[26] A higher level of ANG-2 is also associated with higher mortality.[26] However, in our study with male populations both in VP and ART, the median plasma level is lower than in HC, with statistical significance between ART and HC group. The study in Kenya also detected significant associations between the use of oral contraceptive pills and higher plasma ANG-2 levels in pregnancy.[26] They also observed that estrogen stimulates ANG-2 mRNA expression.[27] We, therefore, conclude that endothelial activation marker ANG-2 was lower in a male with advanced HIV infection and had no effect on ART initiation, though it does not increase to a healthy status.
The study has limitations that merit comments. First, the numbers of patients were relatively low. This is mainly because of limited numbers of HIV-infected individuals with very long-term suppressive therapy for whom adequate clinical and demographical information is available. These groups of patients were identified from nearly 10,000 patients who got treatment care in Sweden and availability of the plasma samples. Second, we only looked into 92 plasma soluble factors. However, to best of our knowledge, this is the most substantial amount of markers that have been studied to date.
In conclusion, this is the first study, which investigated the levels of soluble biomarkers in patients with nearly 2 decades successful ART with the highest number of proteins studied so far. Very long-term ART normalizes the level of most cytokines and chemokines explored to the degree of healthy individuals. However, some biomarkers do not go back to healthy physiological levels indicating that immunological events still take place in HIV-1-infected patients, despite long-term suppressive ART. Future analyses of cellular subsets other than T-lymphocyte populations, like NK cells, are likely to help us gain further insights into the long-term restoration of the immune system by ART.
Supplementary Material
Supplementary Material
Footnotes
Abbreviations: ANG-1 = angiopoietin-1, ANG-2 = angiopoietin-2, ANOVA = analysis of variance, cART = combination antiretroviral therapy, CASP-8 = caspase 8, CCL13 = chemokine (C-C motif) ligand 13, CCL19 = chemokine (C-C motif) ligand 19/macrophage inflammatory protein-3-beta, CCL23 = chemokine (C-C motif) ligand 23/macrophage inflammatory protein 3, CCL4 = chemokine (C-C motif) ligand 4/macrophage inflammatory protein-1 beta, CD27 = cluster of differentiation 27, CD4 = cluster of differentiation 4, CD40 = cluster of differentiation 40/tumor necrosis factor receptor super family member 5, CD40-L = cluster of differentiation 40 ligand/tumor necrosis factor super family member 5, CD5 = cluster of differentiation 5, CD8A = cluster of differentiation 8a, CRTAM = cytotoxic and regulatory T cell molecule, CSF-1 = macrophage colony-stimulating factor 1, CXCL1 = chemokine (C-X-C motif) ligand 1, CXCL11 = Chemokine (C-X-C motif) ligand 11, CXCL13 = chemokine (C-X-C motif) ligand 13/B lymphocyte chemoattractant, CXCL5 = chemokine (C-X-C motif) ligand 5, CXCL9 = chemokine (C-X-C motif) ligand 9, DCN = decorin, EGF = epidermal growth factor, FDR = false discovery rate, Gal-1 = Galectin-1, Gal-9 = Galectin-9, HC = healthy control, HIV-1 = human immunodeficiency virus type 1, HLA = human leukocyte antigen, HO-1 = heme oxygenase 1, IL = interleukin, IL12RB1 = interleukin 12 receptor subunit beta 1, IPA = Ingenuity Pathway Analysis, IQR = interquartile range, KEGG = Kyoto Encyclopedia of Genes and Genomes, KLRD1 = killer cell lectin-like receptor subfamily D, member 1, NK cell = natural killer cell, NPX = normalized protein expression, PD-1 = programmed cell death protein 1, PDGFB = platelet-derived growth factor subunit B, PEA = proximity extension assay, PlGF = placenta growth factor, SDF-1 = stromal cell-derived factor-1, TNFRSF21 = tumor necrosis factor receptor super family member 21/death receptor 6, TNFRSF9 = tumor necrosis factor receptor super family member 9, TWEAK = tumor necrosis factor-like weak inducer of apoptosis, VEGFR-2 = vascular endothelial growth factor receptor 2, VP = viremic progressors.
This study was funded by Swedish Research Council (2017-01330), Stockholm County Council (ALF 20160074), and Jonas Söderquist's Stipendium for Experimental Virology and Immunology Research-2016 to UN.
The authors report no conflicts of interest.
Supplemental Digital Content is available for this article.
References
- [1].Jeffrey E, Teigler BS, Chomont N, et al. Soluble Biomarkers in Acute JIV Infection Reveal Insight Into HIV Reservoir. In: Conference on Retroviruses and Opportunistic Infections. Seattle, USA; 2017. [Google Scholar]
- [2].Palella FJ, Jr, Delaney KM, Moorman AC, et al. Declining morbidity and mortality among patients with advanced human immunodeficiency virus infection. HIV Outpatient Study Investigators. N Engl J Med 1998;338:853–60. [DOI] [PubMed] [Google Scholar]
- [3].Nakagawa F, Lodwick RK, Smith CJ, et al. Projected life expectancy of people with HIV according to timing of diagnosis. AIDS 2012;26:335–43. [DOI] [PubMed] [Google Scholar]
- [4].Strategies for Management of Anti-Retroviral Therapy/INSIGHT; DAD Study Groups. Use of nucleoside reverse transcriptase inhibitors and risk of myocardial infarction in HIV-infected patients. AIDS (London, England) 2008;22:F17–24. [DOI] [PMC free article] [PubMed] [Google Scholar]
- [5].Cure S, Bianic F, Espinas C, et al. Systematic literature review and meta-analysis of renal function in human immunodeficiency virus (HIV)-infected patients treated with atazanavir (ATV)-based regimens. PloS One 2015;10:e0124666. [DOI] [PMC free article] [PubMed] [Google Scholar]
- [6].Assarsson E, Lundberg M, Holmquist G, et al. Homogenous 96-plex PEA immunoassay exhibiting high sensitivity, specificity, and excellent scalability. PloS One 2014;9:e95192. [DOI] [PMC free article] [PubMed] [Google Scholar]
- [7].Lundberg M, Eriksson A, Tran B, et al. Homogeneous antibody-based proximity extension assays provide sensitive and specific detection of low-abundant proteins in human blood. Nucleic Acids Res 2011;39:e102. [DOI] [PMC free article] [PubMed] [Google Scholar]
- [8].Price ND, Magis AT, Earls JC, et al. A wellness study of 108 individuals using personal, dense, dynamic data clouds. Nat Biotechnol 2017;35:747–56. [DOI] [PMC free article] [PubMed] [Google Scholar]
- [9].Folkersen L, Fauman E, Sabater-Lleal M, et al. Mapping of 79 loci for 83 plasma protein biomarkers in cardiovascular disease. PLoS Genet 2017;13:e1006706. [DOI] [PMC free article] [PubMed] [Google Scholar]
- [10].Molin CJ, Westerberg E, Punga AR. Profile of upregulated inflammatory proteins in sera of Myasthenia Gravis patients. Sci Rep 2017;7:39716. [DOI] [PMC free article] [PubMed] [Google Scholar]
- [11].Harlid S, Myte R, Van Guelpen B. The metabolic syndrome, inflammation, and colorectal cancer risk: an evaluation of large panels of plasma protein markers using repeated, prediagnostic samples. Mediators Inflamm 2017;2017:4803156. [DOI] [PMC free article] [PubMed] [Google Scholar]
- [12].Haggblom A, Svedhem V, Singh K, et al. Virological failure in patients with HIV-1 subtype C receiving antiretroviral therapy: an analysis of a prospective national cohort in Sweden. Lancet HIV 2016;3:e166–74. [DOI] [PMC free article] [PubMed] [Google Scholar]
- [13].Berggrund M, Ekman D, Gustavsson I, et al. Protein detection using the multiplexed proximity extension assay (PEA) from plasma and vaginal fluid applied to the indicating FTA elute micro card. J Circ Biomark 2016;5:9. [DOI] [PMC free article] [PubMed] [Google Scholar]
- [14].Heberle H, Meirelles GV, da Silva FR, et al. InteractiVenn: a web-based tool for the analysis of sets through Venn diagrams. BMC Bioinformatics 2015;16:169. [DOI] [PMC free article] [PubMed] [Google Scholar]
- [15].Wada NI, Jacobson LP, Margolick JB, et al. The effect of HAART-induced HIV suppression on circulating markers of inflammation and immune activation. AIDS 2015;29:463–71. [DOI] [PMC free article] [PubMed] [Google Scholar]
- [16].DeVico AL, Gallo RC. Control of HIV-1 infection by soluble factors of the immune response. Nat Rev Microbiol 2004;2:401–13. [DOI] [PubMed] [Google Scholar]
- [17].Mendez-Enriquez E, Garcia-Zepeda EA. The multiple faces of CCL13 in immunity and inflammation. Inflammopharmacology 2013;21:397–406. [DOI] [PubMed] [Google Scholar]
- [18].Kim CJ, Rousseau R, Huibner S, et al. Impact of intensified antiretroviral therapy during early HIV infection on gut immunology and inflammatory blood biomarkers. AIDS 2017;31:1529–34. [DOI] [PubMed] [Google Scholar]
- [19].Krebs SJ, Slike BM, Sithinamsuwan P, et al. Sex differences in soluble markers vary before and after the initiation of antiretroviral therapy in chronically HIV-infected individuals. AIDS 2016;30:1533–42. [DOI] [PMC free article] [PubMed] [Google Scholar]
- [20].Borrego F, Masilamani M, Marusina AI, et al. The CD94/NKG2 family of receptors: from molecules and cells to clinical relevance. Immunol Res 2006;35:263–78. [DOI] [PubMed] [Google Scholar]
- [21].Vales-Gomez M, Reyburn HT, Erskine RA, et al. Kinetics and peptide dependency of the binding of the inhibitory NK receptor CD94/NKG2-A and the activating receptor CD94/NKG2-C to HLA-E. EMBO J 1999;18:4250–60. [DOI] [PMC free article] [PubMed] [Google Scholar]
- [22].Andre P, Brunet C, Guia S, et al. Differential regulation of killer cell Ig-like receptors and CD94 lectin-like dimers on NK and T lymphocytes from HIV-1-infected individuals. Eur J Immunol 1999;29:1076–85. [DOI] [PubMed] [Google Scholar]
- [23].Galiani MD, Aguado E, Tarazona R, et al. Expression of killer inhibitory receptors on cytotoxic cells from HIV-1-infected individuals. Clin Exp Immunol 1999;115:472–6. [DOI] [PMC free article] [PubMed] [Google Scholar]
- [24].Mavilio D, Benjamin J, Daucher M, et al. Natural killer cells in HIV-1 infection: dichotomous effects of viremia on inhibitory and activating receptors and their functional correlates. Proc Natl Acad Sci U S A 2003;100:15011–6. [DOI] [PMC free article] [PubMed] [Google Scholar]
- [25].Mela CM, Burton CT, Imami N, et al. Switch from inhibitory to activating NKG2 receptor expression in HIV-1 infection: lack of reversion with highly active antiretroviral therapy. AIDS 2005;19:1761–9. [DOI] [PubMed] [Google Scholar]
- [26].Graham SM, Rajwans N, Tapia KA, et al. A prospective study of endothelial activation biomarkers, including plasma angiopoietin-1 and angiopoietin-2, in Kenyan women initiating antiretroviral therapy. BMC Infect Dis 2013;13:263. [DOI] [PMC free article] [PubMed] [Google Scholar]
- [27].Ye F, Florian M, Magder SA, et al. Regulation of angiopoietin and Tie-2 receptor expression in non-reproductive tissues by estrogen. Steroids 2002;67:305–10. [DOI] [PubMed] [Google Scholar]
Associated Data
This section collects any data citations, data availability statements, or supplementary materials included in this article.


