

Abstract
This study is to investigate the subgingival bacterial diversity and community structure in the Uygur subjects with peri-implantitis.
Totally 40 cases of gingival crevicular fluid were collected from Uygur subjects and divided into the Control group (healthy implants) and Case group (peri-implantitis), respectively. DNA was extracted, and the sequencing in the 16SrRNA V4-V5 region was conducted on the Illumina Miseq sequencing platform. The 16SrRNA gene clone library was constructed and analyzed.
Totally 733,759 valid tags were obtained from these 40 samples. After comparing with the Silva-16S database by the Uparse software, 263 operational taxonomic unit were finally harvested (135 for the Control group and 128 for the Case group). The differential bacteria between these 2 groups at the phylum, class, order, family, and genus levels were Actinobacteria, Actinomycetes, Pasteurellales, Moraxellaceae, and Acinetobacter, respectively. The dominant genera with significantly different distribution between the Control and Case groups included Vibrio, Campylobacter, Granulicatella, Acinetobacter, Micrococcus, and Moraxella. The α diverstiy analysis based on the chao diversity index showed that there was significant difference in the microbiological diversity between these 2 groups. Principal coordinates analysis analysis indicated significant differences in the bacterial community structure between these 2 groups. Cluster analysis showed higher abundance of Micrococcus in the Case group, while higher abundance of Prevotella in the Control group.
There are significant differences in the diversity of subgingival bacteria between the Uygur subjects with healthy implants and peri-implantitis. Moraxella, Micrococcus, and Acinetobacter might represent dominant bacteria genera causing peri-implantitis in the Uygur population.
Keywords: diversity analysis, implants, peri-implantitis, Uygur
1. Introduction
Peri-implantitis is a kind of dysbacteriosis during the process of bacterial re-colonization after implantation, and it reflects the inflammatory response of the host to the implantation treatment and the factors such as cytokines and microbes. Peri-implantitis might lead to loss of osseointegration surrounding the implant, eventually resulting in loose or dislocation of the implant.[1] Ecological bacterial community theory proposes that there is plenty of periodontal pathogens existing in oral saliva in the healthy adults, and the toxicity-releasing opportunistic pathogens in the bacterial community represent the main cause for the host disease. The disease or health status is determined by the counterbalance between the bacterial community and the host.[2] Recent studies have shown that microbes play important roles in the pathogenesis and development of peri-implantitis.[3]
Bacterial adhesion occurs at 30 minutes after implantation, and after 1 to 3 months, the bacterial community composition under the gums would be similar to the natural teeth. The bacteria surrounding the healthy implants mainly include the yellow complex (Streptococcus, Streptococcus oralis, Streptococcus mutans, etc.) and the purple complex (Veillonella parvula and Actinomyces odontolyticus). Gram-negative bacteria account for a relatively small proportion, including the Prevotella intermedia, Porphyromonas gingivalis, Anaerobic bacteria, Prevotella nigrescens, and Campylobacter rectus, indicating that these bacteria are inherent strains in coordination with the host. In the case of peri-implantitis, gram-negative anaerobic bacteria become the main components of the bacterial community.[4] Previous study shows that Staphylococcus aureus would adhere with short time period after implantation, which could last for up to a year. Moreover, 18.6% of the peri-implantitis cases are induced by the gram-negative aerobic bacilli, but most cases are caused by the gram-negative anaerobic bacteria.[5] Variation of bacteria is also related to the changes in the disease process,[6] and the survival status of bacterial community is influenced by a variety of factors.[7] Patients with deep periodontal pocket are associated with higher risk of peri-implantitis.[8] Moreover, the incidence of peri-implantitis in the patients of local tooth loss with periodontitis in residual teeth is higher than the edentulous patients undergoing implantation treatment.[9] Furthermore, structural changes in the implant shape characteristics and oral cavity induced by the physicochemical factors would affect the bacterial community composition.[10] Within the multiple factors affecting the bacterial colonization in peri-implantitis, the oral microbial diversity varies in different races, and the racial factors could influence the bacterial community composition in a certain degree.[11]
Xinjiang, China, a typical region with multiple ethnic groups, is characterized by various religious beliefs and different eating habits. Uyghur population accounts for a considerable proportion in the local minority. A previous study shows that Uygur is the descendants of the Turks, with genetic characteristics from both the Caucasian race and the Oriental Mongolian race. At present, the studies concerning the peri-implantitis mainly focus on the Caucasian race worldwide, and in China, most attention has been paid onto the Han people (belong to the Mongolian population). Therefore, herein, the Uygur population with certainly genetic specificity was studied, and the bacterial diversity surrounding the implants under healthy and disease conditions in these people was investigated. The 16S rRNA gene cloning library was amplified and constructed with PCR, and the subgingival microbial bacterial community was sequenced for the healthy implants and implants with peri-implantitis.[12] The differences in the composition of the subgingival microbial bacterial community in the Uygur population were analyzed.
2. Materials and methods
2.1. Study subjects
The samples were provided by the Plantation Center of the Urumqi Stomatological Hospital, China, and other 3 clinics (one of which was the Aizezi Oral Clinic). Totally 50 samples of gingival crevicular fluid were obtained the Uyghur subjects with healthy implants or peri-implantitis, including 40 samples for formal test and 10 samples for backup. Inclusion criteria were as follows: All samples were from the Uygur patients who underwent dental implantation treatment from 2013 to 2016; patients with at least 1 dental implant for more than half a year; according to the Guideline of Periodontology, peri-implantitis was defined as bleeding of probing (BOP) and/or periodontal pocket depth (PPD) (≥ 4 mm), accompanied with bone tissue loss under the first thread of the implant (i.e., bone absorption ≥ 2 mm).[13] These samples were divided into the Control group (healthy implant; n = 20) and the Case group (peri-implantitis; n = 20). Exclusion criteria were as follows: patients with the systematic diseases; patients receiving periodontal therapy within 6 months; taking immunosuppressive agents or antibiotics; long-term use of contraceptive drugs; pregnant women; and smokers. Prior written and informed consent were obtained from every patient and the study was approved by the local ethics review board.
2.2. Sample collection
After gargling, the sampling site was wiped with disinfectant cotton balls, and the sterile moisture absorption paper (cutting off the sharp tip) was used to insert into the gingival sulcus. There were totally six inserting sites for each implant, that is, the proximal, middle, and distal points of both the buccal and tongue (palate) sides. After 30 seconds, the paper tip with the gingival crevicular fluid was pulled out, and the sample was stored at –80°C.
2.3. PCR amplification and 16S rRNA cloning library construction
Genomic DNA was extracted from the samples by the DNA extraction kit. An appropriate amount of sample was collected in a centrifugation tube and diluted with sterile water to the final concentration of 1 ng/μL. Using these DNA templates, based on the sequencing region, PCR was performed on the real-time PCR machine (Bio-Rad, Hercules, CA), with the Barcode specific primers, and the HiFi Hot Start Ready Mix (KAPA, Woburn, MA). Bacterial diversity identification corresponding regions included the 16S V3-V4 regions (primers 343F and 798R). After electrophoresis, the PCR products were purified with the magnetic beads, which were then used as the template in the second round of PCR amplification. After purification, the PCR products were quantified with the Qubit dsDNA Assay Kit (Life Technologies, Grand Island, NY), followed by the sequencing.
For the construction of the 16S rRNA gene cloning library, PCR products were purified with the magnetic beads. The first-round purified PCR products (5 μL) were subjected to the agarose gel electrophoresis, and 1 μL purified products were subjected to the Nano concentration test.
2.4. Bioinformatics analysis
Raw data was obtained by the Illumina Miseq sequencing, and the Trimmomatic was used to remove the irrelevant materials and stitch the original double-ended sequencing data. Thereafter, the low-quality and fuzzy base sequence was further removed, to obtain the clean tags sequence. The chimera sequences in the clean tags sequence were detected and removed by the Usearch, to gain the high-quality valid tags. Based on the sequence similarity, the sequence was classified into multiple operational taxonomic unit (OTU) with the UPARSE software, in which sequences with the similarity of no less than 97% was considered as an OTU unit. The QIIME software was used to select the representative sequences from each OUT, which were subjected to the comparison and annotation of the HOMD database. The comparison and annotation of species were performed with the RDP classifier software, and the results with confidence interval greater than 0.7 were retained.
2.5. Statistical analysis
Statistical analysis of multivariate variables was performed. Based on the different needs for grouping, species with obvious differences were selected, and biomarkers for different treatments or different environments were found. The ANOVA was used for the analysis of the OTU abundance at different levels. Multiple variance analysis of the distance matrix was conducted with the Adonis comparative analysis between groups.
3. Results
3.1. Basic characteristics of study subjects
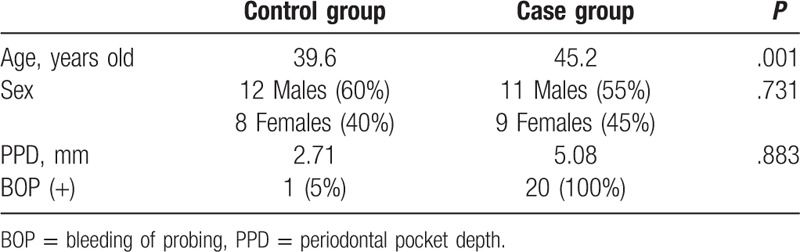
The basic information and characteristics of the study subjects were shown in Table 1. There were totally 40 subjects, 23 males (57.5%) and 17 females (42.5%), with the average age of 42.4 years old, were included in this study. These subjected were divided into the Control and Case groups. The average age for the Control group was 39.6 year old, while the average age for the Case group was 45.2 years old, with no significant difference between these 2 groups. For the ratio of males to females, males accounted for 60% (12/20) in the Control group, while the females accounted for 55% (11/20) in the Case group (P > .05). Importantly, significant differences were observed in PPD between the Control (2.71 mm) and Case (5.08 mm) groups (P < .01), as well as in BOP between the Control (5%) and Case (100%) groups (P < .05). These results suggest that, there is no difference in age and sex between the 2 groups, while there are significant differences in PPD and BOP in the Control group (Uygur subjects with healthy implants) and the Case group (Uygur subjects with peri-implantitis).
Table 1.
Basic characteristics and clinical indicators of study subjects.
3.2. OTU classification
From the high-quality sequences, 2 groups of OTU with the largest abundance were obtained: the chimeric sequences in the clean tags were detected and removed with the Usearch software, and totally 733,759 valid tags with better quality were left (343,675 and 390,084 valid tags for the Control and Case groups, respectively). Then the OUT classification was performed on all the high-quality sequences by the Uparse software, with the 97% similarity, and the sequences with the largest abundance within OTU were selected as the representative sequences to be compared with the Silva-16S database. Our results showed that there were totally 263 OTU, that is, 135 and 128 OTU for the Control and Case groups, respectively (Fig. 1). Based on the data from the OUT classification, the sample dilution curves were plotted. Our results showed that, along with the increasing sequence samples, there was no obvious changes in the OTU numbers, with the relatively plat curve, indicating the reasonable amount of sequencing data (Fig. 2).
Figure 1.
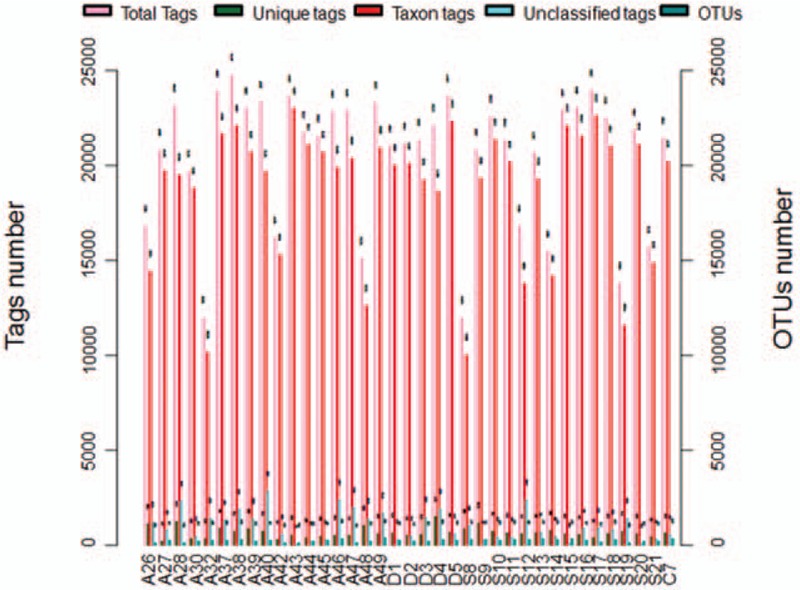
OTU clustering and annotations for each sample. Total Tags indicated the total number of Tags in each sample (i.e., the effective Tags in the OTU clustering analysis). Unique Tags indicated the number of Tags with the frequency of 1, which could not be clustered into the OTUs. Taxon Tags indicated the number of Tags for the OTUs construction, with annotations. Unclassified Tags indicated the number of Tags without annotations. OTU = operational taxonomic unit.
Figure 2.
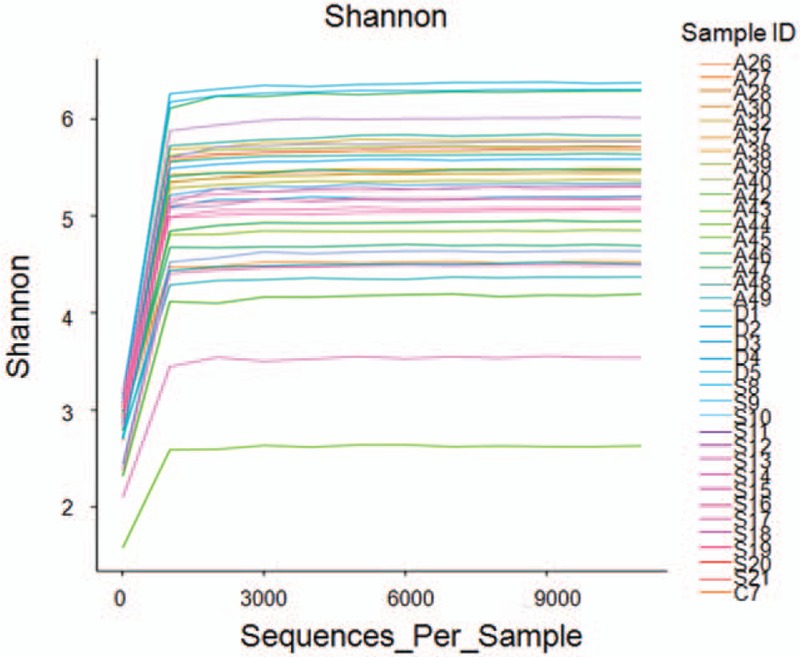
OTU/diversity dilution curves. Abscissa represented the random sampling depth (i.e., the number of sampled sequences), and ordinate represented the corresponding diversity index value (i.e., the OTU value). OTU = operational taxonomic unit.
3.3. Analysis of differences in species abundance
Differences in species abundance were analyzed between these 2 groups, based on the OTU classification: at the phylum level, Actinobacteria were more abundant in the Case group (11.404%) than the Control group (6.544%); at the class level, Actinomycetes were more abundant in the Case group (10.675%) than the Control group (5.4996%); at the order level, Pasteurellales were less abundant in the Case group (3.202%) than the Control group (10.674%); at the family level, Moraxellaceae were more abundant in the Case group (9.826%) than the Control group (0.039%); at the genus level, Acinetobacter were more abundant in the Case group (6.913%) than the Control group (0.038%) (Fig. 3).
Figure 3.
Bacterial community structure distribution. Differences in the bacterial community structure distribution between the Control and Case groups were shown at the phylum, class, order, family, and genus levels, respectively.
3.4. Dominant genus analysis
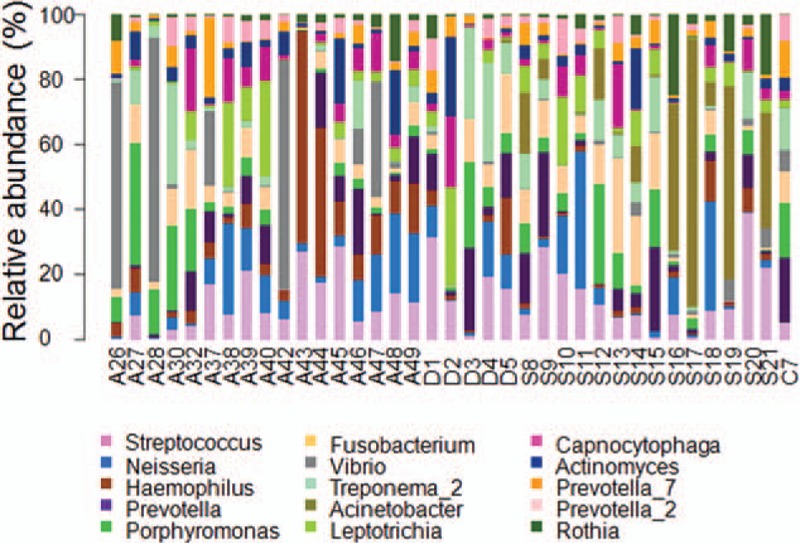
The dominant genera were then analyzed in the Control and Case groups, respectively. Our results showed that, for the Control group, the dominant genera (> 1%) included Neisseria (8.853%), Haemophilus (8.576%), Prevotella (8.457%), Streptococcus (7.475%), Vibrio (7.144%), Porphyromonas (4.252%), Fusobacterium (3.600%), Capnocytophaga (3.571%), Leptotrichia (3.378%), Actinomyces (2.88%), Treponema (2.708%), Actinomyces (1.765%), Campylobacter (1.468%), Rothia (1.430%), and Granulicatella (1.001%) (Fig. 4). On the other hand, for the Case group, the dominant genera (> 1%) included Prevotella (9.702%), Streptococcus (8.007%), Acinetobacter (6.913%), Fusobacterium (5.457%), Neisseria (5.363%), Porphyromonas (4.803%), Treponema (4.782%), Leptothrix (3.718%), Capnocytophaga (3.025%), Micrococcus (3.023%), Rothia (2.306%), Moraxella (2.162%), Haemophilus (2.034%), Actinomyces (1.973%), and Actinomyces (1.115%) (Fig. 4). Taken together, these results suggest that the dominant genera with significantly different distribution between the Control and Case groups included Vibrio, Campylobacter, Granulicatella, Acinetobacter, Micrococcus, and Moraxella.
Figure 4.
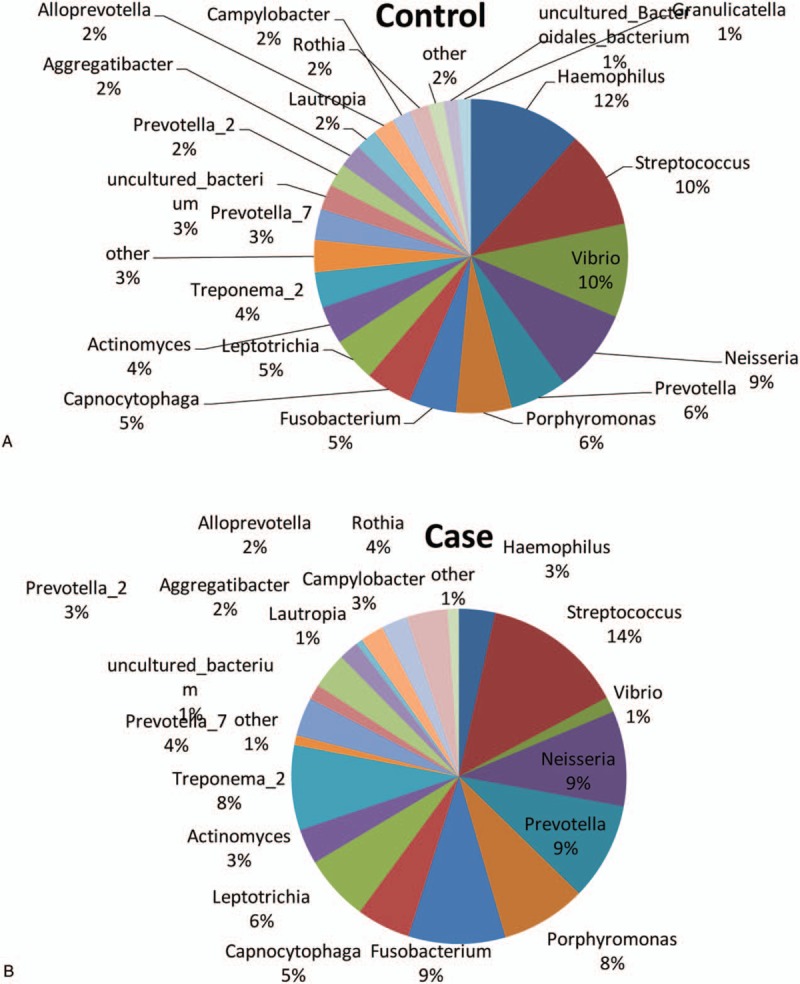
Distribution of dominant genera in Uygur subjects. Distribution of dominant genera in Uygur subjects with healthy implants (A) and peri-implantitis (B), respectively.
3.5. The α diversity analysis
The differences in the microbiological diversity between these 2 groups were analyzed with the α diversity analysis. Based on the corresponding results, the diversity index Boxplot were obtained (Fig. 5). According to the chao diversity index of the sample distribution, our results showed that there was significant difference in the microbiological diversity between the Control group (group 3) and the Case group (group 4).
Figure 5.
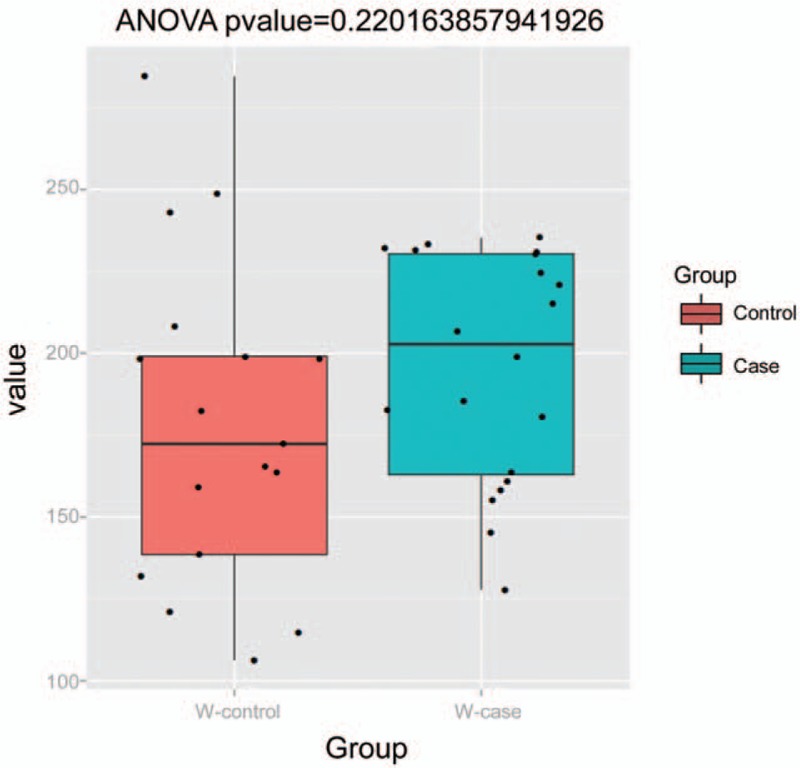
Boxplot for comparison of diversity indice between groups.
3.6. Principal coordinates (PCoA) analysis
The differences in the bacterial community between the Control and Case groups were analyzed with the PCoA analysis. Our results showed that, when the major factor PC1 and minor factor PC2 were compared, the contribution of PC1 was 17.67%, while the contribution of PC2 was 210.14% (Fig. 6). These results suggest that there were significant differences in the bacterial community structure between these 2 groups.
Figure 6.
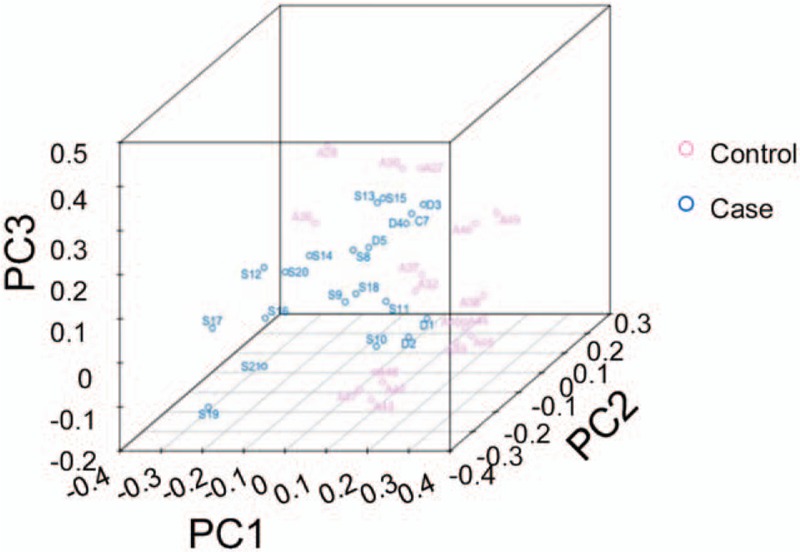
PCoA analysis for the differences in microbial communities (3D). PCoA = principal coordinates analysis.
3.7. Cluster analysis
Genera with the relatively high abundance in these 2 groups were investigated with the cluster analysis. Based on the clustering results of the samples at the genus level, the Heatmap plot was obtained. Analysis results showed that the abundance of Micrococcus in the Case group was significantly higher than the Control group, while the abundance of Prevotella in the Control group was significantly higher than the Case group (Fig. 7).
Figure 7.
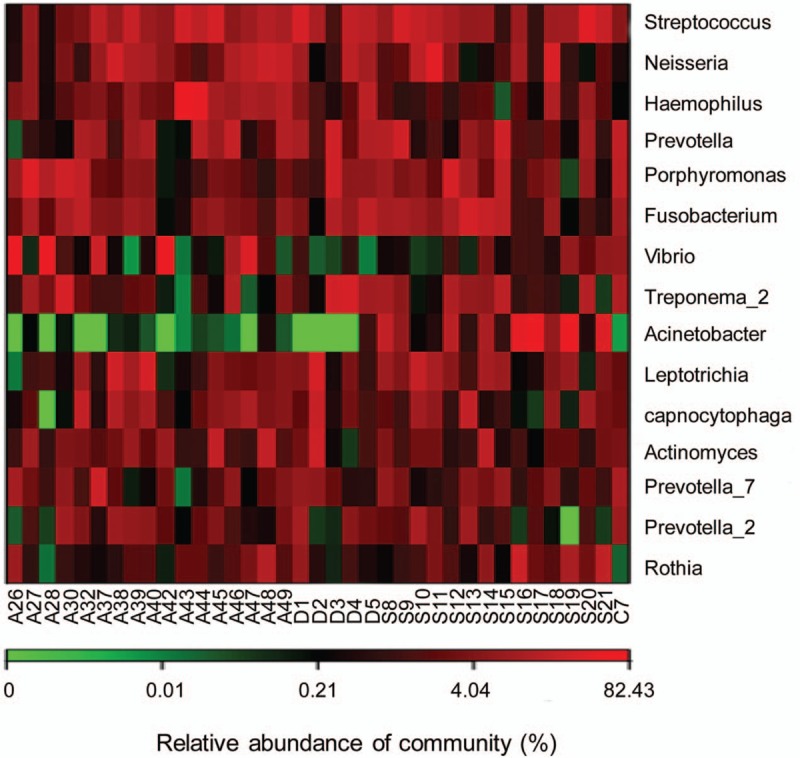
eatmap analysis based on the relative abundance.
4. Discussion
In the present study, totally 733,759 high-quality sequences were obtained, leading to finally 263 OTU, indicating satisfactory sequencing depth. The flat dilution curve indicated good coverage of sequencing. Analysis of species abundance suggested different distribution at the phylum, class, order, family, and genus levels, involving Actinobacteria, Actinomycetes, Pasteurellales, Moraxellaceae, and Acinetobacter, which was not in line with the previous findings. This phenomenon would be due to the different study subjects, sample size, and experimental setups, and further in-depth study is still needed to address this issue. Moreover, the α diversity analysis showed that there were significant differences in the microbial diversity between the 2 groups. These findings are in line with the results from Koyanagi et al[12] showing the bacterial community composition in the biofilm in the peri-implantitis is more complex, compared with the healthy perinatal tissue and periodontitis. Furthermore, PCoA analysis showed that significantly different bacterial community structure between these 2 groups. In addition, the cluster analysis showed that the abundance Prevotella in the healthy implants was significantly higher, which was consistent with the fact that gram-negative bacteria (Prevotella intermedia) accounted for less proportion in the healthy implants.[14]
In the present study, our results showed that the main dominant species in Uygur subjects with healthy implants included Neisseria, Haemophilus, Prevotella, Streptococcus, Porphyromonas, Clostridium, Capnocytophaga, Leptothrix, Actinomycetes, and Actinomyces, which were in line with previous findings indicating the yellow complex and purple complex genera in the healthy implants.[15] Moreover, it was also consistent with the observation that there are more gram-positive coccus while relatively less anaerobe and facultative anaerobe on the surface of healthy implants.[16] Our results showed that, Hemophilus and Capnocytophaga could also be detected in the gingival crevicular fluid from the Uyghur subjects with peri-implantitis, both of which were rarely seen in previous reports. These results suggest that these genera might be specific for Uyghur, which, of course, needs further in-depth investigation. On the other hand, there were plenty of gram-negative anaerobic bacilli,[17] as well as gram-positive anaerobic cocci (such as Peptostreptococcus and Parvimonas),[18] on the surface of the implants of peri-implantitis. Neilands et al[1] have shown that Prevotella, Porphyromonas, and Tanner sp. frequently existed in the peri-implantitis, and bacilli and helicoids might show up, which further develop to the gram-negative anaerobic bacteria in the bacterial community.[6] Previously reported Streptococcus, Treponema, Neisseria, and Porphyromonas in the subgingival plaque of peri-implantitis [19] were also found herein as the dominant genera in the Case group. However, other dominant genera such as Moraxella, Micrococcus, and Acinetobacter found in our results had been rarely seen in the previous studies. Cluster analysis showed that the abundance of Micrococcus in the Case group was significantly higher than the Control group. Acinetobacter is gram-negative bacteria and conditional pathogen present in the human skin, respiratory tract, digestive tract, and genitourinary tract. Acinetobacter has been usually reported in the respiratory infections, which is less seen in the peri-implantitis. Micrococcus is gram-positive cocci, which is parasitic pathogen in the human skin and pharynx, commonly seen in wound infection and other diseases in clinic. Moraxella is gram-negative bacteria, which has been reported in dental caries in children. The above 3 strains have almost never been reported in the studies concerning the peri-implantitis until this study. However, further in-depth studies are still needed to investigate whether they represent the specific bacterial genera in the gingival crevicular fluid of Uyghur subjects with peri-implantitis, and whether they play important roles in the disease pathogenesis and development.
There are also limitations about this study. Although the microbial communities in the Uygur subjects with health implants or peri-implantitis have been analyzed and compared, contributing to the preliminary understanding of the microbial structural characteristics of Uygur subjects, these 40 samples could not completely represent the microbial ecology of the entire Uygur population. Of course, further in-depth studies with enlarged sample sizes are still needed to obtain more accurate and comprehensive findings.
In conclusion, our results showed that there were significant differences in the diversity of subgingival bacteria between the Uygur subjects with healthy implants and peri-implantitis. Moreover, Moraxella, Micrococcus, and Acinetobacter might represent dominant bacteria genera causing peri-implantitis in the Uygur population. These findings might contribute to the understanding of disease mechanism and the disease treatment in clinic.
Footnotes
Abbreviations: BOP = bleeding of probing, OUT = operational taxonomic unit, PCoA = principal coordinates analysis, PPD = periodontal pocket depth.
This work was supported by National Natural Science Foundation of China (no. 81570983).
The authors have no conflicts of interest to disclose.
References
- [1].Neilands J, Wickstrom C, Kinnby B, et al. Bacterial profiles and proteolytic activity in peri-implantitis versus healthy sites. Anaerobe 2015;35(pt A):28–34. [DOI] [PubMed] [Google Scholar]
- [2].Belibasakis GN. Microbiological and immuno-pathological aspects of peri-implant diseases. Arch Oral Biol 2014;59:66–72. [DOI] [PubMed] [Google Scholar]
- [3].Burgers R, Witecy C, Hahnel S, et al. The effect of various topical peri-implantitis antiseptics on Staphylococcus epidermidis, Candida albicans, and Streptococcus sanguinis. Arch Oral Biol 2012;57:940–7. [DOI] [PubMed] [Google Scholar]
- [4].Mombelli A, Decaillet F. The characteristics of biofilms in peri-implant disease. J Clin Periodontol 2011;38(suppl 11):203–13. [DOI] [PubMed] [Google Scholar]
- [5].Charalampakis G, Leonhardt A, Rabe P, et al. Clinical and microbiological characteristics of peri-implantitis cases: a retrospective multicentre study. Clin Oral Implants Res 2012;23:1045–54. [DOI] [PubMed] [Google Scholar]
- [6].Charalampakis G, Abrahamsson I, Carcuac O, et al. Microbiota in experimental periodontitis and peri-implantitis in dogs. Clin Oral Implants Res 2014;25:1094–8. [DOI] [PubMed] [Google Scholar]
- [7].Perez-Chaparro PJ, Duarte PM, Shibli JA, et al. The current weight of evidence of the microbiologic profile associated with peri-implantitis: a systematic review. J Periodontol 2016;87:1295–304. [DOI] [PubMed] [Google Scholar]
- [8].Costa FO, Takenaka-Martinez S, Cota LO, et al. Peri-implant disease in subjects with and without preventive maintenance: a 5-year follow-up. J Clin Periodontol 2012;39:173–81. [DOI] [PubMed] [Google Scholar]
- [9].Waal YC, Winkel EG, Meijer HJ. Differences in peri-implant microbacterial community between fully and partially edentulous subjects: a systematic review. J Periodontol 2013;10:1902–21. [DOI] [PubMed] [Google Scholar]
- [10].Carcuac O, Abrahamsson I, Albouy JP, et al. Experimental periodontitis and peri-implantitis in dogs. Clin Oral Implants Res 2013;24:363–71. [DOI] [PubMed] [Google Scholar]
- [11].Mason MR, Nagaraja HN, Camerlengo T, et al. Deep sequencing identifies ethnicity-specific bacterial signatures in the oral microbiome. PLoS One 2013;8:e77287. [DOI] [PMC free article] [PubMed] [Google Scholar]
- [12].Koyanagi T, Sakamoto M, Takeuchi Y, et al. Analysis of microbiota associated with peri-implantitis using 16S rRNA gene clone library. J Oral Microbiol 2010;2:1–7. [DOI] [PMC free article] [PubMed] [Google Scholar]
- [13].Leeman MF, Curran S, Murray GI. The structure, regulation, and function of human matrix metalloproteinase-13. Crit Rev Biochem Mol Biol 2002;37:149–66. [DOI] [PubMed] [Google Scholar]
- [14].Rakic M, Grusovin MG, Canullo L. The microbiologic profile associated with peri-implantitis in humans: a systematic review. Int J Oral Maxillofac Implants 2016;31:359–68. [DOI] [PubMed] [Google Scholar]
- [15].Lafaurie GI, Sabogal MA, Castillo DM, et al. Microbiome and microbial biofilm profiles of peri-implantitis: a systematic review. J Periodontol 2017;88:1066–89. [DOI] [PubMed] [Google Scholar]
- [16].de Waal YC, Eijsbouts HV, Winkel EG, et al. Microbial characteristics of peri-implantitis: a case-control study. J Periodontol 2017;88:209–17. [DOI] [PubMed] [Google Scholar]
- [17].Padial-Molina M, Lopez-Martinez J, O’Valle F, et al. Microbial profiles and detection techniques in peri-implant diseases: a systematic review. J Oral Maxillofac Res 2016;7:e10. [DOI] [PMC free article] [PubMed] [Google Scholar]
- [18].Koyanagi T, Sakamoto M, Takeuchi Y, et al. Comprehensive microbiological findings in peri-implantitis and periodontitis. J Clin Periodontol 2013;40:218–26. [DOI] [PubMed] [Google Scholar]
- [19].Li ZJ, Wang SG. High-throughput sequencing study on microbial diversity of subgingival infections in peri-implantitis. J Sichuan Univ (Medical Science Edition) 2015;46:568–72. [PubMed] [Google Scholar]