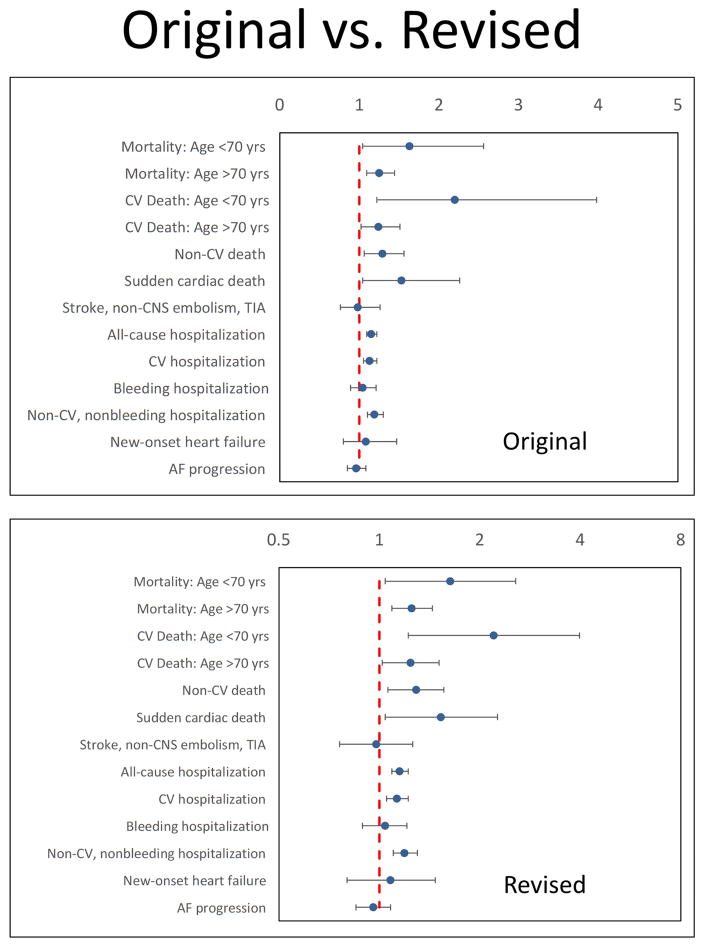
We read the recent article by Echouffo-Tcheugui et al (1) with interest. There is, however, an important statistical problem in the main figure (Central Illustration) in the article. The choice of scale for the X-axis is inappropriate. The effect parameter (in fact a hazard ratio, but is labeled as “RR”) is not symmetric around the null value of 1. The authors start the X-axis with a value of 0, which corresponds to an infinitely protective effect. Along the current axis, values of 0 and 2 lie equidistant from the null, and yet RR=0 is infinitely larger than RR=2. Indeed, if a binary exposure yielding RR=2 were re-coded, it would produce RR=0.5, demonstrating that these two numbers actually have the same magnitude (2,3).
Statisticians recommend one of the following two options to better communicate estimated effects: a) Plot the log of the RR, so that the plotted values are symmetric around the null of 0, or b) Plot the untransformed RR, but on a natural log so that the numbers will be arrayed asymmetrically around the null value of 1 (e.g., 2 and 0.5=1/2 would be equidistant from 1). These options are readily managed in most statistical software packages, and the second option seems the most common in the biomedical literature. A comparison of these representations can be seen in Figure 1 (1).
Figure 1. Original vs. Revised Figures.
We recreated the original figure and created a revised version of the same figure with correct scale for the ratios. For example, the ratios of 0.5(=1/2) and 2 are symmetric around the null value of 1 in the revised figure. See Echouffo-Tcheugui, J.B. et al. J Am Coll Cardiol. 2017;70(11):1325–35 for more details.
Our recommendation applies equally to all popular ratio scale measures, including the odds ratio, risk ratio, rate ratio and hazard ratio. Additive contrasts such as the risk difference should remain on the linear scale (2,3). Although this may seem a minor issue in this specific example, it is important for making the graphed results independent of arbitrary coding decisions. For example, there is no objective reason why women should be coded 1 and men 0, or vice versa. And yet on the additive scale, the effect of sex could appear dramatically larger or smaller based on this arbitrary choice. The logarithmic scale resolves this problem, which is exactly why it is the standard approach in many biomedical publications.
Acknowledgments
Funding: H.B. was partly supported by the National Institutes of Health through grants UL1 TR001860. The funders had no role in the design and conduct of the study; collection, management, analysis, and interpretation of the data; preparation, review, or approval of the manuscript; and decision to submit the manuscript for publication. The interpretation and reporting of the data are the responsibility of the authors and in no way should be seen as an official policy or interpretation of the US government.
Footnotes
Conflict of Interest: None.
Publisher's Disclaimer: This is a PDF file of an unedited manuscript that has been accepted for publication. As a service to our customers we are providing this early version of the manuscript. The manuscript will undergo copyediting, typesetting, and review of the resulting proof before it is published in its final citable form. Please note that during the production process errors may be discovered which could affect the content, and all legal disclaimers that apply to the journal pertain.
References
- 1.Echouffo-Tcheugui JB, et al. Care patterns and outcomes in atrial fibrillation patients with and without diabetes ORBIT-AF registry. JACC. 2017;70(11):1325–35. doi: 10.1016/j.jacc.2017.07.755. [DOI] [PubMed] [Google Scholar]
- 2.Hosseinpoor AR. Graphical presentation of relative measures of association. Lancet. 2010;375:1254. doi: 10.1016/S0140-6736(10)60541-7. [DOI] [PubMed] [Google Scholar]
- 3.Levine MAH, et al. Relative risk and odds ratio data are still portrayed with inappropriate scales in the medical literature. J Clin Epidemiol. 2010;63:1045–7. doi: 10.1016/j.jclinepi.2009.12.016. [DOI] [PubMed] [Google Scholar]


