

Abstract
Introduction
Placental insufficiency, arising from abnormal trophoblast differentiation and function, is a major cause of fetal growth restriction. Sirtuin-1 (Sirt1) is a ubiquitously-expressed NAD-dependent protein deacetylase which plays a key role in numerous cellular processes, including cellular differentiation and metabolism. Though Sirt1 has been widely studied, its role in placentation and trophoblast differentiation is unclear.
Method
Sirt1-heterozygous mice were mated and evaluated at various points during embryogenesis. In situ hybridization and immunohistochemistry were used to further characterize the placental phenotype of Sirt1-null mice. Wild-type (WT) and Sirt1-null mouse trophoblast stem cell (TSC) lines were derived from e3.5 littermate blastocysts. These cells were then evaluated at various points following differentiation.
Differentiation was evaluated by expression of lineage specific markers using qPCR and flow cytometry, as well as Matrigel invasion assays. Global gene expression changes were evaluated using microarray-based RNA profiling; changes in specific pathways were validated using qPCR and western blot.
Results
In the absence of Sirt1, both embryos and placentas were small, with placentas showing abnormalities in both the labyrinthine layer and junctional zone. Sirt1-null TSCs exhibited an altered phenotype in both undifferentiated and differentiated states, phenotypes which corresponded to changes in pathways relevant to both TSC maintenance and differentiation. Specifically, Sirt1-null TSC showed blunted differentiation, and appeared to be suspended in an Epcamhigh trophoblast progenitor state.
Discussion
Our results suggest that Sirt1 is required for proper TSC differentiation and placental development.
Keywords: Trophoblast, Stem cells, Placenta, Differentiation, Fetal development, Fetal growth restriction
Introduction
The placenta is a transient fetal-derived organ crucial for a healthy pregnancy and proper fetal development [1]. During pregnancy, this organ participates in implantation and establishment of the maternal-fetal interface, as well as gas and nutrient exchange to facilitate fetal growth and development [1,2]. Placental dysfunction can affect both maternal and fetal well-being, leading to complications such as preeclampsia, a maternal syndrome of hypertension and proteinuria, often associated with induced preterm delivery and fetal growth restriction [3]. Abnormal differentiation and function of trophoblast, the epithelial component of the placenta, are major underlying factors in pathophysiology of these pregnancy complications. Thus, identification of pathways which regulate these processes can contribute to development of potential targeted therapies for these disorders.
Sirtuin1 (Sirt1) is a ubiquitously-expressed nutrient sensor and NAD+-dependent protein deacetylase [4, 5] implicated in many cellular processes, including stem/progenitor cell maintenance and differentiation [6–10]. Mammalian Sirt1 targets not only histones, but also numerous other proteins, including a large array of transcription factors [5, 9, 11], and has thus been implicated in numerous diseases such as cancer, diabetes, and obesity [12]. Absence of Sirt1 during embryogenesis in mice results in multiple developmental defects, with phenotypes ranging from embryonic lethality to postnatal lethality, depending on the genetic background. Interesting, in all of these models, Sirt1-null embryos were consistently growth-restricted [13–15]; nevertheless, it is not yet known whether this embryonic phenotype is associated with a defect in placental development or trophoblast differentiation. In fact, while it is known that Sirt1 is expressed in trophoblast [16] and that its expression is reduced following labor [17], little else is known about the role of Sirt1 in the placenta and trophoblast. We set out to evaluate the role of Sirt1 during placental development, with a focus on the trophoblast compartment using the mouse model.
Materials and Methods
Animals
All mouse work was approved by the UCSD Animal Care and Use Committee. Sirt1 heterozygous mice on the 129/Sv background were obtained from Dr. Michael McBurney (Ottawa Health Research Institute) [13]. Timed matings were performed, with day of plug identification designated as E0.5. Embryos and placentas were weighed prior to further processing. Previously published primers were used for genotyping [13].
Histology, immunohistochemistry, and in situ hybridization
Immunohistochemistry (IHC) and in situ hybridization (ISH) were performed on the Ventana Discovery Ultra automated immunostainer with standard antigen retrieval and reagents per manufacturer’s protocol. Hematoxylin and Eosin (H&E) staining was performed as per standard protocol. Sirt1 antibody used for IHC is listed in Supplementary Methods; the antibody was validated against Sirt1-null placental tissues (see Fig. S1C–D). ISH was performed using the RNAscope methodology [18] with probes specific to mouse Ctsq, Epcam, Gcm1, Prl2c2, SynA and Tpbpa, purchased from ACD-Bio. A negative control probe (DapB, also from ACD-Bio) was also run on E13.5 placental tissues (see Fig. S1F). Both antibody staining and ISH probes were visualized with 3,3′-diaminobenzidine (DAB) and slides counterstained with hematoxylin (Dako). All slides were analyzed by conventional light microscopy on an Olympus B×43 microscope (Olympus). Tpbpa ISH was used to calculate the area of the junctional zone and was normalized to the total area of the placenta as determined by a pan-keratin IHC (not shown).
Cell culture and cell-based assays
Two wild-type/WT and two Sirt1-null mouse TSC lines were derived from E3.5 littermate blastocysts as previously described [19]. Cells were cultured in standard TSC growth media [20] supplemented with 25ng/ml fibroblast growth factor (FGF4; Sigma, F8424), 10ng/ml Activin A (Stemgent, 03-001) and 1μg/ml Heparin (Sigma, H3149). To induce trophoblast differentiation, FGF4, Activin A and Heparin were removed. All results were confirmed in both sets of WT and Sirt1-null TSC lines.
For details of generation of Sirt1-knockdown cell lines, Matrigel invasion assays, flow cytometric-based assays, and western blot, please see Supplementary Methods.
RNA isolation, quantitative real-time PCR (qRT-PCR), and microarray-based gene expression profiling
Total RNA was isolated using the MirVana RNA isolation kit (Ambion, AM1561) according to manufacturer’s protocol. All RNA concentrations were measured using Qubit (Life Technologies) and RNA integrity was evaluated using Agilent 2100 Bioanalyzer (Agilent). Quantitative real-time PCR was performed as previously described [21], using primers listed in Supplementary Methods.
RNA samples were subjected to microarray-based RNA profiling as detailed in Supplementary Methods. The data were filtered for detection (p-value < 0.01) and normalized using Robust Spline Normalization with the lumi package in R [22]. Principle component analysis (PCA) was performed using the Qlucore Omics Explorer (Lund, Sweden). We used Affinity Propagation algorithm [23] implemented in R [24] to identify clusters of co-expressed transcripts. Details of comparative group analysis and analysis using the AP algorithm can be found in Supplementary Methods. The list of probes in each cluster were subjected to gene ontology analysis using the Metascape web application (http://metascape.org, last accessed April 4, 2017) and signaling pathway analysis using Qiagen’s Ingenuity Pathway analysis (IPA; Qiagen).
Microarray data of wild-type and Sirt1-null TS differentiation timecourses were submitted to the Gene Expression Ombius repository (https://www.ncbi.nlm.nih.gov/) with the accession number GSE100279.
Statistical analysis
Results
Sirt1 is expressed in trophoblast cells, both in vivo and in vitro
Immunostaining confirmed that Sirt1 is expressed in the nuclei of trophoblast in all layers of the placenta (Fig. 1A). However, compared to the junctional zone, labyrinthine trophoblast more uniformly expressed Sirt1. Sirt1-null placentae did not show any staining with this antibody (Fig. S1C–D). In wild-type TSCs, both Sirt1 RNA (not shown) and protein were uniformly expressed in undifferentiated and differentiated trophoblast (Fig. 1B).
Figure 1.
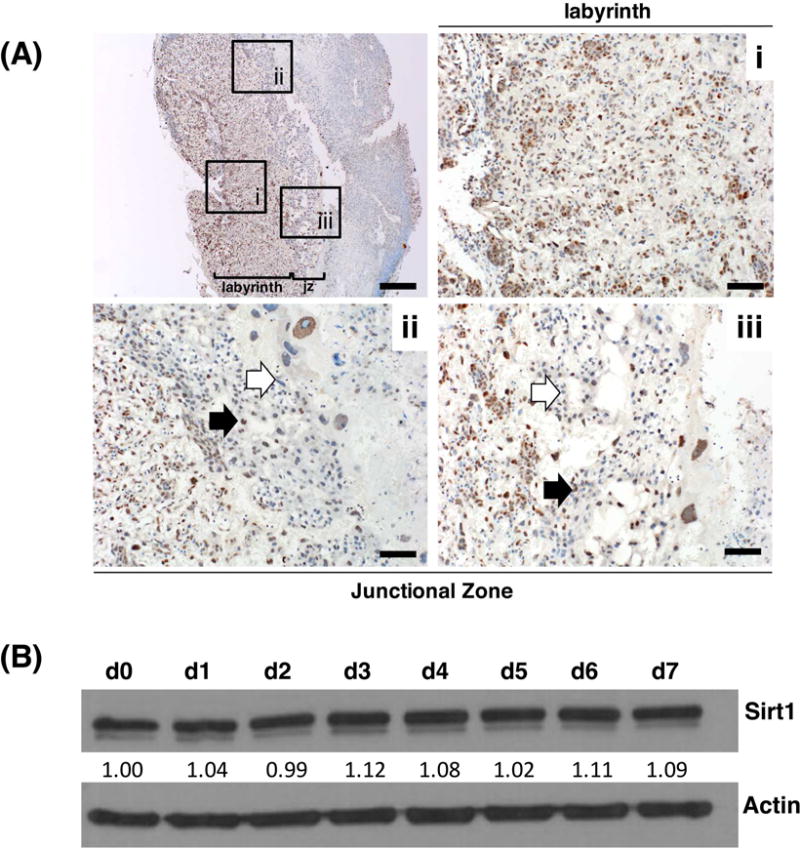
Sirt1 is expressed in mouse placenta and trophoblast. (A) Sirt1 expression in E13.5 mouse placentas by immunohistochemistry, with low power image at top left, and higher power images showing (i) labyrinth, (ii) and (iii) junctional zone. Bar is 500 μm (top left) and 100 μm for (i) through (iii). Black and white block arrows mark Sirt1 positive and negative cells, respectively; jz represents the junctional zone. (B) Western blot for Sirt1 in undifferentiated (d0) and differentiated (d1 through d7) wild-type TSCs cultured in vitro. Values below the Sirt1 blot show the relative amount of the protein, normalized against actin and d0.
Sirt1-null placentas are small and show morphologic defects
Matings of heterozygous Sirt1 mice resulted in embryonic lethality, with only resorbing Sirt1-null embryos observed after E13.5 (Fig. 2A). At E13.5, both embryos and placentas were small, with a 39% and 16% decrease in weight, respectively, compared to their WT littermates (Fig. 2B). H&E evaluation of the placentas demonstrated a thickened chorion and a more hypercellular labyrinth in Sirt1-null placentas (Fig. 2C). In-situ hybridization (ISH) for labyrinthine markers Gcm1, SynA, and Ctsq, as well as giant cell marker Prl2c, did not show significant differences in wild-type and Sirt1-null E13.5 placentas (data not shown). ISH for the spongiotrophoblast marker, Tpbpa, however, did show a reduction in this layer in the Sirt1-null placentas (Figure 2D).
Figure 2.
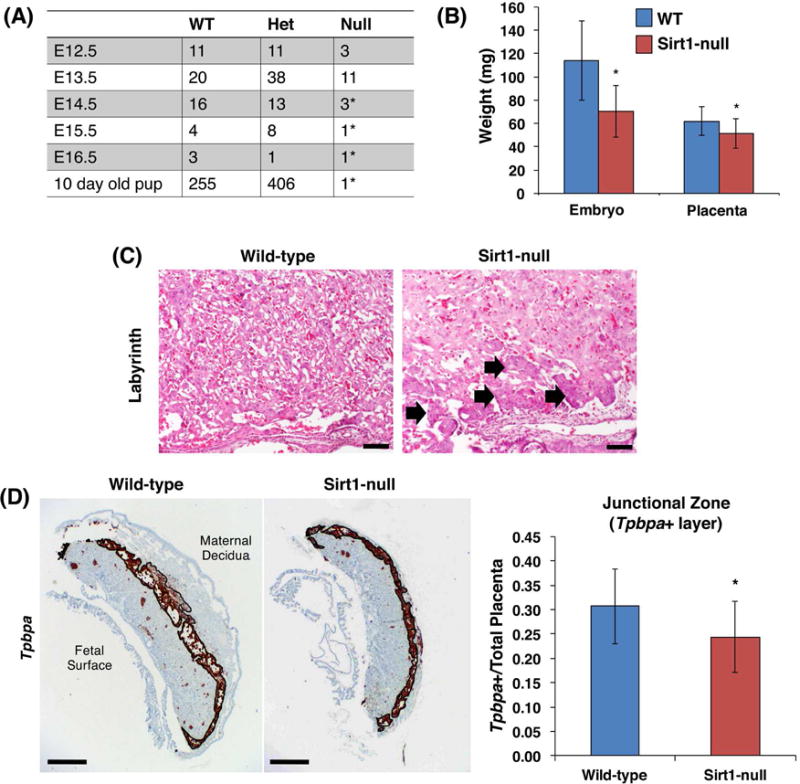
Absence of Sirt1 causes embryonic lethality at E13.5, with small and altered placenta. (A) Observed numbers of wild-type (WT), heterozygous (Het), and Sirt1-null (Null) embryos/pups from heterozygous matings of mice on a Sv129 background. *Indicates resorbing embryos, or pup which died soon after birth. (B) WT and null embryos and placentas were weighed after dissection at E13.5. *p=0.001 (embryo) and p = 0.0397 (placenta); n=19 WT and 10 Sirt1-null embryos. (C) H&E staining of WT and Sirt1-null E13.5 mouse placentas, showing labyrinth (Bar is 100 μm). Block arrows mark the thickened chorion in Sirt1-null labyrinth. (D) Junctional zone was evaluated by in situ hybridization using a probe against Tpbpa. Tpbpa+ area was measured and normalized to total placental area (n= 3 WT and Sirt1-null littermate pairs of embryos; p =0.0164 by paired t-test). Bar is 500 μm.
Sirt1-null TSCs show defects in proliferation and differentiation
Next, we derived TSCs from two wild-type (WT) and two Sirt1-null E3.5 embryos. In the absence of Sirt1, confirmed at the protein level (Fig. S2A–B), TSCs could be maintained in standard growth media, but, even when plated at the same cell density, they grew slower, requiring longer periods between passaging. BrdU labeling confirmed this decreased proliferative capacity (Fig. 3A).
Figure 3.
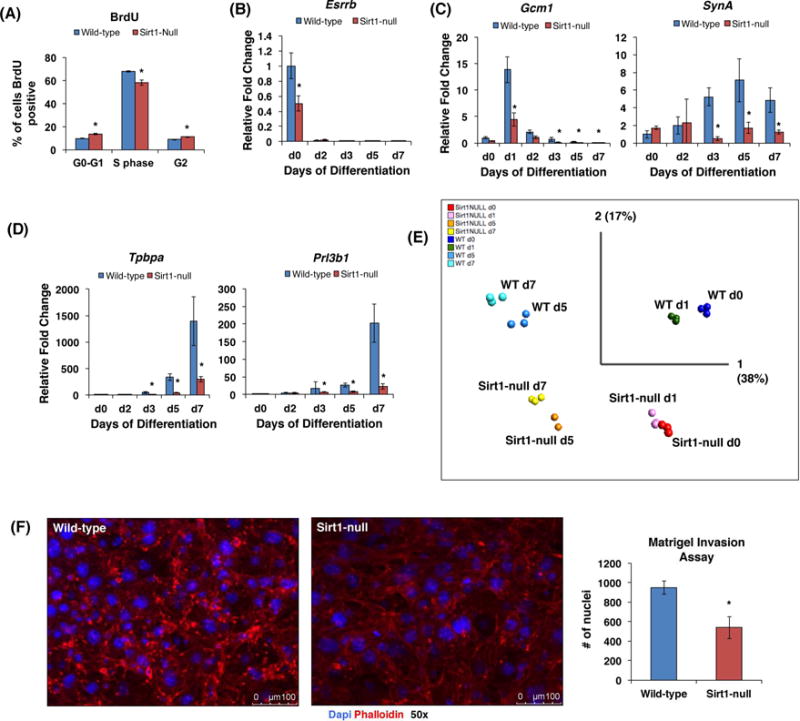
Sirt1-null mTSC lines exhibit altered proliferation and differentiation. (A) Quantification of BrdU/7AAD flow cytometry of WT and Sirt1-null TSCs in growth media. Note reduced proportion of Sirt1-null TSCs in S phase (n=3, p=0.0017). (B–D) WT and Sirt1-null TS cells differentiated in vitro over a 7-day timecourse, then subjected to qRT-PCR for lineage-specific trophoblast markers, including undifferentiated TS cells (Esrrb) (B), labyrinthine trophoblasts (Gcm1 and SynA) (C), and junctional zone (spongiotrophoblasts/Tpbpa and trophoblast giant cells/Prl3b1) (D). Values were normalized against 18S, and shown as fold change with respect to WT day 0. n=3; *p<0.01. (E) Principle Component Analysis (PCA) of microarray-based gene expression profiling data from WT and Sirt1-null TS cells at day 0, and differentiated to days 1, 5, and 7. Note separation of differentiation timepoints based on PCA1 and separation of WT and Sirt1-null cells based on PCA2. Note also the alignment of Sirt1-null day 0 TS cells with day 1-differentiated WT TS, as well as the alignment of day 7-differentiated Sirt1-null cells with day 5-differentiated WT cells. (F) Phalloidin (red) and DAPI (blue) immunofluorescent staining of differentiated (day 7) WT and Sirt1-null TS cells that have invaded Matrigel. The same number of differentiated cells (105 cells) were plated in the top chamber. Nuclei of invaded cells were manually counted, as a surrogate for cell count. n=3; *p<0.05.
Next, we evaluated the TSCs’ ability to differentiate into specific trophoblast subtypes using qRT-PCR for lineage-specific markers. Both Esrrb and Cdx2, markers of undifferentiated TSCs, was reduced in the Sirt1-null cells prior to beginning differentiation (Fig. 3B and S2C). Following differentiation, these cells also showed reduced levels of both labyrinthine markers Gcm1 and SynA (Fig. 3C), junctional zone markers Tpbpa and Prl3b1 (Pl-II) (Fig. 3D). This differentiation defect was confirmed in a second Sirt1-null TSC line, as well as in WT-TSCs in which Sirt1 was knocked down using lentiviral shRNA constructs (Fig. S3A–C). Microarray-based gene expression profiling demonstrated differences in global gene expression of Sirt1-null trophoblasts compared to WT at these timepoints (Fig. 3E). Principle component analysis of these data demonstrated that the greatest variation in the samples was attributed to differentiation (PCA1, explaining 38% of the variability), while the second highest variation was due to presence or absence of Sirt1 (PCA2, 17% of the variability) (Fig. 3E). Compared to WT samples, the undifferentiated (d0) Sirt1-null TSCs aligned most closely with WT cells differentiated for one day (d1), while the most differentiated (d7) Sirt1-null TSCs aligned with WT cells differentiated for only 5 days (d5) (Fig. 3E). Finally, we evaluated a major function of differentiated TGCs, their ability to invade Matrigel, and found that Sirt1-null TSCs showed a 58% reduction in invasive ability (Fig. 3F).
Pathways involved in TSC maintenance and differentiation are altered in the absence of Sirt1
We next identified genes that were differentially expressed across differentiation of the WT and Sirt1-null TSCs and then clustered them using Affinity Propagation (Fig. S4). The resulting nine clusters included three upregulated clusters (clusters 3, 7, 8), four downregulated clusters (clusters 1, 2, 6, 9), and two clusters unchanged in the absence of Sirt1 (clusters 4, 5) (Fig. S4). The list of genes in each cluster were subjected to gene ontology and signaling pathway analyses. The top ten pathways from each analysis for each cluster are shown in Figures S5 through S8. Pathways suppressed in undifferentiated Sirt1-null cells (clusters 1 and 6) included those associated with cell cycle regulation and pluripotency, while those suppressed in differentiated Sirt1-null cells (cluster 9) included ones related to lipid metabolism and autophagy. Interestingly, clusters that did not significantly change in the absence of Sirt1 (clusters 4 and 5) were enriched for both placental development and labyrinthine layer development pathways.
To further evaluate the loss of stemness phenotype in undifferentiated Sirt1-null TSCs, we focused on pathways in clusters 1 and 6, which included genes downregulated in the absence of Sirt1 in undifferentiated TSCs (day 0) (see Fig. S4). Aside from pathways related to the cell cycle and DNA replication, these clusters were also enriched in pathways involved in maintenance of stem cells (see Fig. S6). One of the genes in Cluster 1 was Smad3, which is involved in maintenance of TSCs downstream of TGFβ/activin signaling [25]. We noted a small decrease in total Smad2/3 protein expression in undifferentiated Sirt1-null TSCs by western blot (Fig. 4A). We then treated serum-starved TSCs with activin A, and noted reduced phosphorylation of Smad2/3 in the Sirt1-null cells (Fig. 4A).
Figure 4.
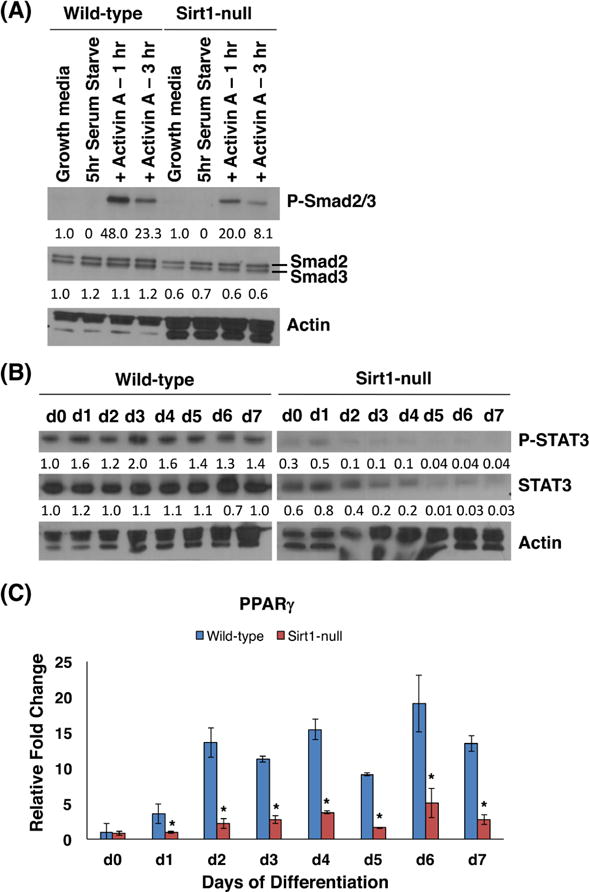
Dysregulation of signaling pathways in Sirt1-null trophoblasts. (A) Western blot of phosphorylated Smad2/3, total Smad2/3 and actin in WT and Sirt1-null cells serum-starved for 5 hours and then treated with 10μg/ml Activin A. Values below the blots show the amount of protein, relative to wild-type cells in growth media only. (B) Western blot of phosphorylated Stat3, total Stat3 and Actin during WT and Sirt1-null TS cell differentiation. Values below the blots show the amount of protein, relative to wild-type cells at day 0. (C) qRT-PCR of PPARγRNA expression during WT and Sirt1-null TS cell differentiation. Data is normalized to 18S and shown with respect to WT day 0. n=3; *p<0.05.
To further evaluate the blunted differentiation phenotype in differentiated Sirt1-null TSCs, we turned our attention to cluster 9. Genes in this cluster showed reduced gene expression in the absence of Sirt1, but only in differentiated TSCs (see Fig. S4). This cluster was enriched for the Stat3 pathway as well as multiple metabolic pathways, including adipogenesis (see Fig. S7). Stat3 has been implicated in both TGC and syncytiotrophoblast differentiation and shown to be reduced in the setting of fetal growth restriction [26, 27]. We confirmed a reduction in both phosphorylated and total Stat3 in differentiating Sirt1-null TSCs compared to WT (Fig. 4B). Within metabolic pathways, we noted a reduction in expression of PPARγ, a transcription factor regulating adipogenesis, a known direct target of Sirt1, and a gene known to be involved in placental development and trophoblast differentiation [19, 28–30]. We used qPCR to confirm that PPARγ was indeed downregulated in differentiating Sirt1-null TSCs (Fig. 4C).
Sirt1-null TSCs are trapped in a cMet-dependent Epcam+ trophoblast progenitor state
Since Sirt1-null TSCs showed reductions in undifferentiated TS markers, while also demonstrating blunted differentiation, we wondered whether they were trapped in a more differentiated trophoblast “progenitor” state. We evaluated expression of a set of trophoblast progenitor markers, including Ascl2, Ly6e, Epcam, Tssc3, and Blimp1 [31–34] at the RNA level. The only progenitor marker consistently upregulated in both of our Sirt1-null TS cell lines was Epcam (data not shown). Since labyrinthine trophoblast progenitor cells are defined as Epcamhigh based on flow cytometric analysis [31], we evaluated in vitro-differentiated trophoblasts and noted that Sirt1-null cells contained a higher proportion of Epcamhigh cells (Fig. 5A). In vivo, Sirt1-null labyrinth layer showed Epcam+ cells both in the thickened chorion and in numerous clusters of cells deeper within the labyrinth (Fig. 5B). Epcamhigh labyrinthine progenitor cells are maintained by signaling through the cMet receptor [31]. By western blot, compared to WT, Sirt1-null TSCs maintained expression of cMet and Epcam significantly longer during differentiation. Taken together, our data suggest that Sirt1 is required for proper terminal differentiation of trophoblast.
Figure 5.
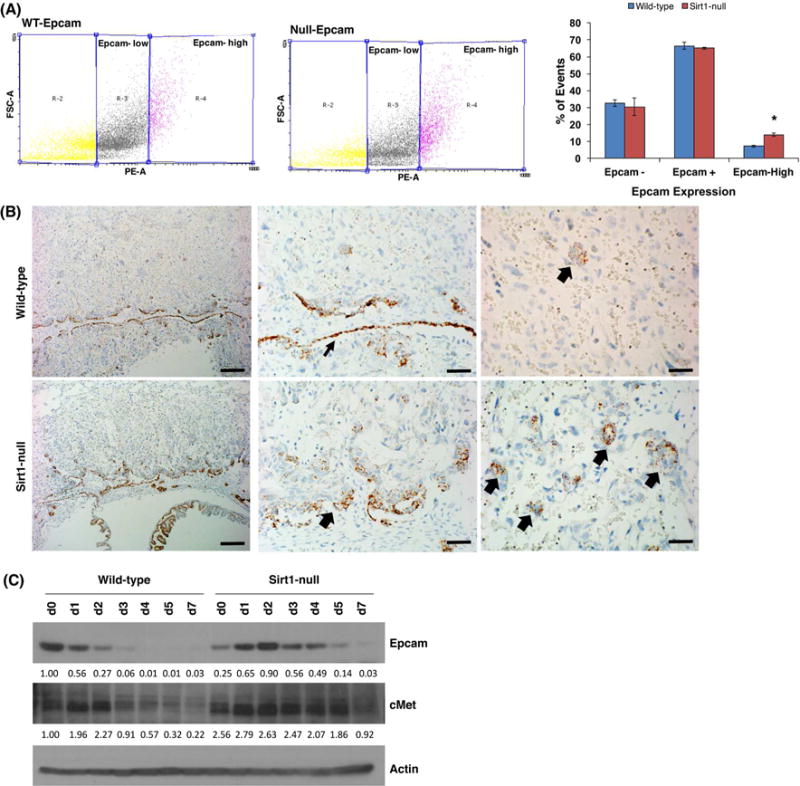
In the absence of Sirt1, cMet-dependent Epcamhigh trophoblast progenitors are expanded. (A) Flow cytometry for Epcam detected populations of trophoblasts expressing high levels of Epcam in differentiated trophoblasts (day 5). Percentage of cells that were Epcam negative, positive, or Epcamhigh were quantified. n=3; p = 0.0003. (B) In situ hybridization for Epcam in WT and Sirt1-null cells. Note the more abundant Epcam+ cells both in the thickened chorionic plate (middle panel, block arrow; WT chorionic plate indicated by thinner block arrow) and in numerous clumps (right panel, block arrows) within the labyrinth of Sirt1-null placentas. Bar is 200 μm (left panels); 50 μm (middle panels); 35 μm (right panels). (C) Western blot of Epcam, cMet, and actin during WT and Sirt1-null TS cell differentiation. Values below the blots show the amount of protein, normalized to actin and WT d0.
Discussion
Previous studies found Sirt1-null embryos to be growth restricted compared to their wild-type littermates [13, 14], but the placentas were not evaluated. We found Sirt1 to be expressed in all trophoblast layers of the mouse placenta, but more uniformly so in the labyrinth. In vitro, Sirt1-null TSCs showed reduced expression of undifferentiated TS markers, suggesting Sirt1-null TSCs have lost their stemness and are prematurely differentiating. A similar phenotype was previously observed in undifferentiated mouse embryonic stem (ES) cells lacking Sirt1 [8]. Similar to our observation with Sirt1-null TSCs, expression profiling of Sirt1-null ES cells showed downregulation of genes in pathways involved in maintenance of pluripotency [8]. In the absence of Sirt1, we identified a reduction in Smad3, and reduced phosphorylation of Smad2/3 in response to priming by Activin, a pathway required for maintenance of TSC [25]. The exact mechanism of Sirt1’s effect on this pathway remains to be identified.
Perhaps the most dramatic phenotype of Sirt1-null mouse TSCs was noted following differentiation: the blunted differentiation phenotype was evident by both qPCR for lineage-specific markers and global gene expression profiling (PCA) and confirmed by functional and in vivo studies. This phenotype was evident in two blastocyst-derived Sirt1-null TSC lines and following Sirt1 knockdown in WT TSCs, with reduced expression of markers of both labyrinthine and junctional zone trophoblast lineages. One altered canonical pathway identified here was Stat3 signaling, which has been shown to be involved in mouse TGC differentiation, downstream of leukemia inhibitory factor (LIF) [26], but also in differentiation of human syncytiotrophoblast [27]. In the latter study, downregulation of placental Stat3 was associated with fetal growth restriction [27]. We confirmed that both total and phosphorylated Stat3 were reduced in differentiating mouse Sirt1-null TSCs. This likely contributes to both the blunted differentiation phenotype and the reduced fetal growth.
Another downregulated pathway identified in differentiating Sirt1-null TSCs was PPARγ. This was somewhat unexpected, as Sirt1-mediated nutrient sensing has been shown to regulate fat mobilization through repression of PPARγ signaling [28]. Our own previous collaborative study showed that, in the setting of maternal obesity, induced by high fat diet during pregnancy, Sirt1 expression is reduced in the placenta and that this reduction leads to enhanced expression of PPARγ in turn resulting in increased lipoprotein lipase expression and fetal fat accumulation [35]. It was therefore surprising to find reduced PPARγ expression in the absence of Sirt1 in differentiated TSCs. Nevertheless, there does appear to be overlap between the phenotype of placenta and TSCs lacking Sirt1 and those lacking PPARγ; absence of PPARγ is associated with midgestation embryonic lethality [29, 30] with placental abnormalities including decreased labyrinthine trophoblast and enhanced TGC differentiation [19]. Thus, at least part of the Sirt1-null phenotype in placenta and TSC, the blunted labyrinthine development, may be partly attributed to decreased PPARγ expression.
In vivo, the lack of Sirt1 resulted in smaller placentas, with smaller junctional zones and less mature-appearing labyrinth. The labyrinth appeared hypercellular, both at the fetal surface with a thick chorionic plate and deeper within the labyrinth where cell aggregates were common. The thickened chorion and cell aggregates contained Epcam+ cells, attesting to their immature phenotype. These labyrinthine progenitor cells are maintained via signaling through the cMet receptor [31]. Thus, their persistence in the absence of Sirt1 appears to be at least partly due to sustained expression of cMet in differentiated TSCs. How cMet expression is altered by Sirt1 remains to be seen. Both direct deacetylation by Sirt1 and indirect regulation of expression through deacetylation of a transcription factor are possible mechanisms.
Finally, whether the placental abnormalities are responsible for the fetal growth restriction seen in Sirt1-deficient embryos remains to be seen. Sirt1-null embryos have abnormalities in fetal organs (i.e. heart), which could also compromise fetal growth [14]. While blunted trophoblast differentiation and abnormal placental development could certainly cause fetal growth restriction, additional in vivo studies are required to determine the extent to which lack of trophoblastic Sirt1 contributes to this phenotype. Nevertheless, the placental abnormalities detailed in this study likely contribute, at least partially, to fetal growth restriction, thereby establishing a key role for this nutrient sensor and protein deactylase during intrauterine development.
Supplementary Material
Highlights.
Sirt1-null placentas are small and show morphologic defects.
Loss of Sirt1 results in blunted terminal trophoblast differentiation in vitro.
In the absence of Sirt1, known trophoblast signaling pathways are altered.
Sirt1-null trophoblasts are trapped in an Epcamhigh labyrinthine progenitor stage.
Acknowledgments
This work was supported by the National Institute of Child Health and Human Development (R01-NIH HD07110 to M.M.P.). We would like to thank Dr. Michael McBurney for the Sv129 heterozygous mice and Dr. David Natale for help with interpretation of mouse placental immunostaining and in situ hybridization as well as review of the manuscript.
Footnotes
Publisher's Disclaimer: This is a PDF file of an unedited manuscript that has been accepted for publication. As a service to our customers we are providing this early version of the manuscript. The manuscript will undergo copyediting, typesetting, and review of the resulting proof before it is published in its final citable form. Please note that during the production process errors may be discovered which could affect the content, and all legal disclaimers that apply to the journal pertain.
References
- 1.Guttmacher AE, Maddox YT, Spong CY. The Human Placenta Project: placental structure, development, and function in real time. Placenta. 2014;35:303–304. doi: 10.1016/j.placenta.2014.02.012. [DOI] [PMC free article] [PubMed] [Google Scholar]
- 2.Burton GJ, Jauniaux E. What is the placenta? Am J Obstet Gynecol. 2015;213:S6–8. doi: 10.1016/j.ajog.2015.07.050. [DOI] [PubMed] [Google Scholar]
- 3.Fisher SJ. Why is placentation abnormal in preeclampsia? Am J Obstet Gynecol. 2015;213:S115–S122. doi: 10.1016/j.ajog.2015.08.042. [DOI] [PMC free article] [PubMed] [Google Scholar]
- 4.Leibiger IB, Berggren PO. Sirt1: a metabolic master switch that modulates lifespan. Nat Med. 2006;12:34–36. doi: 10.1038/nm0106-34. [DOI] [PubMed] [Google Scholar]
- 5.Michan S, Sinclair D. Sirtuins in mammals: insights into their biological function. Biochem J. 2007;404:1–13. doi: 10.1042/BJ20070140. [DOI] [PMC free article] [PubMed] [Google Scholar]
- 6.Simic P, Zainabadi K, Bell E, Sykes DB, Saez B, Lotinun S, Baron R, Scadden D, Schipani E, Guarente L. SIRT1 regulates differentiation of mesenchymal stem cells by deacetylating beta-catenin. EMBO Mol Med. 2013;5:430–440. doi: 10.1002/emmm.201201606. [DOI] [PMC free article] [PubMed] [Google Scholar]
- 7.Rafalski VA, Ho PP, Brett JO, Ucar D, Dugas JC, Pollina EA, Chow LM, Ibrahim A, Baker SJ, Barres BA, Steinman L, Brunet A. Expansion of oligodendrocyte progenitor cells following SIRT1 inactivation in the adult brain. Nat Cell Biol. 2013;15:614–624. doi: 10.1038/ncb2735. [DOI] [PMC free article] [PubMed] [Google Scholar]
- 8.Tang S, Huang G, Fan W, Chen Y, Ward JM, Xu X, Xu Q, Kang A, McBurney MW, Fargo DC, Hu G, Baumgart-Vogt E, Zhao Y, Li X. SIRT1-mediated deacetylation of CRABPII regulates cellular retinoic acid signaling and modulates embryonic stem cell differentiation. Mol Cell. 2014;55:843–855. doi: 10.1016/j.molcel.2014.07.011. [DOI] [PMC free article] [PubMed] [Google Scholar]
- 9.Rimmelé P, Bigarella CL, Liang R, Izac B, Dieguez-Gonzalez R, Barbet G, Donovan M, Brugnara C, Blander JM, Sinclair DA, Ghaffari S. Aging-like phenotype and defective lineage specification in SIRT1-deleted hematopoietic stem and progenitor cells. Stem Cell Reports. 2014;3:44–59. doi: 10.1016/j.stemcr.2014.04.015. [DOI] [PMC free article] [PubMed] [Google Scholar]
- 10.Hisahara S, Chiba S, Matsumoto H, Tanno M, Yagi H, Shimohama S, Sato M, Horio Y. Histone deacetylase SIRT1 modulates neuronal differentiation by its nuclear translocation. Proc Natl Acad Sci U S A. 2008;105:15599–15604. doi: 10.1073/pnas.0800612105. [DOI] [PMC free article] [PubMed] [Google Scholar]
- 11.Simmons GE, Jr, Pruitt WM, Pruitt K. Diverse roles of SIRT1 in cancer biology and lipid metabolism. Int J Mol Sci. 2015;16:950–965. doi: 10.3390/ijms16010950. [DOI] [PMC free article] [PubMed] [Google Scholar]
- 12.Rahman S, Islam R. Mammalian Sirt1: insights on its biological functions. Cell Commun Signal. 2011;9:11. doi: 10.1186/1478-811X-9-11. [DOI] [PMC free article] [PubMed] [Google Scholar]
- 13.McBurney MW, Yang X, Jardine K, Hixon M, Boekelheide K, Webb JR, Lansdorp PM, Lemieux M. The mammalian SIR2alpha protein has a role in embryogenesis and gametogenesis. Mol Cell Biol. 2003;23:38–54. doi: 10.1128/MCB.23.1.38-54.2003. [DOI] [PMC free article] [PubMed] [Google Scholar]
- 14.Cheng HL, Mostoslavsky R, Saito S, Manis JP, Gu Y, Patel P, Bronson R, Appella E, Alt FW, Chua KF. Developmental defects and p53 hyperacetylation in Sir2 homolog (SIRT1)-deficient mice. Proc Natl Acad Sci U S A. 2003;100:10794–10799. doi: 10.1073/pnas.1934713100. [DOI] [PMC free article] [PubMed] [Google Scholar]
- 15.Wang RH, Senguta K, Li C, Kim HS, Cao L, Xiao C, Kim S, Xu X, Zheng Y, Chilton B, Jia R, Zheng ZM, Apella E, Wang XW, Ried T, Deng CX. Impaired DNA damage response, genome instability, and tumorigenesis in SIRT1 mutant mice. Cancer Cell. 2008;14:312–323. doi: 10.1016/j.ccr.2008.09.001. [DOI] [PMC free article] [PubMed] [Google Scholar]
- 16.Chen B, Nelson DM, Sadovsky Y. N-myc down-regulated gene 1 modulates the response of term human trophoblasts to hypoxic injury. J Biol Chem. 2006;281:2764–2772. doi: 10.1074/jbc.M507330200. [DOI] [PubMed] [Google Scholar]
- 17.Lappas M, Mitton A, Lim R, Barker G, Riley C, Permezel M. SIRT1 is a novel regulator of key pathways of human labor. Biol Reprod. 2001;84:167–178. doi: 10.1095/biolreprod.110.086983. [DOI] [PubMed] [Google Scholar]
- 18.Wang F, Flanagan J, Su N, Wang LC, Bui S, Nielson A, Wu X, Vo HT, Ma XJ, Luo Y. RNAscope: a novel in situ RNA analysis platform for formalin-fixed, paraffin-embedded tissues. J Mol Diagn. 2012;14:22–29. doi: 10.1016/j.jmoldx.2011.08.002. [DOI] [PMC free article] [PubMed] [Google Scholar]
- 19.Parast MM, Yu H, Ciric A, Salata MW, Davis V, Milstone DS. PPARgamma regulates trophoblast proliferation and promotes labyrinthine trilineage differentiation. PloS One. 2009;4:e8055. doi: 10.1371/journal.pone.0008055. [DOI] [PMC free article] [PubMed] [Google Scholar]
- 20.Oda M, Shiota K, Tanaka S. Trophoblast stem cells. Methods Enzymol. 2006;419:387–400. doi: 10.1016/S0076-6879(06)19015-1. [DOI] [PubMed] [Google Scholar]
- 21.Moretto Zita M, Soncin F, Natale D, Pizzo D, Parast M. Gene Expression Profiling Reveals a Novel Regulatory Role for Sox21 Protein in Mouse Trophoblast Stem Cell Differentiation. J Biol Chem. 2015;290:30152–62. doi: 10.1074/jbc.M115.659094. [DOI] [PMC free article] [PubMed] [Google Scholar]
- 22.Du P, Kibbe WA, Lin SM. lumi: a pipeline for processing Illumina microarray. Bioinformatics. 2008;24:1547–1548. doi: 10.1093/bioinformatics/btn224. [DOI] [PubMed] [Google Scholar]
- 23.Frey BJ, Dueck D. Clustering by passing messages between data points. Science. 2007;315:972–976. doi: 10.1126/science.1136800. [DOI] [PubMed] [Google Scholar]
- 24.Bodenhofer U, Kothmeier A, Hochreiter S. AP Cluster: an R package for affinity propagation clustering. Bioinformatics. 2011;27:2463–2464. doi: 10.1093/bioinformatics/btr406. [DOI] [PubMed] [Google Scholar]
- 25.Erlebacher A, Price KA, Glimcher LH. Maintenance of mouse trophoblast stem cell proliferation by TGF-beta/ctiving. Dev Biol. 2004;275:158–169. doi: 10.1016/j.ydbio.2004.07.032. [DOI] [PubMed] [Google Scholar]
- 26.Takahashi Y, Takahashi M, Carpino N, Jou ST, Chao JR, Tanaka S, Shigeyoshi Y, Parganas E, Ihle JN. Leukemia inhibitory factor regulates trophoblast giant cell differentiation via Janus kinase 1-signal transducer and activator of transcription 3-suppressor of cytokine signaling 3 pathway. Mol Endocrinol. 2008;22:1673–1681. doi: 10.1210/me.2008-0058. [DOI] [PMC free article] [PubMed] [Google Scholar]
- 27.Borg AJ, Yong HE, Lappas M, Degrelle SA, Keogh RJ, Da Silva-Costa F, Fournier T, Abumaree M, Keelan JA, Kalionis B, Murthi P. Decreased STAT3 in human idiopathic fetal growth restriction contributes to trophoblast dysfunction. Reproduction. 2015;149:523–532. doi: 10.1530/REP-14-0622. [DOI] [PubMed] [Google Scholar]
- 28.Picard F, Kurtev M, Chung N, Topark-Ngarm A, Senawong T, Machado De Oliveira R, Leid M, McBurney MW, Guarente L. Sirt1 promotes fat mobilization in white adipocytes by repressing PPAR-gamma. Nature. 2004;429:771–776. doi: 10.1038/nature02583. [DOI] [PMC free article] [PubMed] [Google Scholar]
- 29.Barak Y, Nelson MC, Ong ES, Jones YZ, Ruiz-Lozano P, Chien KR, Koder A, Evans RM. PPAR gamma is required for placental, cardiac, and adipose tissue development. Mol Cell. 1999;4:585–895. doi: 10.1016/s1097-2765(00)80209-9. [DOI] [PubMed] [Google Scholar]
- 30.Kubota N, Terauchi Y, Miki H, Tamemoto H, Yamauchi T, Komeda K, Satoh S, Nakano R, Ishii C, Sugiyama T, Eto K, Tsubamoto Y, Okuno A, Murakami K, Sekihara H, Hasegawa G, Naito M, Toyoshima Y, Tanaka S, Shiota K, Kitamura T, Fujita T, Ezaki O, Aizawa S, Nagai R, Tobe K, Kimura S, Kadowaki T. PPAR gamma mediates high-fat diet-induced adipocyte hypertrophy and insulin resistance. Mol Cell. 1999;4:597–609. doi: 10.1016/s1097-2765(00)80210-5. [DOI] [PubMed] [Google Scholar]
- 31.Ueno M, Lee LK, Chhabra A, Kim KY, Sasidharan R, Van Handel B, Wang Y, Kamata M, Kamran P, Sereti KI, Ardehali R, Jiang M, Mikkola HK. c-Met-dependent multipotent labyrinth trophoblast progenitors establish placental exchange interface. Dev Cell. 2013;27:373–386. doi: 10.1016/j.devcel.2013.10.019. [DOI] [PMC free article] [PubMed] [Google Scholar]
- 32.Hughes M, Natale BV, Simmons DG, Natale DRC. Ly6e expression is restricted to syncytiotrophoblast cells of the mouse placenta. Placenta. 2013;34:831–835. doi: 10.1016/j.placenta.2013.05.011. [DOI] [PubMed] [Google Scholar]
- 33.Takao T, Asanoma K, Tsunematsu R, Kato K, Wake N. The maternally expressed gene Tssc3 regulates the expression of MASH2 transcription factor in mouse trophoblast stem cells through the AKT-Sp1 signaling pathway. J Biol Chem. 2012;287:42685–42694. doi: 10.1074/jbc.M112.388777. [DOI] [PMC free article] [PubMed] [Google Scholar]
- 34.Mould A, Morgan MAJ, Li L, Bikoff EK, Robertson EJ. Blimp1/Prdm1 governs terminal differentiation of endovascular trophoblast giant cells and defines multipotent progenitors in the developing placenta. Genes Dev. 2012;26:2063–2074. doi: 10.1101/gad.199828.112. [DOI] [PMC free article] [PubMed] [Google Scholar]
- 35.Qiao L, Guo Z, Bosco C, Guidotti S, Wang Y, Wang M, Parast M, Schaack J, Hay WW, Jr, Moore TR, Shao J. Maternal High-Fat Feeding Increases Placental Lipoprotein Lipase Activity by Reducing SIRT1 Expression in Mice. Diabetes. 2015;64:3111–3120. doi: 10.2337/db14-1627. [DOI] [PMC free article] [PubMed] [Google Scholar]
Associated Data
This section collects any data citations, data availability statements, or supplementary materials included in this article.