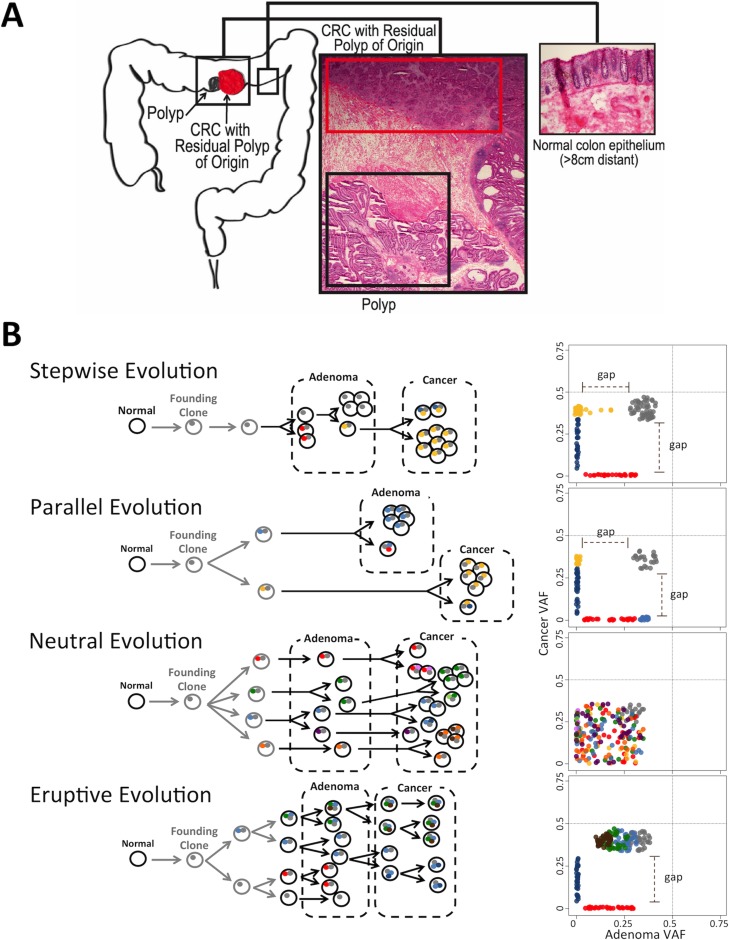
Figure 1. Modes of Evolution (MOE) in the transformation from adenoma to cancer and resulting AF distributions.
(A) CRC with residual polyp of origin (top red box) refers to the cancer that has the polyp located physically adjacent to the cancer (bottom black box). (B) Schematic representation of MOEs in adenoma-to-cancer transformation: classical sequential stepwise evolution, parallel (branched) model, neutral evolution, and eruptive (Big-Bang) model of early bursts of single or whole chromosomal genomic disruption. Circles and dots depict cells and mutations respectively. Colors correspond to different clones/subclones. Plots on the right represent 2D AF distributions of somatic variants in polyps and cancer with dotted lines on 0.5 AF. AFs of shared SNVs could be shifted from 0.5 due to sample impurity. These distributions are characteristic of each mode and can be used for MOE prediction.

