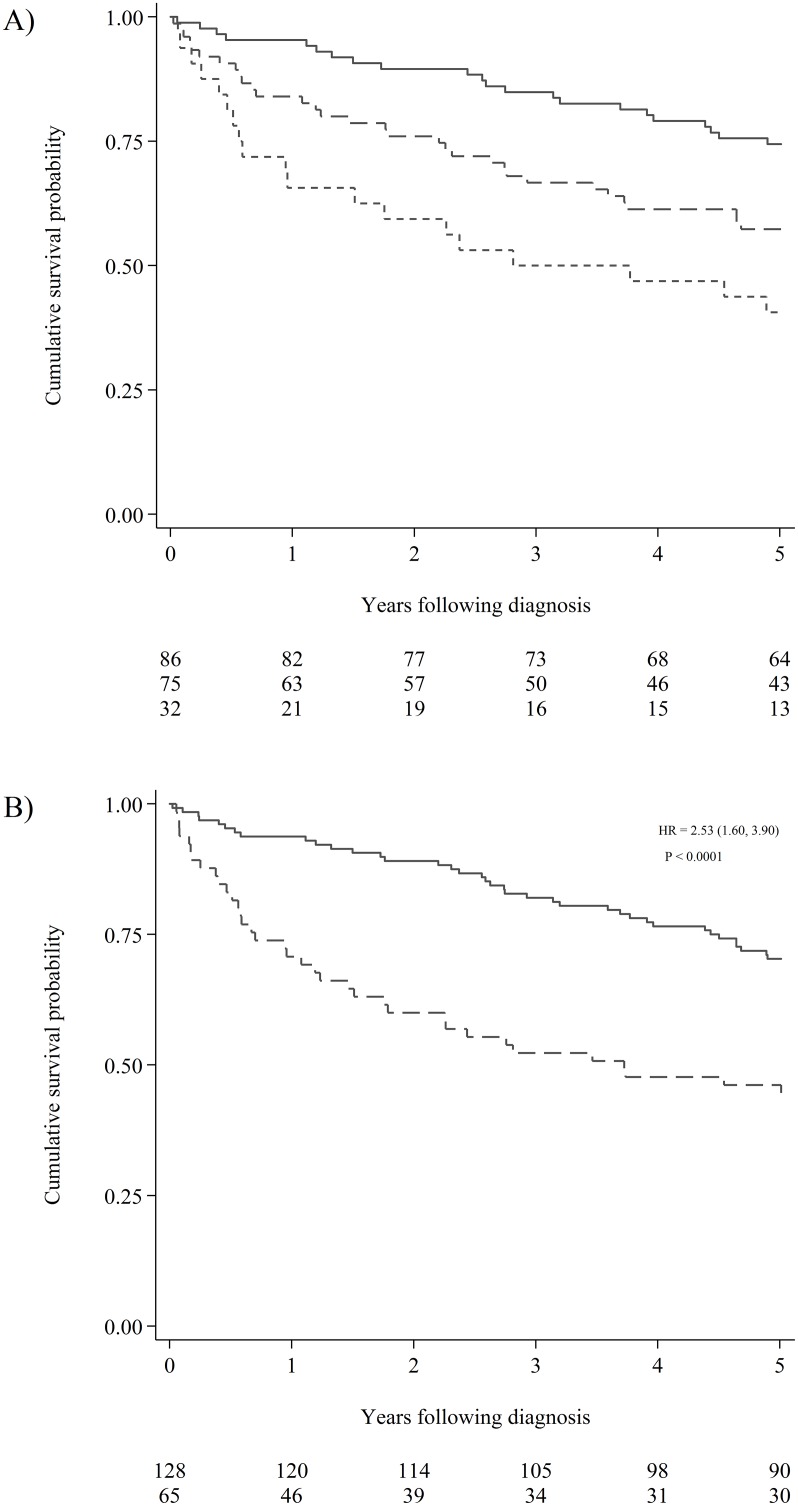
Figure 2. Cumulative survival probability according hypermethylation status.
(A) Kaplan Meier estimates visualising the effect of the number of hypermethylations on the survival of CRC patients. The solid line represents patients with 0-4 hypermethylated promoter regions measured in plasma. The dashed line represents patients with 5-10 hypermethylated promoter regions in plasma. The short dashed line represents patients with more than 10 hypermethylated promoter regions in plasma. The number of patients at risk in the three groups can be seen below the graph. (B) Kaplan Meier estimates visualising the effect hypermethylation of RARB or RASSF1A on the survival of all-stage CRC patients. The solid line represents patients without hypermethylation of either promoter region. The dashed line represents patients with hypermethylated RARB and/or RASSF1A in plasma. The hazard ratio (HR) was computed using univariable Cox regression (the 95% confidence interval is reported in brackets). The Log-rank test for equality of survivor functions was used to compute the p-value. The number of patients at risk for the two groups can be seen below the graph.

