

Abstract
Imaging and chromatin capture techniques have shed important insights into our understanding of nuclear organization. A limitation of these techniques is the inability to resolve allele-specific spatiotemporal properties of genomic loci in living cells. Here, we describe an allele-specific CRISPR live-cell DNA imaging technique (SNP-CLING) to provide the first comprehensive insights into allelic positioning across space and time in mouse embryonic stem cells and fibroblasts. In 3D-imaging, we studied alleles on different chromosomes in relation to one another and relative to nuclear substructures such as the nucleolus. We find that alleles maintain similar positions relative to each other and the nucleolus, however loci occupy different unique positions. To monitor spatiotemporal dynamics by SNP-CLING, we performed 4D-imaging, determining that alleles are either stably positioned, or fluctuating during cell state transitions, such as apoptosis. SNP-CLING is a universally applicable technique that enables dissecting allele-specific spatiotemporal genome organization in live cells.
Keywords: Allele-specific CRISPR live-cell imaging, SNP-CLING, confocal super-resolution microscopy, Airyscan, allele positioning, lncRNAs, CISTR-ACT, FIRRE
Introduction
The three-dimensional organization of DNA is critical in the establishment of cellular states and frequently dysregulated in disease 1-4. This relies on regulatory aspects, such as non-random chromosomal positioning, chromosomal substructures and properties, and ultimately the position of a given locus in the nucleus 5-7. Underscoring the importance of these processes, several recent studies have revealed mechanistic links between chromosomal topology and disease. For example, structural chromosomal aberrations can result in pathogenic re-wiring of enhancer-promoter interactions 2,8-10.
This raises the question of how do heterozygous structural aberrations affect nuclear organization properties? Addressing this has been very difficult for several reasons: (i) it requires an allele-specific imaging approach. So far, there are only two allele-specific techniques for fixed cells, using copy number variations or oligo-painting 11,12, (ii) Hi-C was adopted to study molecular interactions of haplotype genomes, but without the possibility to assess spatiotemporal dimensions 3,13,14, and (iii) all these techniques use crosslinking to fix specimen which prevents elucidating spatiotemporal dynamics. In addition to losing the ability to monitor spatiotemporal dynamics, such fixative treatments can disrupt higher order nuclear architecture and can cause non-physiological artefacts 15. In sum, to date, the real-time study of specific allele positioning in living cells has been infeasible.
To achieve allele-specific resolution, properties, and dynamics of gene loci, we took advantage of the programmable ability of the CRISPR-Cas9 system to recognize specific DNA sequences to engineer a live-cell imaging technique able to resolve individual alleles to study their properties in living cells. Using this technique, termed Single Nucleotide Polymorphism CRISPR Live-cell imagING (SNP-CLING), we find that SNP-CLING is a highly specific and universally applicable method that can resolve allelic positioning relative to nuclear sub-compartments (e.g. nucleolus), and allele-specific interactions between non-homologous chromosomes. Importantly, all these factors can be investigated in living cells.
We applied SNP-CLING on two different long non-coding RNA (lncRNA) loci, Firre and CISTR-ACT, which are involved in heterozygous structural aberrations causing Mendelian disease 16-18. Amplifications encompassing FIRRE have been found in patients with periventricular nodular heterotopia with polymicrogyria 17, and translocations of CISTR-ACT are causally associated with brachydactyly 18. Current methods cannot resolve the resulting implications of these heterozygous aberrations on higher-order nuclear architecture.
Here, we first validate the specificity and accuracy of SNP-CLING and explore allelic positioning across space and time. By 3D-imaging, we determined that alleles stably maintain similar positions close to the nucleolus, although each studied locus occupied a unique localization within the nucleus. Next, we extended our analysis and performed allele-specific imaging across time (4D) to elucidate spatiotemporal allele positioning in relation to the major sub-nuclear compartment of the nucleolus. We found that alleles are stably positioned through time in human and mouse cells. This does not only suggest that chromosome territories are stably positioned, but also that specific spatial distances are maintained between alleles or loci. Moreover, through time, these distances are preserved, suggesting that there is neither random movement of alleles relative to each other, nor to nuclear substructures such as the nucleolus. Altogether, SNP-CLING is broadly applicable to decipher a multitude of previously intractable questions on chromatin biology and nuclear architecture in living cells.
Results
Implementing allele-specific SNP-CLING
To visualize each allele of a locus simultaneously in a living cell, we leveraged a nuclease-null mutant of the S. pyogenes Cas9 protein (dCas9) with pools of 2-3 single-guide RNAs (sgRNAs) targeting each allele. Each sgRNA is internally appended with RNA-aptamer motifs (MS2, or PP7, or Puf1) and co-transfected with the corresponding RNA-binding proteins (MS2, or PP7, or PUM1), fused to a fluorescent protein (mVenus, or mCherry, or iRFP670, Figure 1a) 19-23.
Figure 1. SNP-CLING or CLING labeling in live cells.
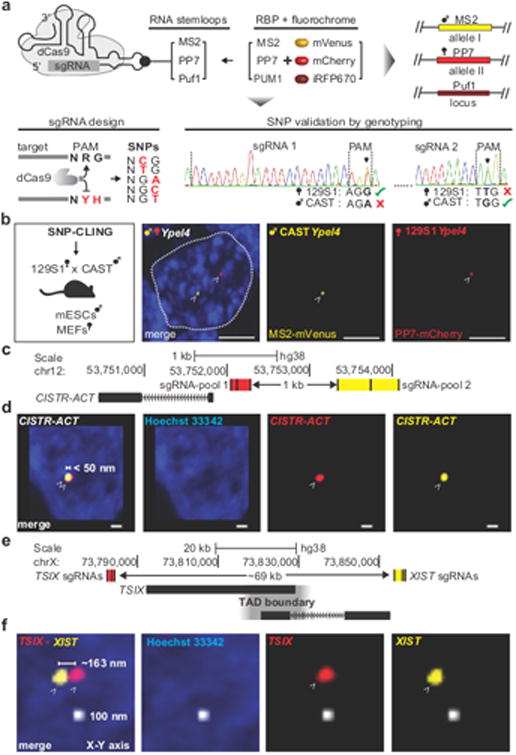
(a) sgRNAs harboring internal protein-binding RNA-motifs (MS2, or PP7, or Puf1) direct non-catalytic dCas9 to each targeted locus. The corresponding RNA-binding proteins (RBP) MS2, or PP7, or PUM1, are fused to mVenus, or mCherry, or iRFP670, and fluorescently label up to three different loci. For allele-specific labelling, either the 2nd or 3rd nucleotide in the dCas9 PAM-motif 5′-NRG-3′ was substituted by a heterozygous SNP to a non-specific dCas9-motif (IUPAC code: ‘Y’ = ‘C’ or ‘T’; ‘H’ = ‘A’, ‘C’ or ‘T’), thereby preventing dCas9-binding to either the 129S1 or CAST alleles in mouse hybrid cells. Sanger sequencing of selected SNPs confirmed heterozygosity. (b) Allele-specific visualization of 129S1-Ypel4 (yellow = MS2-mVenus) and CAST-Ypel4 (red = PP7-mCherry) in male 129S1/CAST mESCs (scale bar = 5 μm, n = 4, 35 nuclei, dashed line = mESC nucleus, arrowheads = SNP-CLING foci of maternal and paternal Ypel4 alleles). (c) Three sgRNAs in MS2 and another set of three sgRNAs in PP7 targeted the CISTR-ACT locus (sgRNA-pool 1 and 2) in RPE-1 cells to elucidate specificity. (d) All measurable foci exhibited two-color co-localization indicating locus-specificity in female RPE-1 cells (edges of foci: < 1 voxel distance = < 50 nm3, scale bar = 500 nm, n = 4, 35 nuclei, arrowheads = CLING foci of CISTR-ACT). (e) To address resolution, two sgRNAs pools targeted XIST (yellow = MS2-mVenus) and TSIX (red = PP7-mCherry), separated by a topological associated domain (TAD) boundary; genomic linear distance ~69 kb. (f) Distinct, non-co-localized signals occurred in 6 out of 10 cells between XIST and TSIX, with spatial displacements of ∼163-638 nm in all three dimensions in RPE-1 cells (scale bar = 100 nm, arrowheads = CLING foci of XIST and TSIX).
To reach our goal of allele-specific labeling of loci in living cells, we exploited the need of Sp. dCas9 to have a protospacer adjacent motif (PAM: 5′-NRG-3′) located next to its target 24, and asked whether dCas9 could distinguish SNPs within the PAM motif, thereby resolving specific alleles. To test if SNP-CLING can specifically label different alleles, we used mouse embryonic stem cells (mESCs) or mouse embryonic fibroblasts (MEFs), derived from a hybrid 129S1/Castaneous (129S1/CAST) mouse cross. First, we identified suitable SNPs genome wide in the PAM motif ‘NRG’, by filtering either for ‘C’ or ‘T’ substitutions at the 2nd position, or any other nucleotide than ‘G’ at the 3rd position (Figure 1a, S1). We then looked for suitable SNPs at the Ypel4 locus, a gene known to interact with Firre 16. We created two intergenic sgRNA pools to label the maternal 129S1 (2 sgRNAs: PP7-mCherry) or paternal CAST (2 sgRNAs: MS2-mVenus) Ypel4 (Figure 1b). The expected number of foci correlated with the cells' karyotypes, and these foci were the brightest and largest nuclear signals when compared to background signals in living cells (Figures S2-S3). Moreover, we successfully resolved maternal alleles separate from paternal alleles in 83 % of cells (Figure S3).
Predicted off-target sgRNA-sites tend to occur at distant sites far from the primary target 25. We thus tested foci specificity without distinguishing alleles in human retinal epithelial RPE-1 cells 26, and C28/I2 chondrocytes 27. We targeted two different sgRNA pools (MS2-mVenus; PP7-mCherry) to two nearby sites (1 kb apart) within a single locus (Figure 1c). All measurable foci exhibited two-color co-localization indicating locus-specificity (Figures 1d, S3i). To further test the spatial resolution, we targeted two loci separated by a linear genomic distance of ∼69 kb, on opposing ends of the XIST–TSIX loci which map to different topologically associated domains 28. Using two orthologous sgRNA pools (one to XIST and one to TSIX, Figure 1e), we discretely resolved the TSIX and XIST loci and observed distant, non-co-localized signals at a smallest displacement of 163 nm (Figures 1f, S3j). Thus, SNP-CLING provides a powerful method to monitor targeted loci in an allele-specific manner at a spatial resolution of ~160 nm.
Taken together, using heterozygous SNPs in haplotypes of human pedigrees or on different alleles of mouse hybrid strains, SNP-CLING can be broadly applicable to study gene locations at allele-specific resolution.
Inter-allelic differences are modest
Chromosomal territories are non-randomly organized 29,30, and the features of genomic loci, such as chromosomal size, DNA (GC) content, gene density, and transcriptional activity, differ. These properties are inter-dependent and determine individual locus positioning 30. The three-dimensional dynamics of alleles have not yet been able to be addressed and we still do not know whether alleles occupy random or stable positions. However, SNP-CLING can discriminate between alleles and determine allelic positioning in living cells. To this end, we chose genes that are located on chromosomes with different properties (size and gene-density), and they are involved in heterozygous structural aberrations causing brachydactyly (Hdac4, Sox9 and Cistr-act) 18,31. Specifically, we targeted alleles on a large chromosome (chr.1 – Hdac4), small chromosome (chr.18:41.21 Mb), gene dense (chr.7:99.55 Mb, chr.11 – Sox9) and gene poor chromosome (chr.15 – Cistr-act, chr. 18:41.21 Mb) in female 129S1/CAST MEFs (maternal 129S1-allele = PP7-mCherry, paternal CAST-allele = MS2-mVenus, Figures S4a, b).
In order to address differences of spatial allelic distances that may be influenced by chromosome size, we first measured distances between alleles on the largest chromosome (chr. 1: Hdac4) and between alleles on a small chromosome (chr. 18, random locus, Figure 2a). Despite differences in the chromosomal size, inter-allelic distances on either the large or the small chromosome were highly similar to one another in a majority of cells (Figure 2a, 2948±2399 nm Hdac4, 2664±1938 nm locus at 41.21 Mb on chr. 18).
Figure 2. Inter-allelic distances.
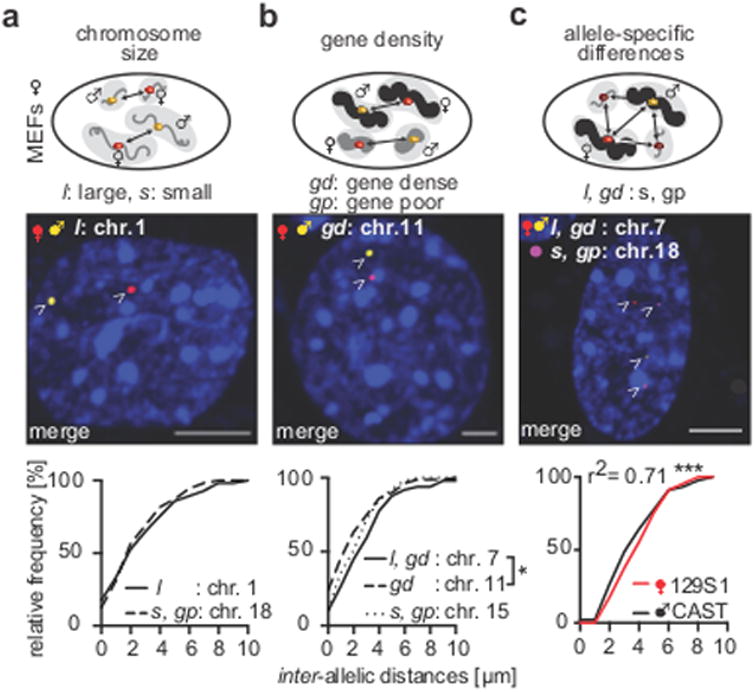
(a) Inter-allelic distances of Hdac4 [CI = 2.31-3.59] on largest chromosome 1 compared to a locus on small chromosome 18 (44.21 Mb, [CI = 2.14-3.19 μm]) in female 129S1/CAST MEFs were similar (each 80 nuclei, scale bars = 5 μm, arrowheads = SNP-CLING foci of maternal and paternal Hdac4 alleles). (b) Inter-allelic distances between 129S1 and CAST alleles of loci on gene dense chromosomes (chr.7:99.55 Mb [CI = 2.48-3.96 μm], chr. 11 – Sox9 [CI = 1.82-2.75 μm]) or gene-poor chromosome 15 (Cistr-act [CI = 2.05-3.03 μm]). Chr. 11 distances were different to chr. 7 (two-tailed Mann Whitney rank sum test, * p = 0.02, each 80 nuclei, arrowheads = SNP-CLING foci of maternal and paternal Sox9 alleles). (c) Inter-allelic distances of the SNP-CLING-labeled alleles on chr.7 (arrowheads: yellow = paternal MS2-mVenus, red = maternal PP7-mCherry) relative to inter-genic distances of a CLING-labeled locus (non-allele-specific) on chr.18 (arrowheads: purple = Puf1-PUM1-iRFP670, Pearson's r2 = 0.71, significance of Pearson's: *** p < 0.0001, 80 nuclei).
Next, we measured distances of alleles on gene dense and gene poor chromosomes. The alleles of the locus on a gene rich chromosome (3223±2582 nm), were further apart from each other than the Sox9 (2288±2080 nm), or Cistr-act alleles on gene poor chromosomes (2539±1776 nm, Figures 2b, S4b, chr.7 vs. Sox9 * p = 0.02). These observations demonstrate the feasibility of SNP-CLING to detect spatial allelic distances, and suggest that relative allelic positioning can be slightly different for each chromosome, supporting the notion that the positions of chromosomal territories are stable.
Multiple genomic loci of local chromatin neighborhoods can be clustered in spatial proximity to orchestrate tissue-specific gene-regulation 32-34. Since SNP-CLING is multiplexable, we were able to address if inter-allelic distances change relative to inter-genic distances to a third locus. Specifically, we labeled the alleles on chromosome 7 by SNP-CLING (maternal 129S1-allele = PP7-mCherry, paternal CAST-allele = MS2-mVenus), and included a non-allele specific label (CLING) on a third locus on chromosome 18 (Puf1-Pum-iRFP670). Notably, measuring inter-allelic distances between the two alleles of chromosome 7 (129S1/CAST), relative to inter-genic distances of the locus on chromosome 18, showed highly similar and stable distances independently of the genetic backgrounds 129S1 or CAST (*** p < 0.0001, Pearson's r2 = 0.71, Figure 2c). This suggests that both inter-allelic and inter-genic distances relative to another locus are similar. Among the loci we tested, one allele seems to maintain the same spatial distance relative to the other, underscoring stable allelic positioning and the maintenance of these distances. Collectively, SNP-CLING offers the advantage to measure allelic properties in living cells and to directly assay genomic positioning in relation to other loci. In contrast, other imaging techniques that are capable to label individual genomic loci like DNA-FISH require crosslinked cells and do not allow distinguishing between parental alleles in live cells.
Allele positioning is preserved and unique for each locus
Despite advances in characterizing chromosomal interactions and nuclear architecture, we still do not have an understanding of how specific alleles are positioned relative to sub-nuclear compartments in live cells. Gene positioning relative to nuclear bodies (i.e. Cajal bodies, sc35 speckles, nucleolus, etc.) gives insight into functional nuclear organization 35. Hence, we selected the nucleolus as largest sub-nuclear compartment to address the relative positioning of individual alleles and whether any parental bias occurs. We labeled the alleles of the loci studied above by SNP-CLING, and used the rRNA-GFP system for live cell staining of nucleoli in female 129S1/CAST MEFs (see methods, Figure 3a).
Figure 3. Allelic distances to the nucleoli or to the nuclear periphery.
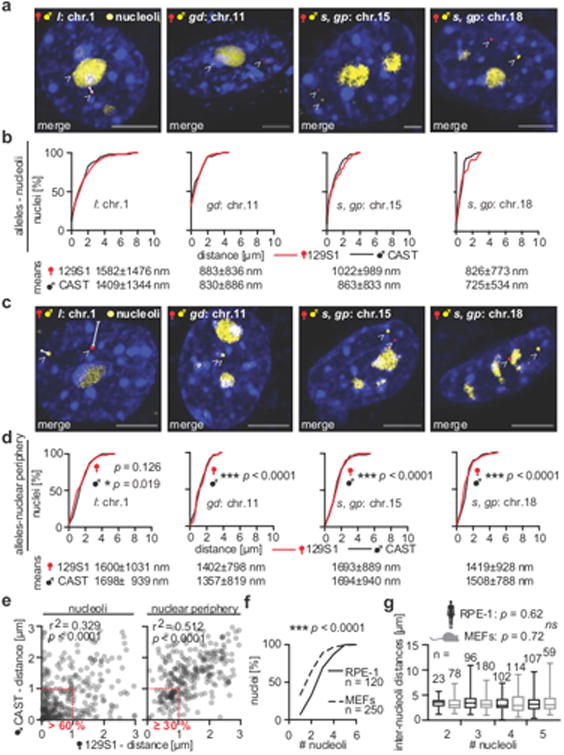
(a) Examples of merged images demonstrate positioning of the studied alleles (arrowheads: red = PP7-mCherry, yellow = MS2-mVenus), and the nucleoli (rRNA-GFP) in 129S1/CAST MEFs (scale bars = 5 μm, n = 5). (b) Similar allelic distances and distributions of loci to the nucleoli (means ± SD), between 129S1 and CAST alleles in 129S1/CAST MEFs (normalized to nuclei sizes, each combination > 80 nuclei). (c) Examples of loci-nuclear periphery measurements (see panel a, n = 6, arrowheads = SNP-CLING foci). (d) Allelic distances and distributions of loci to the nuclear periphery were similar between 129S1 or CAST alleles (each combination > 80 nuclei). Allelic distances of the studied loci to the nucleoli (means ± SD) were significantly smaller, than their distances to the nuclear periphery (two-tailed Mann Whitney rank sum testing, * p < 0.05, *** p < 0.0001). (e) Spearman correlations of all allelic distances to the nucleoli (n = 620 alleles, r2 = 0.329, *** p < 0.0001) or to the nuclear periphery (r2 = 0.512, *** p < 0.0001). 61 % of 129S1 or 64 % CAST inherited loci were closer than 1 μm to the nucleolus. 35 % of 129S1 or 30 % of CAST loci were closer than 1 μm to the periphery. (f) Number of nucleoli counted in human RPE-1 or MEFs was higher in MEFs (two-tailed Mann Whitney rank sum testing, *** p < 0.0001). (g) Similar inter-nucleoli distances in human RPE-1 or MEFs (Kruskal-Wallis multiple comparisons testing [not adjusted], ns = not significant, medians with 25th to 75 th percentiles, min/max, and sample sizes [n] are depicted, RPE-1 CIlower = 3.02-3.31 μm, CIupper = 3.67-3.99 μm, MEFs CIlower = 3.06-3.35 μm, CIupper = 3.63-4.7 μm).
By measuring distances between the alleles and the nucleoli, we determined that among each locus, the distributions and distances between 129S1 and CAST alleles to the nucleoli were highly similar (Figure 3b). We also measured distances of the individual alleles to the nuclear periphery (Figure 3c), and found that the distributions of allelic distances to the nuclear periphery were also highly similar between 129S1 and CAST backgrounds (Figure 3d). This observation is consistent with the finding that the tested loci are quite stable in their relative nuclear positioning and not randomly organized, nor undergoing random motion in the nucleus.
In order to assess if every locus exhibits a unique nuclear positioning, we compared the allele-nucleoli distances with the allele-nuclear periphery distances. Notably, both, the maternal 129S1 or paternal CAST alleles were significantly closer to the nucleoli than to the nuclear periphery (* p < 0.05, p *** < 0.001, Figure 3d). The alleles of the chromosome 18 locus were the closest to the nucleoli, followed by the alleles of the loci on chromosome 11, 15, and 1 (Figure 3d). Collectively, these results indicate that alleles of the tested loci have preserved and stable locations, yet each locus occupies unique nuclear positions relative to the nucleolus.
We also addressed how often and close alleles are in the perinucleolar space of all 129S1 and CAST alleles, independently of the tested locus. Therefore, we re-analyzed the allele-nucleoli distances that were acquired from above. Remarkably, 61 % of 129S1, or 64 % of CAST alleles were closer than 1 μm to the nucleoli (Figure 3e, n = 620 alleles). With regards to the distances to the nuclear periphery, 35 % of 129S1 and 30 % of CAST alleles were closer than 1 μm (Figure 3e), suggesting a similar distance distribution of parental alleles to either the nucleoli or the periphery. Distances of CAST alleles to the nucleoli or nuclear periphery correlated with the distances of the 129S1 alleles (Figure 3e, *** p < 0.0001, Spearman's, nucleolus: r2 = 0.329; nucleus border: r2 = 0.512).
Since multiple nucleoli exist within different cell types 36, we counted the number of nucleoli and measured their distances to each other. Inter-nucleoli distances assess whether sub-nuclear positioning is altered when multiple nucleoli occur. We found a range of 1-6 nucleoli, but more nucleoli in MEFs (average = 3), than in RPE-1 cells (average = 2.2, *** p < 0.0001, Figure 3f). The inter-nucleoli distances were highly similar independent of the number of nucleoli (Figure 3g), suggesting that nucleoli positioning may also be a stable feature in the nucleus and conserved between human and mouse.
Taken together, we demonstrate that SNP-CLING can be used to label alleles in conjunction with sub-nuclear organelles. Our findings support the notion that irrespective of genetic backgrounds (129S1/CAST), the spatial positioning of the studied alleles was similar and preserved in interphase architecture and often close to the nucleoli.
Firre's positioning and its inter-allelic interactions
The human lncRNA FIRRE locus has previously been shown to associate with the nucleolar periphery by FISH in fixed cells 37. Therefore, we questioned if there were differences in nucleolar positioning to those loci explored above. To this end, we measured spatial distances of FIRRE (MS2-mCherry), and GAPDH (PP7-mCherry) as a control locus, to their closest nucleoli (Figures 4a, S5). Consistent with the results in fixed cells 37, we detected that FIRRE is closer to the nucleolar periphery with an average locus-nucleolus distance of 1189±1291 nm, while GAPDH was 1744±1508 nm distal from the nucleolus (*** p < 0.0001, Figure 4a).
Figure 4. Firre's positioning and its inter-allelic interactions.
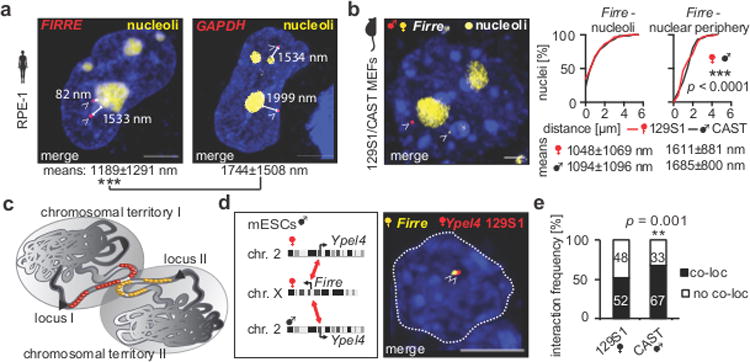
(a) Example of CLING-labeled FIRRE loci (arrowheads: red = PP7-mCherry, 108 nuclei) and their distances to the closest nucleolus (rRNA-GFP) in female RPE-1 cells (scale bars = 5 μm). Loci-nucleoli distances revealed that FIRRE was closer to the perinucleolar space than GAPDH (107 nuclei, two-tailed Mann-Whitney rank sum test, *** p < 0.0001). (b) Example of maternal and paternal Firre alleles (arrowheads) in female 129S1 (yellow = MS2-mVenus), CAST (red = PP7-mCherry) MEFs. Firre's allelic distances to the nucleoli (129S1 CI = 0.77-1.32 μm, CAST CI = 0.81-1.38 μm) or to the nuclear periphery (80 nuclei, means ± SD, 129S1 CI = 1.38-1.84 μm, CAST CI = 1.48-1.89 μm). Firre was closer to the nucleoli than to the nuclear periphery (two-tailed Mann Whitney rank sum test, *** p < 0.0001). (c) Scheme of interacting loci between two non-homologous chromosomes in spatial proximity, targeted by SNP-CLING or CLING. (d) SNP-CLING of maternal 129S1-derived Firre (yellow = MS2-mVenus) with either Ypel4-129S1 or Ypel4-CAST (red = PP7-mCherry) in male mESCs (n = 8, arrowheads = SNP-CLING foci). (e) Allele-biased interaction of Firre with the paternal Ypel4-CAST locus (** p = 0.0012, Χ2-test, each quantification > 130 nuclei, n = 5) in male 129S1/CAST mESCs.
Since FIRRE is perinucleolar in many nuclei, we next asked if there was an allele-specific bias in Firre's positioning, that would be suggestive of a three-dimensional imprinting mechanism. To this end, we labeled maternal (129S1; MS2-mVenus) or paternal Firre (CAST; PP7-mCherry) and quantified Firre-nucleoli distances in female 129S1/CAST MEFs (Figure 4b). We found that either one of the alleles (maternal in 60 % of nuclei, paternal in 63 % of nuclei), or both alleles (47 % of nuclei), were closer than 1 μm to the nucleoli (average 1048±1096 nm [129S1], 1094±1096 nm [CAST], Figure 4b). Consistent with our previous findings, both Firre alleles were closer to the nucleoli than to the nuclear periphery (*** p < 0.0001, Figure 4b). The mean distance of Firre and the other tested loci to the nucleoli was 1019±1036 nm. Both human and mouse FIRRE loci were frequently perinucleolar without any allelic bias (Figure 4b). These findings indicate preserved genomic positioning of Firre with low cell-to-cell variability, independent of the inherited genetic background.
Having resolved that SNP-CLING can identify allelic positioning, we next investigated its feasibility to measure cross-chromosomal interactions of two genomic loci in live cells, that could also be indicative of a three-dimensional “imprinting mechanism”, for example maternal-maternal cross-chromosomal interactions. To this end, we focused on the previously described interaction of Firre (chr. X) with Ypel4, a locus on the non-homologous chromosome 2 (Figure 4c) 16. We targeted maternal Firre (129S1; MS2-mVenus) and either maternal or paternal Ypel4 (PP7-mCherry), and quantified Firre-Ypel4 co-localizations in male 129S1/CAST mESCs (Figure 4d, S5a, each combination > 130 nuclei). Signals were deemed to be co-localized as mono-allelic or bi-allelic interactions if observed at less than 50 nm spatial distance (see methods). We identified co-localizations between Firre and the 129S1-Ypel4 allele in 52 % of the nuclei and CAST-Ypel4-Firre interactions in 67 % of nuclei (** p = 0.0012), confirming previous FISH results 16. Thus, there is a slight, but significant skewing of the parental origin for cross-chromosomal interactions, that can be identified using SNP-CLING (Figure 4d).
Firre alleles are stably positioned over time
Thus far, the temporal properties of alleles could not have been assessed by traditional imaging (i.e. DNA-FISH) or molecular methods (3C → Hi-C). Since SNP-CLING can detect allele-specific locus properties over time (4D), we selected to study FIRRE's temporal positioning relative to the nucleolus by performing time-lapse imaging. To accomplish this aim, we tracked signals and calculated the three-dimensional coordinates of the FIRRE alleles relative to the nucleolus over time (Figure 5a, see methods). First, to establish 4D-imaging and to examine if these loci remain in the perinucleolar space through time, we monitored FIRRE or GAPDH relative to the nucleoli in RPE-1 cells, where each locus was tracked for a total of ∼4.5 hours (Table S2). Consistent with our results of 3D allele positioning (Figure 4), we obtained similar results when studying FIRRE's positioning across time. FIRRE was close to the perinucleolar space, whilst GAPDH was more distant (Figure 5b). Moreover, FIRRE remained at the perinucleolar space over time, while GAPDH showed higher spatiotemporal variations in its positioning (Figure 5b, ** p < 0.001).
Figure 5. Firre's allelic positioning over time.
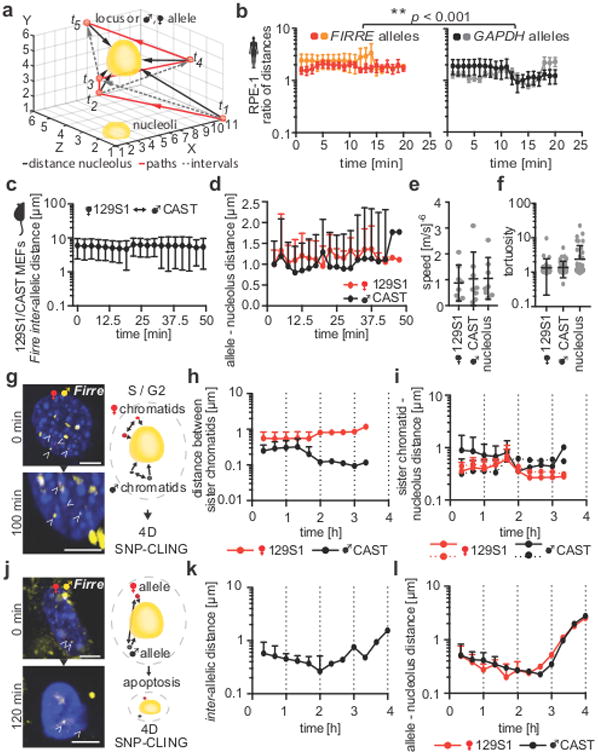
(a) Scheme of 4D-imaging: individual distances, paths, and intervals of tracked signals (locus or allele) over time to address spatiotemporal loci dynamics. (b) Ratios of loci-nucleoli distances of FIRRE (n = 9) and GAPDH (n = 7) in RPE-1 cells over time. FIRRE was closer to the perinucleolar region than GAPDH (** p < 0.001, two-tailed Mann-Whitney rank sum test, means ± SEM, individual samples Figure S6a). (c) 4D-SNP-CLING: inter-allelic distances between maternal (129S1) and paternal (CAST) Firre alleles are stable over time in MEFs (means ± SD, n = 8, individual samples Figure S6b). (d) Allelic distances of maternal or paternal Firre alleles to the center of their closest nucleolus over time in MEFs (means ± SD, n = 8, individual samples Figure S6c). (e) Average speed (means ± SD, individual data points, n = 8) and (f) tortuosity (three-dimensional changes in direction) of Firre 4D-SNP-CLING in 129S1/CAST MEFs (means ± SD, individual data points, n = 64). (g) Example of 4D-SNP-CLING detecting sister-chromatids of Firre (arrowheads) during S-G2 phase and scheme of measured inter-chromatid distances and distances to the closest nucleolus (scale bar = 5 μm, n = 3). (h) Distances between chromatids over time (means ± SD, 3 cells, individual samples Figure S6d) and (i) their distances to the nucleolus in 129S1/CAST hybrid MEFs (means ± SD, 3 cells, individual samples Figure S6e). (j) 4D-SNP-CLING example and scheme of a cell undergoing apoptosis (scale bar = 5 μm, n = 5, arrowheads = SNP-CLING foci of maternal and paternal Firre alleles). (k) Inter-allelic distances (means ± SD, 5 cells, individual samples Figure S6f) and (l) Firre distances to the nucleolus showed more fluctuations in apoptotic 129S1/CAST hybrid MEFs over time (means ± SD, 5 cells, individual samples Figure S6g).
To address how alleles behave over time in the three-dimensional space of the nucleus, we further performed allele-specific 4D-SNP-CLING of the maternal and paternal Firre alleles for up to 4.5 hours in 129S1/CAST hybrid MEFs (Table S2). First, we measured inter-allelic distances between the maternal 129S1-Firre and paternal CAST-Firre alleles. We detected that the distance between the alleles was stable on average over time (Figure 5c). This finding recapitulates our results that alleles are stably positioned in the three-dimensional space of the nucleus across time.
Next, by measuring spatiotemporal distances as described above, we addressed how the Firre alleles are positioned in relation to the nucleoli over time. Either of the maternal or paternal Firre alleles was equally distant to its closest nucleolus (Figure 5d). We also determined average speed and tortuosity (three-dimensional directional changes in space), and detected neither differences between the alleles, nor in comparison to the nucleolus (Figure 5e-f). Our data indicate preserved and stable spatiotemporal allele positioning.
Allele-specific spatiotemporal dynamics in cell cycle stages and state transitions
The question of how cell-cycle and apoptotic actions re-organize the genome and influence allelic positioning has not been investigated in live cells thus far. To address this, we used serum-starvation of 129S1/CAST hybrid MEFs and then induced the cell-cycle or apoptosis by serum exposure prior to imaging to provoke changes of the mitotic stage, or to induce apoptosis 38. In extended time-lapse experiments (up to 4 hours per nucleus, Table S2), we measured Firre's allelic distances to the nucleoli across space and time, as described above. We separated the acquired datasets of 4D-SNP-CLING in living cells in two groups. First, we analyzed time-lapses where we observed allele-specific signals from the sister chromatids, indicating S-G2 phases (Figure 5g). We determined that Firre's inter-chromatid distances and the distances of each chromatid to the closest nucleolus were on average stable over time (Figure 5h-i), suggesting that replication does not have a major impact on spatial repositioning of loci.
In our second group of time-lapse experiments we analyzed cells undergoing apoptosis, implicating major genomic re-organization by chromatin condensation (Figure 5j) 38. As far as we were able to track stable signals successfully, we determined that the inter-allelic distances increased over time towards the point where apoptosis was visually detectable by condensed, non-patterned chromatin (Figure 5j-k). Moreover, the allele-nucleoli distances fluctuated much more, especially at later time points (Figure 5l). These findings suggest that apoptosis-mediated changes of the genome organization cause locus re-positioning by dissolving and separating the nucleoli from alleles. Altogether, these results indicate that genomic re-organization affects allelic re-positioning and that SNP-CLING can be used to study conformational changes during mitotic and apoptotic stages of the nucleus. Importantly, 4D-SNP-CLING is a versatile tool that can specifically discern spatiotemporal allele positioning in relation to sub-nuclear compartments in various fields of cell biology.
Discussion
Several studies have shown that distinct gene positioning is crucial for gene regulation and molecular pathogenesis 9,34,39. Yet, most of our current understanding derives from the average of both homologous chromosomes and does not have the resolution for spatiotemporal assessment of specific allele positioning. This important aspect allows us moving forward in understanding how chromosomal aberrations on one allele affect nuclear organization. SNP-CLING provides a solution to this knowledge gap by detecting allelic characteristics in live cells that yield insight into gene regulation and nuclear architecture.
The applications of SNP-CLING cover a wide-range of biological questions, including allele-specific studies to evaluate distances of genomic interactions in fixed and in living cells, spatiotemporal gene positioning in relation to cellular or nuclear sub-compartments 40, epigenetic phenomena like imprinting 41, karyotyping, or allele-specific transcriptional control (SNP-CLING with smRNA-FISH) 42. SNP-CLING facilitates testing these genomic identities by using heterozygous SNPs, and the multiplexable CRISPR-Cas9 sgRNA-aptamer system to label individual DNA loci with unique aptamer-binding fluorescent proteins.
We applied SNP-CLING to address a key question of how alleles on different chromosomes are positioned relative to one another and to nuclear sub-compartments such as the nucleolus which has not yet been tractable in a facile manner, especially in live cells. We tested two possible outcomes: (i) alleles are moving in a random motion in the nucleus and would exhibit significantly different distances from each other, the nucleolus and or other chromosomes (3 color SNP-CLING); or (ii) alleles are stably positioned in space and time relative to each other, other chromosomes and or the nucleolus.
To distinguish between these two possibilities, we selected alleles on chromosomes with different features of size and gene density, and observed that their inter-allelic distances were mostly similar, either in relation to one another, or to other loci. Although individual alleles are stably positioned in space and time, different chromosomes have unique positions. These findings are consistent with results of fixed cells and the chromosome territory models 5,7,43. We also found that allele positions are preserved and similar in live cells, irrespective of the genetic backgrounds (129S1/CAST) in 3D- and 4D-imaging. We further tested how these properties are maintained during the cell-cycle and state transition. We find that the individual allele positions indicate that every studied locus has a unique position, that remains stable, even when mitotic or apoptotic conformational changes re-organize the chromatin (Figures 2, 3 and 5). Similar results were obtained by studying chromosomal territories, where each territory showed a unique pattern with minor differences between homologous chromosomes in fixed cells 29. A broader analysis is required to dissect the characteristic chromosomal features of size, gene density 9, transcriptional activity 44, local chromatin states and protein recruitment 5,43, and whether or not they directly influence allele positioning proportional to the spatial order of whole chromosomes.
Remarkably, the majority (> 60 %) of the studied alleles were positioned at discrete sub-nuclear positions around the perinucleolar space (Figure 3e). Particularly, we detected that the studied alleles are equally positioned proximal to the nucleoli with unique distances for each locus and in the case of Firre, both alleles stayed stably associated with the nucleoli across time. Therefore, it is plausible that structural chromosomal rearrangements encompassing these loci can alter their constrained and preserved allele positions and contribute to disease 8,9,18,45.
We also demonstrated that SNP-CLING can assess inter-chromosomal contacts in live cells. Firre displayed a slight allelic skewing for its cross-chromosomal interaction with Ypel4 (Figure 4e). However, further studies are required to assess whether allele-biased interactions between non-homologous chromosomes are common and stable, as in the case of the Firre-Ypel4 cross-chromosomal contact. Our finding may support the idea that a deterministic parental-origin grouping of haploid chromosomes and allele-specific interactions may exist across chromosomes, but not across alleles of the same chromosome.
In summary, allele-specific SNP-CLING is designed for dissecting nuclear architecture phenomena at allele-specific resolution across space, through time, and in relation to other loci or sub-nuclear compartments. SNP-CLING and CLING are easily applicable and versatile tools which will shed new light on the contribution of genome architecture to congenital disease and cancer that are often linked to allele-specific aneuploidy and heterozygous chromosomal aberrations 45,46. Further characterization of spatial and temporal properties of allele-specific alterations occurring in disease will provide significant insight into the genetic, genomic and structural features underlying nuclear architecture.
Online Methods
Cell lines
hTERT RPE-1 cells (ATCC) 26, C28/I2 chondrocytes 27, 129S1-SvImJ x CAST-EiJ hybrid 2-3 mESCs 47, or 129S1/CAST MEFs were PCR-tested for mycoplasma contamination (LookOut, SigmaAldrich). MEFs were isolated with standard procedures from 129S1-SvImJ x CAST-EiJ mouse strains. Animals were handled according to the Harvard University IACUC guidelines (protocol AEP 11-13).
SNP selections in human or mouse PAM motifs
We downloaded hg19 and mm10 assemblies and masked repetitive elements using repeat mask (http://www.repeatmasker.org). We looked for all instances where a SNP annotated in dbSNP database (versions 147 for human and 142 for mouse) disrupted the PAM sequence 5′-NRG-3′ either in sense or antisense orientation in the corresponding assembly.
sgRNA design for CLING and SNP-CLING
Non-repetitive genomic regions several kilobases upstream or downstream of the target genes to avoid interference with transcription were selected in hg19 or mm10 UCSC Genome Browser. These regions served as input to design sgRNAs (http://www.broadinstitute.org/rnai/public/analysis-tools/sgrna-design-v1),48. Four highly specific sgRNAs with sgRNA scores around 1 and low off-target scores were chosen and aligned back to the reference genome using BLAT (UCSC) to determine specificity. Flanking BbsI restriction sites were used to ligate sgRNAs with a backbone expressing either three MS2, or three PP7, or six Puf1 motifs (Addgene #68426, #68424), 19. mCherry or mVenus fluorescent proteins were expressed as fusion proteins with either MS2 or PP7 binding proteins (Addgene #68420), independent of dCas9 (Addgene #68416). All combinations of three of the four sgRNAs were pooled after endotoxin-free MAXI preparations to test off-target binding in confocal microscopy (Figure S5). The sgRNA pools with the most specific signals and reduced off-target binding effects were used for super-resolution microscopy. Three sgRNAs, each with three RNA stem-loops for the RNA-binding proteins bound fluorescent protein dimers, resulting in a specific CLING-signal derived from 18 molecules (Figure 4c, Table S1).
For SNP-CLING, genomic regions were selected in MGI browser (http://www.informatics.jax.org) and heterozygous SNPs were extracted for the 129S1-SvImJ x CAST-EiJ hybrid cells. The SNP-CLING selection was made based on heterozygous SNPs at the 2nd or 3rd position of the PAM sequence (5′-NRG-3′). Substitutions from ‘R’ to ‘C’ or ‘T’ concerning the 2nd PAM-nucleotide or substitutions from ‘G’ to ‘A’ or ‘C’ or ‘T’ for the 3rd PAM-nucleotide were selected either for the 129S1-SvImJ or the CAST-EiJ allele. The heterozygous state of the SNPs was validated by Sanger-sequencing. A list of sgRNA sequences can be found in Table S1.
mESC culture
Male 129S1-SvImJ × CAST-EiJ hybrid 2-3 mESCs 47, were grown on 0.2% gelatinized petri-dish in 2i media [125 ml DMEM-F12 (ThermoFisher Scientific, #11330-032), 125 ml Neurobasal Medium (ThermoFisher Scientific, #21103-049), 1.25 ml NDiff Neuro-2 Medium Supplement 200x (Millipore, #SCM012), 83.5 μl 7.5 % BSA Fraction V (ThermoFisher Scientific, #15260-037), 2.5 ml B-27 Supplement 50x minus vitamin A (ThermoFisher Scientific, #12587-010), 1 μl B β-mercaptoethanol, 25 μl PD0325901 (Stemgent, #04-0006), 75 μl CHIR99021 (Stemgent, #04-0004), 25 μl LIF ESGRO (107 units LIF/ml stock) (Chemicon, #ESG1106), 1 % penicillin-streptomycin (ThermoFisher Scientific, #15140-163), 1 % non-essential amino acids (ThermoFisher Scientific, #11140-076), and 1 % L-glutamine (ThermoFisher Scientific, #25030-164)]. Media was changed daily. Cells were grown at 37 °C at 5 % CO2 and passaged every 3-4 days with TrypLE (Thermo Fisher Scientific, #12604039).
Transient transfections
0.6×10⁵ hTERT RPE-1 cells were seeded 48 h 26, or 1.5×10⁵ C28/I2 chondrocytes 27, were seeded 12 h prior to 48 h transfections into each well of a 2-well LabTek chamber slide (ThermoFisher Scientific, #155380) in DMEM-F12 (1:1, ThermoFisher Scientific, # 10565-018) with 10% FBS and 1 × penicillin-streptomycin supplements. 1.25×10⁵ hybrid 129S1/CAST MEFs were seeded 48 h before 48 h transfections in ATCC's DMEM with 10 % FBS, 1 × L-glutamine, and 1 × penicillin-streptomycin supplements. Per reaction, 1.5 μl Lipofectamine 3000 reagent (ThermoFisher Scientific, # L3000008) were mixed with 23.5 μl Opti-MEM® I Reduced Serum Medium (ThermoFisher Scientific, # 31985-062). A total of 25 μl Opti-MEM® I Reduced Serum Medium with 375 ng pooled gRNAs, 500 ng fluorescent protein, 625 ng dCas9 (Adggene) and 4.75 μl P3000 reagent were incubated with the Lipofectamine mix for 5 min at room temperature. For serum starvation experiments to induce mitosis or apoptosis, MEFs were seeded in complete medium, transfected under serum-free conditions, and re-adapted to ATCC's DMEM with 20 % FBS, 2 × L-glutamine, and 1 × penicillin-streptomycin supplements 14 - 22 hours prior to imaging.
3×10⁵ hybrid 129S1/CAST mESCs were seeded per well of a 0.2 % gelatinized μ-Slide 2-well ibiTreat plate (Ibidi, #80286) 24 h prior to 48 h transfections. 1.25×10⁵ hybrid 129S1/CAST MEFs were seeded per well of a LabTek chamber slide. Transient transfections were performed with Lipofectamine 3000 according to manufacturer's protocol using 4 μl of Lipofectamine 3000 reagent per 2150 ng DNA. For CLING-imaging, a transfection mix containing 400 ng of dCas9, 500 ng of each fluorescent protein, and 375 ng of the sgRNA pool was used. Media was changed 24 h post transfection and cells were imaged 48 hours post transfection.
Prior to imaging, the medium was changed to FluoroBrite™ DMEM Media ThermoFisher Scientific, # A1896701), and 1 drop NucBlue® Live ReadyProbes® Reagent (ThermoFisher Scientific # R37605) was added to stain the nuclei. A 1:2500 dilution of the CytoPainter Nucleolar Staining Kit (Abcam, # ab139475) according to the manufacturer instructions was used to stain the nucleoli. After a 10 minute incubation at 37°C, 5 % CO2, the cells were washed twice with PBS and prepared for imaging as described above. None of the studied loci were observed inside the nucleoli.
Confocal super-resolution microscopy (Airyscan)
The LSM880 with Airyscan (Zeiss) and the incubation module at 37°C and 5% CO2 were used to visualize all experiments in this project. A 32-channel gallium arsenide phosphide photomultiplier tube (GaAsP-PMT) area detector (Airyscan) collects a pinhole-plane image at every scan position. The Airyscan detector system enhances sensitivity 4-8 times and resolution beyond the diffraction limit of light of up to 1.7 times (~130 nm) compared to standard confocal microscopy 49. For all acquisitions, ∼5-10× less laser power was used when compared to standard confocal microscopy. The ZEN black edition software version 2 (Zeiss) was used for acquisition. All shown images were acquired in super-resolution (SR) mode with 16 bit, 0.17 μm z-slices, and fitted zoom level, whereas quantification experiments were done in resolution-vs.-sensitivity (R-S) mode with 8 bit and 0.25 – 0.3 μm z-slices to increase imaging speed. The oil immersion objective Plan-Apochromat 63×/1.4 oil DIC M27 was used for all acquisitions. If the edges of foci were closer than <1 voxel distance to each other which corresponded to <50 nm3, this distance represented the smallest measurable volume (distance) in the three-dimensional space by combination of CLING and Airyscan microscopy. For the quantifications of co-localization events, CLING-signals were either merged or overlapping (<50 nm distance, see below) in contrast to distinctly separated signals (>50 nm distance), indicating no co-localization.
4D time-lapse imaging
The conditions for time-lapses, acquired in resolution-vs.-sensitivity (R-S) mode with 8 bit and 0.27-0.45 μm z-slices to minimize the acquisition time, were set up in the experiment designer (ZEN black edition version 2) with delay blocks (breaks) of either 70 seconds or 20 minutes between every z-stack, favoring reduced fading or phototoxic effects. The time intervals and features of the 4D-experiments are given in the supplement.
Post-processing and analyzing imaging data
The Airyscan super-resolution raw data were de-convoluted and processed in ZEN black edition version 2.1 (release version 11.0, Zeiss). Maximum intensity projections (MIP) were used to merge the z-stacks and to intensify the signals. Pixel intensity display settings were automatically and manually optimized with a ‘linear best-fit analysis’ applied to the entire field of view of each channel separately in ZEN blue edition (Zeiss). Using the voxel centers, distance measurements were done in ZEN editions, and in arivis Vision4D version 2.12 and 2.11 software. Inter-nucleoli distances were measured between each nucleolar center, whilst loci-nucleoli distances were measured from each SNP-CLING signal (voxel center) to its closest nucleolus. All measurements were normalized to the nuclei sizes (x-y dimensions). To measure the minimal distance between two non-co-localizing signals, the distance between the signal edges was measured in ZEN software. The smallest unit was one pixel, according to approximately ∼50 nm. If this one-pixel distance was not clearly determined, the signals were considered as co-localization. All images were exported as non-compressed TIFF images.
The raw data of 4D time-lapses were processed and inspected for signal integrity over time in ZEN black edition. Datasets with insufficient and dim signals due to photo-bleaching effects at later time-points were cropped. The adjusted post-processed time-lapse datasets were then imported in arivis Vision4D version 2.12 and 2.11 software. CLING-signals were selected according to their appearance in every first and last plane of every time frame and exchanged by artificial centroids representing the raw-signals to simplify visualization. Three-dimensional coordinates were calculated dependent on the position of the centroid's center representing the raw CLING-voxel's center. Hoechst nuclei staining was visualized with the “skin” default setting in Vision4D v2.11. Ratios of distances were calculated based on the distance measurements between signals. For normalization, all signals were divided by the mean distance of signals at time-point 1 of every time-lapse experiment. The plotted values shown are means (±SEM or ±SD) of all signals.
Statistical analysis
Signals for every experiment were quantified in z-stacks of 80-100 nuclei. Additional numbers (n) of experiments or analyzed nuclei, or alleles, are mentioned in the manuscript or in the figure legends. Significance was determined by non-parametrical two-tailed Wilcoxon-Mann-Whitney rank sum testing, by two-tailed Student's T-test or Χ2-test (*** p < 0.0001, ** p < 0.01, * p < 0.05). Box plots show medians, 25th to 75th percentiles, and min-to-max. Plots and statistics were either generated in GraphPad Prism version 6.00, or in MATLAB R2015b (MathWorks).
Data availability
The datasets of spatial distances analyzed during the current study (figures 2-5) are available from the corresponding authors on reasonable request. A Life Sciences Reporting Summary for this article is available.
Supplementary Material
Acknowledgments
We thank all Rinn laboratory members for thoughtful discussions and intellectual input. The study was supported by U01 DA040612-01, P01 GM09911, HHMI Faculty Scholars Program (J.L.R), and the ‘Deutsche Forschungsgemeinschaft (DFG)’, supported P.G.M (MA5028/1-3 and MA5028/1-1). Mary B. Goldring (Weill Cornell Medical College, New York City, NY) kindly provided C28/I2 cells. We thank Sven Terclavers (Zeiss) and Douglas Richardson (Harvard Center for Biological Imaging, HCBI, Cambridge, MA) for their support optimizing Airyscan microscopy, Jordan P. Lewandowski (Harvard University) for generating 129S1/CAST MEFs, and Jesse Engreitz (Broad Institute, Cambridge, MA) for providing 129S1/CAST mESCs.
Footnotes
Author contributions: P.G.M. & J.L.R. conceived the study. P.G.M. performed the experiments and wrote the manuscript with J.L.R & A.R.B. C.L.W. performed the mESC experiments, M.M. analyzed the availability of suitable SNP-CLING SNPs, and D.M.S. provided intellectual input and plasmids.
Competing financial interests: The authors declare no competing financial interests.
References
- 1.Dekker J. Two ways to fold the genome during the cell cycle: insights obtained with chromosome conformation capture. Epigenetics Chromatin. 2014;7:25. doi: 10.1186/1756-8935-7-25. [DOI] [PMC free article] [PubMed] [Google Scholar]
- 2.Lupianez DG, et al. Disruptions of topological chromatin domains cause pathogenic rewiring of gene-enhancer interactions. Cell. 2015;161:1012–25. doi: 10.1016/j.cell.2015.04.004. [DOI] [PMC free article] [PubMed] [Google Scholar]
- 3.Dixon JR, et al. Chromatin architecture reorganization during stem cell differentiation. Nature. 2015;518:331–6. doi: 10.1038/nature14222. [DOI] [PMC free article] [PubMed] [Google Scholar]
- 4.Gorkin DU, Leung D, Ren B. The 3D genome in transcriptional regulation and pluripotency. Cell Stem Cell. 2014;14:762–75. doi: 10.1016/j.stem.2014.05.017. [DOI] [PMC free article] [PubMed] [Google Scholar]
- 5.Jost KL, et al. Gene repositioning within the cell nucleus is not random and is determined by its genomic neighborhood. Epigenetics Chromatin. 2015;8:36. doi: 10.1186/s13072-015-0025-5. [DOI] [PMC free article] [PubMed] [Google Scholar]
- 6.Chubb JR, Boyle S, Perry P, Bickmore WA. Chromatin motion is constrained by association with nuclear compartments in human cells. Curr Biol. 2002;12:439–45. doi: 10.1016/s0960-9822(02)00695-4. [DOI] [PubMed] [Google Scholar]
- 7.Kumaran RI, Spector DL. A genetic locus targeted to the nuclear periphery in living cells maintains its transcriptional competence. J Cell Biol. 2008;180:51–65. doi: 10.1083/jcb.200706060. [DOI] [PMC free article] [PubMed] [Google Scholar]
- 8.Meaburn KJ, Gudla PR, Khan S, Lockett SJ, Misteli T. Disease-specific gene repositioning in breast cancer. J Cell Biol. 2009;187:801–12. doi: 10.1083/jcb.200909127. [DOI] [PMC free article] [PubMed] [Google Scholar]
- 9.Ferrai C, de Castro IJ, Lavitas L, Chotalia M, Pombo A. Gene positioning. Cold Spring Harb Perspect Biol. 2010;2:a000588. doi: 10.1101/cshperspect.a000588. [DOI] [PMC free article] [PubMed] [Google Scholar]
- 10.Franke M, et al. Formation of new chromatin domains determines pathogenicity of genomic duplications. Nature. 2016;538:265–269. doi: 10.1038/nature19800. [DOI] [PubMed] [Google Scholar]
- 11.Weise A, et al. POD-FISH: a new technique for parental origin determination based on copy number variation polymorphism. Methods Mol Biol. 2010;659:291–8. doi: 10.1007/978-1-60761-789-1_22. [DOI] [PubMed] [Google Scholar]
- 12.Beliveau BJ, et al. Single-molecule super-resolution imaging of chromosomes and in situ haplotype visualization using Oligopaint FISH probes. Nat Commun. 2015;6:7147. doi: 10.1038/ncomms8147. [DOI] [PMC free article] [PubMed] [Google Scholar]
- 13.Giorgetti L, et al. Predictive polymer modeling reveals coupled fluctuations in chromosome conformation and transcription. Cell. 2014;157:950–63. doi: 10.1016/j.cell.2014.03.025. [DOI] [PMC free article] [PubMed] [Google Scholar]
- 14.Darrow EM, et al. Deletion of DXZ4 on the human inactive × chromosome alters higher-order genome architecture. Proc Natl Acad Sci U S A. 2016;113:E4504–12. doi: 10.1073/pnas.1609643113. [DOI] [PMC free article] [PubMed] [Google Scholar]
- 15.Hoffman EA, Frey BL, Smith LM, Auble DT. Formaldehyde crosslinking: a tool for the study of chromatin complexes. J Biol Chem. 2015;290:26404–11. doi: 10.1074/jbc.R115.651679. [DOI] [PMC free article] [PubMed] [Google Scholar]
- 16.Hacisuleyman E, et al. Topological organization of multichromosomal regions by the long intergenic noncoding RNA Firre. Nat Struct Mol Biol. 2014;21:198–206. doi: 10.1038/nsmb.2764. [DOI] [PMC free article] [PubMed] [Google Scholar]
- 17.Abe Y, et al. Xq26.1-26.2 gain identified on array comparative genomic hybridization in bilateral periventricular nodular heterotopia with overlying polymicrogyria. Dev Med Child Neurol. 2014;56:1221–4. doi: 10.1111/dmcn.12553. [DOI] [PubMed] [Google Scholar]
- 18.Maass PG, et al. A misplaced lncRNA causes brachydactyly in humans. J Clin Invest. 2012;122:3990–4002. doi: 10.1172/JCI65508. [DOI] [PMC free article] [PubMed] [Google Scholar]
- 19.Shechner DM, Hacisuleyman E, Younger ST, Rinn JL. Multiplexable, locus-specific targeting of long RNAs with CRISPR-Display. Nat Methods. 2015;12:664–70. doi: 10.1038/nmeth.3433. [DOI] [PMC free article] [PubMed] [Google Scholar]
- 20.Chao JA, Patskovsky Y, Almo SC, Singer RH. Structural basis for the coevolution of a viral RNA-protein complex. Nat Struct Mol Biol. 2008;15:103–5. doi: 10.1038/nsmb1327. [DOI] [PMC free article] [PubMed] [Google Scholar]
- 21.Shcherbakova DM, Verkhusha VV. Near-infrared fluorescent proteins for multicolor in vivo imaging. Nat Methods. 2013;10:751–4. doi: 10.1038/nmeth.2521. [DOI] [PMC free article] [PubMed] [Google Scholar]
- 22.Filipovska A, Razif MF, Nygard KK, Rackham O. A universal code for RNA recognition by PUF proteins. Nat Chem Biol. 2011;7:425–7. doi: 10.1038/nchembio.577. [DOI] [PubMed] [Google Scholar]
- 23.Cheong CG, Hall TM. Engineering RNA sequence specificity of Pumilio repeats. Proc Natl Acad Sci U S A. 2006;103:13635–9. doi: 10.1073/pnas.0606294103. [DOI] [PMC free article] [PubMed] [Google Scholar]
- 24.Anders C, Niewoehner O, Duerst A, Jinek M. Structural basis of PAM-dependent target DNA recognition by the Cas9 endonuclease. Nature. 2014;513:569–73. doi: 10.1038/nature13579. [DOI] [PMC free article] [PubMed] [Google Scholar]
- 25.Doench JG, et al. Optimized sgRNA design to maximize activity and minimize off-target effects of CRISPR-Cas9. Nat Biotechnol. 2016;34:184–91. doi: 10.1038/nbt.3437. [DOI] [PMC free article] [PubMed] [Google Scholar]
- 26.Bodnar AG, et al. Extension of life-span by introduction of telomerase into normal human cells. Science. 1998;279:349–52. doi: 10.1126/science.279.5349.349. [DOI] [PubMed] [Google Scholar]
- 27.Goldring MB, et al. Interleukin-1 beta-modulated gene expression in immortalized human chondrocytes. J Clin Invest. 1994;94:2307–16. doi: 10.1172/JCI117595. [DOI] [PMC free article] [PubMed] [Google Scholar]
- 28.Nora EP, et al. Spatial partitioning of the regulatory landscape of the X-inactivation centre. Nature. 2012;485:381–5. doi: 10.1038/nature11049. [DOI] [PMC free article] [PubMed] [Google Scholar]
- 29.Sehgal N, et al. Large-scale probabilistic 3D organization of human chromosome territories. Hum Mol Genet. 2016;25:419–36. doi: 10.1093/hmg/ddv479. [DOI] [PMC free article] [PubMed] [Google Scholar]
- 30.Cremer T, Cremer M. Chromosome territories. Cold Spring Harb Perspect Biol. 2010;2:a003889. doi: 10.1101/cshperspect.a003889. [DOI] [PMC free article] [PubMed] [Google Scholar]
- 31.Williams SR, et al. Haploinsufficiency of HDAC4 causes brachydactyly mental retardation syndrome, with brachydactyly type E, developmental delays, and behavioral problems. Am J Hum Genet. 2010;87:219–28. doi: 10.1016/j.ajhg.2010.07.011. [DOI] [PMC free article] [PubMed] [Google Scholar]
- 32.Beagrie RA, et al. Complex multi-enhancer contacts captured by genome architecture mapping. Nature. 2017;543:519–524. doi: 10.1038/nature21411. [DOI] [PMC free article] [PubMed] [Google Scholar]
- 33.Shopland LS, Johnson CV, Byron M, McNeil J, Lawrence JB. Clustering of multiple specific genes and gene-rich R-bands around SC-35 domains: evidence for local euchromatic neighborhoods. J Cell Biol. 2003;162:981–90. doi: 10.1083/jcb.200303131. [DOI] [PMC free article] [PubMed] [Google Scholar]
- 34.Edelman LB, Fraser P. Transcription factories: genetic programming in three dimensions. Curr Opin Genet Dev. 2012;22:110–4. doi: 10.1016/j.gde.2012.01.010. [DOI] [PubMed] [Google Scholar]
- 35.Lamond AI, Spector DL. Nuclear speckles: a model for nuclear organelles. Nat Rev Mol Cell Biol. 2003;4:605–12. doi: 10.1038/nrm1172. [DOI] [PubMed] [Google Scholar]
- 36.Shea JR, Jr, Leblond CP. Number of nucleoli in various cell types of the mouse. J Morphol. 1966;119:425–33. doi: 10.1002/jmor.1051190404. [DOI] [PubMed] [Google Scholar]
- 37.Yang F, et al. The lncRNA Firre anchors the inactive × chromosome to the nucleolus by binding CTCF and maintains H3K27me3 methylation. Genome Biol. 2015;16:52. doi: 10.1186/s13059-015-0618-0. [DOI] [PMC free article] [PubMed] [Google Scholar]
- 38.Kulkarni GV, McCulloch CA. Serum deprivation induces apoptotic cell death in a subset of Balb/c 3T3 fibroblasts. J Cell Sci. 1994;107(Pt 5):1169–79. doi: 10.1242/jcs.107.5.1169. [DOI] [PubMed] [Google Scholar]
- 39.Morimoto M, Boerkoel CF. The role of nuclear bodies in gene expression and disease. Biology (Basel) 2013;2:976–1033. doi: 10.3390/biology2030976. [DOI] [PMC free article] [PubMed] [Google Scholar]
- 40.Thul PJ, et al. A subcellular map of the human proteome. Science. 2017;356 doi: 10.1126/science.aal3321. [DOI] [PubMed] [Google Scholar]
- 41.Chess A. Monoallelic Gene Expression in Mammals. Annu Rev Genet. 2016;50:317–327. doi: 10.1146/annurev-genet-120215-035120. [DOI] [PubMed] [Google Scholar]
- 42.Cui C, Shu W, Li P. Fluorescence In situ Hybridization: Cell-Based Genetic Diagnostic and Research Applications. Front Cell Dev Biol. 2016;4:89. doi: 10.3389/fcell.2016.00089. [DOI] [PMC free article] [PubMed] [Google Scholar]
- 43.Wijchers PJ, et al. Cause and Consequence of Tethering a SubTAD to Different Nuclear Compartments. Mol Cell. 2016;61:461–73. doi: 10.1016/j.molcel.2016.01.001. [DOI] [PMC free article] [PubMed] [Google Scholar]
- 44.Peric-Hupkes D, et al. Molecular maps of the reorganization of genome-nuclear lamina interactions during differentiation. Mol Cell. 2010;38:603–13. doi: 10.1016/j.molcel.2010.03.016. [DOI] [PMC free article] [PubMed] [Google Scholar]
- 45.Lupianez DG, Spielmann M, Mundlos S. Breaking TADs: How Alterations of Chromatin Domains Result in Disease. Trends Genet. 2016;32:225–37. doi: 10.1016/j.tig.2016.01.003. [DOI] [PubMed] [Google Scholar]
- 46.Wijchers PJ, de Laat W. Genome organization influences partner selection for chromosomal rearrangements. Trends Genet. 2011;27:63–71. doi: 10.1016/j.tig.2010.11.001. [DOI] [PubMed] [Google Scholar]
Methods-only References
- 47.Doench JG, et al. Rational design of highly active sgRNAs for CRISPR-Cas9-mediated gene inactivation. Nat Biotechnol. 2014;32:1262–7. doi: 10.1038/nbt.3026. [DOI] [PMC free article] [PubMed] [Google Scholar]
- 48.Engreitz JM, et al. The Xist lncRNA exploits three-dimensional genome architecture to spread across the × chromosome. Science. 2013;341:1237973. doi: 10.1126/science.1237973. [DOI] [PMC free article] [PubMed] [Google Scholar]
- 49.Huff J. The Airyscan detector from ZEISS: confocal imaging with improved signal-to-noise ratio and super-resolution. Nat Methods. 2015;12:i–ii. [Google Scholar]
Associated Data
This section collects any data citations, data availability statements, or supplementary materials included in this article.
Supplementary Materials
Data Availability Statement
The datasets of spatial distances analyzed during the current study (figures 2-5) are available from the corresponding authors on reasonable request. A Life Sciences Reporting Summary for this article is available.