

Abstract
An important aspect of below-ground crop physiology is its root foraging performance, which is inherently related to root system architecture (RSA). A 2-yr field experiment was conducted and the field-state wheat RSA was phenotyped for root foraging trait (RFT). Four RSA-derived traits, i.e. Root horizontal angle (RHA), axial root expansion volume (AREV), RSA convex hull volume (CHV) and effective volume per unit root length (EVURL), were analyzed for RFTs in response to environment × management interactions. Results showed a dynamical RHA process but without statistical difference both within crop seasons and tillage treatments. AREV increased with root developmental stages, revealing an overall better root performance in the first year. However, tillage treatments did not induce observed difference within both crop seasons. CHV varied drastically from year to year and between tillage treatments, correlating well to the root length, but not with RHA. EVURL was both sensitive to tillage treatments and crop seasons, being a potential indicator for RFT. Above all, tillage effect on RFT was statistically far less than that induced by crop seasons. Pro/E assisted modeling can be used as an effective means for phenotyping integrated, RSA-derived, RFTs for root foraging response to induced environment × management interactions.
Introduction
The performance of a field crop is governed by the integrated effects of its structural, physiological and genetically mediated traits being quantified as nutrient status, yield potential and foraged soil volume etc. Quantification of field crop traits both requires a large number of scenarios to be considered1 and a range of phenotyping tools dedicating to multiple scales and specific organic components of crop responding to the environments. Among which, root foraging capacity depends on root system architecture2.
Root system architecture (RSA), the spatial arrangement of the root and its components3, is generally described at three distinctive levels, i.e. the topology level, the geometry level and the root segment level4–6, serving as an overall transcription of the process of root-soil interplay in the field environment. The topology implicitly describes the root system as a network, or skeleton, of a root system. The geometry of a root system explicitly describes the physical position of component root axes. While the root segments can be characterized by their properties, such as local root diameter, color and the presence or absence of root hairs7. Being a key component to water and nutrient acquisition, field crop RSA varies between and within species, and also subject to environment changes8. However, ‘this hidden half’ is difficult to interpret9.
Implicitly or explicitly, RSA was evaluated at sub-topology level of crop roots, e.g. root length, number, positioning, and angle of root components3. However, these sub-topological root quantifications could not effectively explain the overall developmental dynamics and root foraging traits (RFTs). RSA was more reasonably defined as the spatial distribution, age, and identity of all roots from a single plant10. Under the light of this definition, RFT should be more preferably related to the foraged soil volume. And thus the phenotyping of root responses to the prevailing environments, a key focus for field crop physiologies, could possibly be made with RSA-derived indices.
Despite the established implications of RFT from root distribution in soil profile and the application of it for quantifying soil heterogeneity11,12, it would be more meaningful to monitor RSA-derived indices and to quantify RFT and its interaction with the surrounding environment from the dynamics of RSAs. While the mass-based or length-related indices (e.g., root allocation, root foraging scale, root foraging precision, root foraging rate)13, would be less emphasized.
In foraging the soil, field crops implement several well-established developmental plans, e.g. hydrotropism and gravitropism. The synergetic effects from genetic control and environmental modification are integrated into root decisions regarding how fast and in which direction to grow, and where and when to initiate new roots14. This ability of a field crop to adjust its RSA is defined as root plasticity15, an important strategic trait of plant in coping with the large variety of abiotic conditions in field16. Understanding the developmental and architectural plasticity of RSA thus holds great potential for stabilizing productivity under suboptimal environmental conditions10,17,18.
Field-based phenotyping of RFTs, or plant phenotyping methods in general, applicable for plant phenomes still lags greatly behind19. Despite the expectation of improved productivity gains from optimized RSA20, this goal is hampered by the low resolution and low throughput approaches for characterizing crop RSA10. Even the extraction of the entire root system from soil could be an impeding factor for field-based phenotyping of RSA16. Therefore, a number of efforts were made to transfer phenotyping techniques from controlled environments to in-field phenotyping19,21,22.
The aim of this research was thus to investigate what RSA-derived indices could be made from the field-state wheat root systems and how these parameters could be used for quantifying RFT under the governing mechanisms by the environment × management interactions.
Results
Largely varied meteorological processes occurred in the two crop seasons (Fig. 1). Overall precipitation and relative humidity in 2010–2011 was higher than 2011–2012, yet the annual mean temperature of the first crop season was less than the second. The stochasticity of meteorological data also implies that no replicative environmental factors could be controlled within the field experiment.
Figure 1.
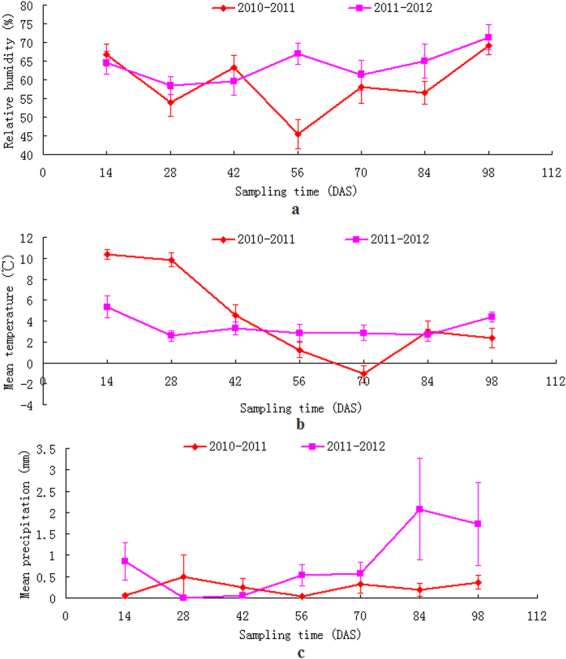
Meteorological processes during wheat growth period.
RHA dynamics
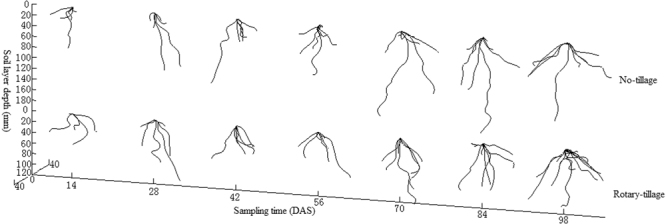
Apparent variations of wheat relative horizontal angle (RHA) were observed, in different sampling time, under different tillage treatments and in different crop seasons (Fig. 2). But the deviation of this variation was not large, with a mean of about 52°. Statistical analysis revealed that RHA was neither co-related with RSA-derived indices (AREV, CHV and EVURL) nor with meteorological parameters (MP, RH and MT). While the T-test indicated that inter-annual meteorological difference had no significant influence on RHA of no-till wheat RSA, a marked effect was observed on the rotary tilled (P < 0.01) (Table 2). Within the same year, tillage treatments had no significant effect on RHA.
Figure 2.
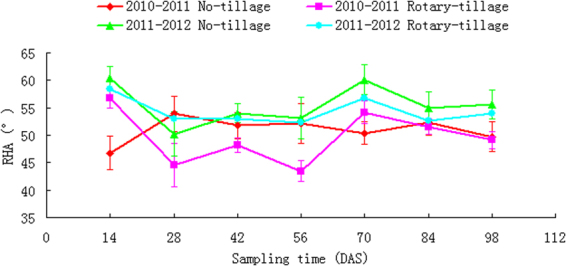
RHA dynamics under 2 tillage systems and in 2 yrs.
Table 2.
T-test of RFTs in different years.
| No-tillage | Rotary-tillage | |||||||
|---|---|---|---|---|---|---|---|---|
| RHA | AREV | CHV | EVURL | RHA | AREV | CHV | EVURL | |
| Abs(t) | 2.061 | 3.255* | 4.545** | 4.679** | 3.886** | 6.552** | 5.538** | 8.345** |
| Sig | 0.085 | 0.017 | 0.004 | 0.003 | 0.008 | 0.001 | 0.001 | 0 |
**Difference is significant at the 0.01 level (2-tailed), *Correlation is significant at the 0.05 level (2-tailed). Radius of AREV was 5 mm.
Despite overall statistical analyses, Fig. 2 also revealed two 2 large variations identified as marked deviation from and with non-overlapped error bar with other subsets, i.e. one was the sinkage in the 56 days after sampling (DAS) of the rotary-tilled wheat in the first crop season and the other a surge in the 70 DAS in the no-till wheat in the second crop season.
AREV dynamics
Plots of the axial root expansion volume (AREV) indicated an increased soil volume exploited by wheat root with respect to both sampling time and expansion scale (Fig. 3). Increased soil volume foraged by the root may imply an increased potential for water and nutrient absorption. Gahoonia and Nielsen23 asserted that increased soil volume for a root system is particularly critical for immobile nutrients. A larger foraged soil volume is generally more preferred than a small one. As thus considered in 2010–2011 overall performance of AREV under rotary till is better than no-till. But in the following year the no-till treatment performed much better. Statistical analysis revealed that, regardless of yearly difference and tillage treatments, AREV was both significantly related to AREV and CHV, with a correlation coefficient no less than 0.89 (P < 0.01) (Table 1). No significant correlation was observed between AREV and meteorological indices (MP, RH and MT). T-test also revealed significant effect of yearly difference on AREV (0.01 < P < 0.05) under no-till, and that was extremely significant (P < 0.01) under rotary tilled condition (Table 2). However, within the same year, tillage treatment had no effect on AREV dynamics (Table 3).
Figure 3.

AREV dynamics (D5: axial root expansion with 5 mm, D10: axial root expansion with 10 mm).
Table 1.
Correlation coefficients and significant levels of the relations between root foraging traits and environmental factors.
| 2010–2011 | No-tillage | Rotary-tillage | ||||||||||
|---|---|---|---|---|---|---|---|---|---|---|---|---|
| RHA | AREV | CHV | EVURL | MP | RH | MT | RHA | AREV | CHV | EVURL | ||
| No- tillage | RHA | 1 | 0.268 | 0.184 | 0.243 | 0.448 | −0.668 | −0.153 | −0.789* | — | — | — |
| AREV | 0.268 | 1 | 0.98** | 0.894** | 0.302 | 0.15 | −0.731 | — | 0.924** | — | — | |
| CHV | 0.184 | 0.98** | 1 | 0.955** | 0.178 | 0.178 | −0.785* | — | — | 0.866* | — | |
| EVURL | 0.243 | 0.894** | 0.955** | 1 | 0.063 | 0.011 | −0.867* | — | — | — | 0.699 | |
| Rotary-tillage | RHA | −0.789* | — | — | — | −0.233 | 0.61 | 0.063 | 1 | 0.083 | 0.067 | −0.133 |
| AREV | — | 0.924** | — | — | 0.464 | 0.138 | −0.629 | 0.083 | 1 | 0.988** | 0.954** | |
| CHV | — | — | 0.866* | — | 0.477 | 0.23 | −0.565 | 0.067 | 0.988** | 1 | 0.946** | |
| EVURL | — | — | — | 0.699 | −0.67 | 0.07 | −0.54 | −0.133 | 0.954** | 0.946** | 1 | |
| MP | 0.448 | 0.302 | 0.178 | 0.063 | 1 | — | — | −0.233 | 0.464 | 0.477 | −0.67 | |
| RH | −0.668 | 0.15 | 0.178 | 0.011 | — | 1 | — | 0.61 | 0.138 | 0.23 | 0.07 | |
| MT | −0.153 | −0.731 | −0.785* | −0.867* | — | — | 1 | 0.063 | −0.629 | −0.565 | −0.54 | |
| 2011–2012 | No-tillage | Rotary-tillage | ||||||||||
| RHA | AREV | CHV | EVURL | MP | RH | MT | RHA | AREV | CHV | EVURL | ||
| No- tillage | RHA | 1 | 0.056 | −0.011 | −0.008 | 0.373 | 0.494 | −0.176 | 0.882** | — | — | — |
| AREV | 0.056 | 1 | 0.988** | 0.941** | 0.19 | 0.375 | −0.386 | — | 0.954** | — | — | |
| CHV | −0.011 | 0.988** | 1 | 0.963** | 0.183 | 0.377 | −0.375 | — | — | 0.936** | — | |
| EVURL | −0.008 | 0.941** | 0.963** | 1 | 0.049 | 0.187 | −0.522 | — | — | — | 0.962** | |
| Rotary-tillage | RHA | 0.882** | — | — | — | −0.192 | 0.498 | 0.21 | 1 | −0.115 | −0.223 | −0.268 |
| AREV | — | 0.954** | — | — | 0.112 | 0.236 | −0.491 | −0.115 | 1 | 0.974** | 0.972** | |
| CHV | — | — | 0.936** | — | 0.145 | 0.237 | −0.427 | −0.223 | 0.974** | 1 | 0.987** | |
| EVURL | — | — | — | 0.962** | 0.106 | 0.086 | −0.501 | −0.268 | 0.972** | 0.987** | 1 | |
| MP | 0.373 | 0.19 | 0.183 | 0.049 | 1 | — | — | −0.192 | 0.112 | 0.145 | 0.106 | |
| RH | 0.494 | 0.375 | 0.377 | 0.187 | — | 1 | — | 0.498 | 0.236 | 0.237 | 0.086 | |
| MT | −0.176 | −0.386 | −0.375 | −0.522 | — | — | 1 | 0.21 | −0.491 | −0.427 | −0.501 | |
**Correlation is significant at the 0.01 level (2-tailed), *Correlation is significant at the 0.05 level (2-tailed), the data means Pearson correlation. Radius of AREV was 5 mm.
Table 3.
T-test of RFTs in different tillage.
| 2010–2011 | 2011–2012 | |||||||
|---|---|---|---|---|---|---|---|---|
| RHA | AREV | CHV | EVURL | RHA | AREV | CHV | EVURL | |
| Abs(t) | 0.505 | 1.306 | 0.567 | 0.904 | 1.63 | 1.605 | 1.802 | 2.302 |
| Sig | 0.632 | 0.34 | 0.591 | 0.401 | 0.154 | 0.16 | 0.122 | 0.061 |
**Difference is significant at the 0.01 level (2-tailed), *Correlation is significant at the 0.05 level (2-tailed). Radius of AREV was 5 mm.
CHV dynamics
RSA enveloped soil volume (CHV) varied dramatically from year to year and between different tillage treatments (Fig. 4). The 2010–2011 wheat seasons revealed an overall higher value in comparison with the next crop season, indicating that a 15 d earlier sowing of wheat could have significant influence on RSA performance during the whole crop seasons. In the 56 DAS of the first wheat season there was a radical drop of CHV, both for no-till and rotary-till. This is in contrast with the next wheat season, when the CHV increased moderately.
Figure 4.
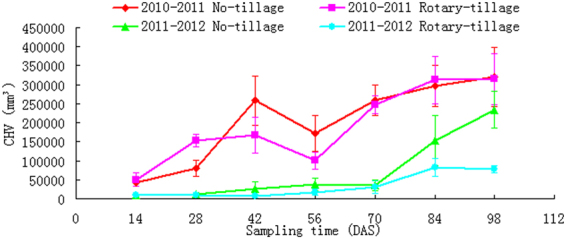
CHV dynamics in 2 tillage treatments and in 2 yrs.
Disregarding RHA and irrespective of yearly difference and tillage methods, CHV was found significantly correlated with AREV and EVURL and with correlation coefficients higher than 0.93 (P < 0.01) (Table 1). CHV had no correlationship with meteorological indices (MP, RH and MT), with only one exception in the no-till in 2010–2011 when it was significantly related with MT (correlation coefficient −0.785) (0.01 < P < 0.05). T-test revealed remarkable influence of yearly difference on CHV (P < 0.01), in both the two tillage treatments (Table 2). Whereas tillage methods within a year had no significant influence on CHV (Table 3).
EVURL dynamics
Unlike RSA dynamics, the appearances of effective volume per unit root length (EVURL) clearly differentiated root-soil interaction in both tillage treatments and crop years (Fig. 5). Not only the first year had remarkable higher EVURL values than the next year, but also the no-till EVURL out-performed the rotary-till. This means that EVURL may be a sensitive RSA parameter, which can be used for differentiating a wider range of environmental factors on wheat RSA. However, even though with these differences, tillage effect on EVURL is far less than the crop seasons (Tables 2 and 3).
Figure 5.
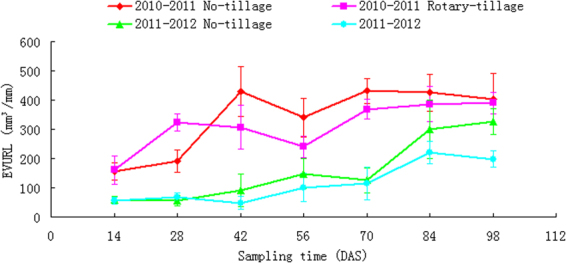
EVURL dynamics under 2 tillage systems and in 2 yrs.
Discussion
Root foraging traits in response to environment×management interactions
A plant phenotype in a specific agricultural system is considered as the result of the complex genetype × environment × management interactions20,24,25. However, unraveling these interactions is not only constrained by the time-consuming, labor intensive, and generally destructively operated approaches26, but also constrained by the poor control of the boundary conditions for field-based phenotyping of RFTs. Observed correlations among RSA-derived RFTs (Table 1, Fig. 1) indicated that there is possibility to discriminate environment × management induced RFTs with even basic controls, e.g. seasonal variation and tillage treatments. Disregarding the genetic variations, RSA-derived RFTs of wheat were both affected by alternative seasonal climate (Fig. 1, Figs 3–5) and soil management practices (soil tillage). These variations also imply that quantification of field-state crop RSA plasticity is possible with parameterized RSA-derived traits (Table 1). EVURL could particularly be applied as a stable indicator for RSA-related foraging traits in responding to the tillage system. But for yearly differences remarkable differences were observed among them (P < 0.01) (Table 2). However, as no genetic variation was made in this experiment, observed correlations of RFTs to the environment × management interactions may subject to changes.
Although phenotyping the field crop is becoming a focus of the crop research, field-based phenotyping is largely subjected to dispute. As not only the interactions among plant genomics, field environment, soil and crop management complicated the experimental design in field, but also in general the objective of a field-based phenotyping task could be inconspicuous, due mainly to a poor definition on target traits. Some researchers even stated that phenotyping for field crops could never be possibly made, because the plant phenotype is infinite, vary morphologically and molecularly over developmental time and in response to the environment27. The more we examine roots, the more complex their responses and interactions prove to be28.
The results of our work, however, supplied some insights on the root foraging responses to the induced changes of system boundary conditions. For instance AREV in the first year experienced an apparent sinkage corresponding to the 56 d period (Fig. 3), which was haply coincided with a minimum mean relative humidity, i.e. the highest degree of dry air (Fig. 1a), a period of relative low temperature (Fig. 1b) and the minimum level of periodic precipitation (Fig. 1c). In the second year, however, a local noticeable dome of AREV appeared in the 56 d period, which was also haply coincided with a period of domed mean relative humidity (Fig. 1a) and a local increase of precipitation (Fig. 1c). Past observations had revealed that differences in soil temperature and water regimes influenced root distribution in the field, as root growth was affected by both soil temperature and soil water content29,30. Furthermore, soil temperature and soil moisture were both related to air temperature and precipitation31. Unfortunately, systematic sampling of soil-related parameters were not considered in this experiment, leaving the chain effects among these interrelations unanswered.
Inter-annual comparison on CHV dynamics revealed an overall higher value in the first year as compared with the second (Fig. 4). This can be accounted for with an obvious high temperature in the initial 42 d period in the first yr when compared with the second yr (Fig. 1b). Also, mean precipitation in this period was also higher than the second yr (Fig. 1c). The overall higher value of CHV in the first yr indicated that, once an initial superiority of RSA development has been established, crop could withhold its superior soil exploitation performance also in its later developmental stages. Identified RFT correspondences to the induced changes of both soil and the environment indicated that field-based phenotyping could be applied as a means to interpret RSA responses to genetype × environment × management interactions in field.
Phenotyping the integrative traits for root foraging performance
RSA is generally defined as the spatial arrangement of the root and its components3, the quantification of which was generally made with sub-root system parameterizations (e.g., root angle or root length)32,33. In its strict sense, these ‘low-level’ parameters could not be used as the overall performance of an entire root system. Assembling the organic and tissue level parameters as a whole is therefore an important measure for ‘integrative traits’. However, these RSA level integrative traits are difficult to be assessed with traditional root research methods (e.g. soil coring). Modelling-assisted RSA analyzing provides a means to quantify root-system level foraging performances.
Recent advancement of RSA-related phenome research has promoted the provision of a number of modern tools, many of which were resorted to computer science or image processing, e.g. DART34, SmartRoot35, RootNav36, RootTrace37, RhizoScan38, RootSystemAnalyser39. As these platforms are largely varied from one to another, cross-platform protocols are needed, paving a way for inter-platform exchanges of information, e.g. archiDART package40 and RSML package6. However, most of these RSA trait-analyzing platforms were still used for sub-root system level parameters, i.e. geometrical or segmental level indices.
The difference between an analytical, sub-root system trait and integrated, RSA-derived ones could be illustrated with a comparison of RHA responses to environment × management interactions with that of others. Root angle has long been used as a principal component of RSA, being strongly associated with resource acquisition efficiency41. RHA-related foraging traits are primarily governed by plagiogravitropism42. It is also affected by soil temperature43, soil water status44, and levels of phosphorus45, nitrogen46 and soil strength42. In this study, however, RHA did not significantly vary under induced treatments, indicating the importance of integrative traits as compared with sub-system ones. Integrated traits of plants are thus more meaningful as they provide synthetic information about interactions between plant organisms and the environment47. The plant or even the population level traits explain the overall functional aspects of the root system5.
As the field-state plant growth is largely irreversible and root morphology and topology encodes a ‘morphological memory’48, RSA-derived traits provide us a cue for the interpretation of plant interactions with its environment. However, as the potentially useful crop traits are enormous, it could be a problem as how to support and counter the relative importance of each trait11,28. Nielsen et al.49 advocated the use of architectural models for integrated root performances. Our results provided a strong support to his statement, showing that Pro/E assisted modeling for RFT analyzing provides an effective means for the study of field crop physiology. The two ‘virtual’ foraging schemes implemented with Pro/E modeling, i.e. axial root expansion and RSA enveloping, quantified the dynamics of soil volume colonization by the crop root. Berntson50 used the term ‘potential’ to quantify the ability of a root system in colonizing the soil volume. Evidently increased root foraging potential with root developmental stages (Figs 3 and 4) agreed well with Fitter’s51 opinion that increased soil volume explored by the roots is a reflection of the plant’s adaptive ability to make the best use of unevenly distributed water and nutrients in soils. RSA-related traits provided us some hints about plant root strategies when they are faced with insufficient supply of soil water52.
Materials and Methods
Site description
Winter wheat (Ningmai13) was grown in a paddy field after rice in Jiangpu Experimental Farm, Nanjing Agricultural University, China. The site was located at 31°98′N, 118°59′E, in subtropical monsoon climate, with an annual rainfall of 1048.6 mm and a mean temperature of 15.8 °C53. The rice-wheat rotation is a long-established farming system in the region. The paddy season begins in June and ends up by late November. A month before rice harvesting the field was drained, allowing the soil to shift to dry state for mechanical harvesting54, following which the dryland crop season, i.e. wheat or canola, is ensued. Soil organic matter, total N, available N, available P and available K were tested to be 8.24 g∙kg−1, 0.97 g·kg−1, 12 mg∙kg−1, 12.67 mg·kg−1 and 11.05 mg∙kg−1, respectively. Soil pH, bulk density and water content were 7.6, 1.26 g∙cm−3 and 29.3%, respectively.
Experimental design
A 2 yr field experiment was conducted in the wheat season from 2010 to 2012, in which 2 tillage treatments were compared (no-till and rotary till). Seasonal variance and tillage treatments provided combined environmental conditions for RFTs of wheat. In 2010 wheat was sown in 15 November and in 2011 the wheat was sown in 30 November, both just immediately after rice harvesting. No-till is a typical conservation tillage system and rotary till is the best of the traditional tillage system55. The field experiment was laid out in three replications per treatment in a plot size of 5 m × 3 m. Wheat seeds were manually placed uniformly on the soil surface in a 5 cm × 5 cm2 grid pattern to mimic surface broadcasting, a practice of no-till seeding wheat adopted in some regions of the rice-wheat rotation, e.g. Sichuan, China56. The uniform placement of seeds also guarantees a minimised plant-to-plant interaction, which has potential effects on wheat RSA. Seeded plots were covered with a thin layer of fine soil. Phosphate, urea and potassium chloride were applied to the soil surface in an amount of 375 kg∙hm−2, 90 kg∙hm−2 and 375 kg∙hm−2, respectively. The whole wheat season was rain-fed, and the crop was managed in the same way as the local farmers do.
Root-zone soil sampling and measurement
Root soil was sampled on 14, 28, 42, 56, 70, 84 and 98 days after sowing (DAS). Two plant roots per plot (totally six plant roots per treatment) were excavated and collected in each sampling period57. Only those plants with similar height, stem diameter and ear height in the field were sampled and analyzed58.
A large soil core in 16 cm diameter and 25 cm height was positioned concentric to the base of the plant stem, and driven into the soil with a hand hammer. The core with the soil and the undisturbed wheat root system was excavated with a shovel and was brought to the laboratory for digitizing. Digitizing of wheat RSA was performed with an adapted digitizer. Laminated soil excavation (with 5 mm thickness in each layer) was performed and the exposed root segments in each layer were digitized, providing a set of polar coordinates, i.e. the radius r, the angle φ and the depth Zi. The collected data was then transferred to the Pro/E for modelling, where reconstructed virtual RSA models were analysed and parameterized59 (see Fig. 6). The released version of the software was Pro/E 2.060.
Figure 6.
3 D presentation of wheat RSA under two tillage treatments.
Root-soil parameterization with embedded algorithms in Pro/E
RSA-derived RFTs were further analysed using the algorithms embedded in the Pro/E tool box. These tools were conveniently used to calculate relative horizontal angle (RHA), axial root expansion volume (AREV), RSA convex hull volume (CHV) and effective volume per unit root length (EVURL).
Root horizontal angle
The root length or volume was computed as the sum of length or volume of all its segments. Vectors representing each segment of a root were summed up; the angle of this sum toward the horizontal plane was used as the’mean root angle’61, which was used for the direction relative to the horizontal plane and measured downwards.
RHA is the orientation of a root section with respective to the horizontal plane62. Pro/E provides a means to calculate this angle by measuring the orientation of a root section with reference to a horizontal plane (Fig. 7a). The horizontal plane containing the datum point (i.e. the seed point) was designated as a datum plane standing for the soil surface. With respect to the datum plane, a sequence of parallel reference planes were generated, each aligning along Z axis and in 10 mm distance from its neighboring ones. These planes intercepted with the virtual RSA, resulting into a series of root sections within each layer. RHA was calculated as the intersection angle between the tangent line D of the root section and the reference plane (determined by the two orientations of X and Y) in each layer (Fig. 7b). The computation was executed automatically in Pro/E with a few commanding steps (i.e., Aanlysis → Measure → Angle), followed by choosing the target root and reference plane and then Execute. The mean of all the calculated angles within a layer is the ‘mean RHA’ for this layer and the mean of all layers represents the ‘mean RHA’ of a plant.
Figure 7.

Measurement of root angle in Pro/E.
Axial root expansion volume
The mm scale region surrounding crop axial root, i.e. the rhizosphere, is the most active soil volume due to the presence of intense biological activities of both root and microbes. Root suction also induced intense hydraulic gradient within this several mm distance surrounding the root axis63. Effective distance for in-mobile nutrient absorption by the root, e.g. phosphate, is limited to 2–4 mm23. AREV is calculated from RSA model by expanding the axial roots to a certain diameter, e.g. 5 mm or 10 mm. AREV is thus a surrogate of the effectiveness of soil volume foraged by the crop root system. Pro/E supplies an algorithm to calculate AREV by ‘Variable Cross-section Scanning’. Figure 8a illustrates original wheat RSA and its related AREVs using 5 mm and 10 mm expansion scales. Once the AREVs were generated, its volume can be determined by executing the following Pro/E commands: Analysis → Measure → Volume.
Figure 8.

Root-axis-expanded soil models and enveloping soil models.
RSA convex hull volume
RSA convex hull volume (CHV) is the total soil volume exploited by a crop64, a parameter indicating the ability of a root system extending in the soil space. Analytical algorithms of Pro/E for CHV is implemented with the following steps: designating the horizontal plane containing the datum point (the seed point) as the datum plane (soil surface), generating a series of parallel planes with reference to the datum plane, being separated 10 mm apart from each other. Each plane intercepts with wheat RSA and results into a number of interceptions, i.e. datum points. The exterior datum points on each plane are used to generate a datum curve, one on each plane. A final stage is to implement a boundary blend tool on all the datum curves, which are merged and solidified to produce the CHV (Fig. 8b). Once the RSA CHV is achieved, Pro/E commands of ‘Analysis → Measure → Volume’ are executed and the volume is calculated.
Effective volume per unit root length
EVURL is defined as the ratio of RSA enveloped volume to the total root length. A lower value of EVURL indicates that the crop expends less root length for a larger soil volume occupation, thus a higher foraging efficiency.
For all the acquired data, basic statistical analysis was performed and plotted in Microsoft Excel. Correlation analysis and T-test was conducted in SPSS.
Meteorological data processing
Meteorological data corresponding to the wheat growth stages in the two years was downloaded from the local service webpage of the Weather Online and the data was divided along observation stages. Daily relative humidity, daily temperature and precipitation were averaged as the mean presentation for each stage, being used as referencing basis of the environment for the observed RFTs.
Acknowledgements
This work was supported by the State Key Special Program of Soil Fertility Improvement and Cropping Innovation for High Yield Efficiency in Rice Cropping Areas (2016YFD0300900) and Agricultural Machinery Fund of Jiangsu Province.
Author Contributions
Xinxin Chen and Qishuo Ding wrote the main manuscript text and revised it. Yinian Li and Ruiyin He improved the text and provided suggestions on the structure of the manuscript.
Competing Interests
The authors declare no competing interests.
Footnotes
Publisher's note: Springer Nature remains neutral with regard to jurisdictional claims in published maps and institutional affiliations.
References
- 1.Lynch JP, Wojciechowski T. Opportunities and challenges in the subsoil: pathways to deeper rooted crops. Journal of Experimental Botany. 2015;66(8):2199–2210. doi: 10.1093/jxb/eru508. [DOI] [PMC free article] [PubMed] [Google Scholar]
- 2.Alvarez-Flores R, Winkel T, Nguyen-Thi-Truc A, Joffre R. Root foraging capacity depends on root system architecture and ontogeny in seedlings of three Andean Chenopodium, species. Plant and Soi. 2014;380(1):415–428. doi: 10.1007/s11104-014-2105-x. [DOI] [Google Scholar]
- 3.Koevoets IT, Venema JH, Elzenga JTM, Testerink C. Roots withstanding their environment: exploiting root system architecture responses to abiotic stress to improve crop tolerance. Frontiers in Plant Science. 2016;7:1335. doi: 10.3389/fpls.2016.01335. [DOI] [PMC free article] [PubMed] [Google Scholar]
- 4.Godin C, Sinoquet H. Functional-structural plant modelling. New Phytologist. 2005;166(3):705–708. doi: 10.1111/j.1469-8137.2005.01445.x. [DOI] [PubMed] [Google Scholar]
- 5.Lynch JP. Roots of the second green revolution. Australian Journal of Botany. 2007;55:493–512. doi: 10.1071/BT06118. [DOI] [Google Scholar]
- 6.Postma JA, Lynch JP. Root cortical Aerenchyma enhances the growth of maize on soils with suboptimal availability of Nitrogen, Phosphorus, and Potassium. Plant Physiology. 2011;156(3):1190–1201. doi: 10.1104/pp.111.175489. [DOI] [PMC free article] [PubMed] [Google Scholar]
- 7.Lobet G, et al. Root system markup language: toward a unified root architecture description language. Plant Physiology. 2015;167(3):617–627. doi: 10.1104/pp.114.253625. [DOI] [PMC free article] [PubMed] [Google Scholar]
- 8.Anon How to feed a hungry world. Nature. 2010;466(7306):531–532. doi: 10.1038/466531a. [DOI] [PubMed] [Google Scholar]
- 9.Lynch JP, Brown KM. Topsoil foraging-an architectural adaptation of plants to low phosphorus availability. Plant & Soil. 2001;237(2):225–237. doi: 10.1023/A:1013324727040. [DOI] [Google Scholar]
- 10.Zhu J, Ingram PA, Benfey PN, Elich T. From lab to field, new approaches to phenotyping root system architecture. Current Opinion in Plant Biology. 2011;14(3):310–317. doi: 10.1016/j.pbi.2011.03.020. [DOI] [PubMed] [Google Scholar]
- 11.Hodge A. The plastic plant: root responses to heterogeneous supplies of nutrients. New Phytologist. 2004;162(1):9–24. doi: 10.1111/j.1469-8137.2004.01015.x. [DOI] [Google Scholar]
- 12.Robinson D. The responses of plants to non-uniform supplies of nutrients. New Phytologist. 1994;127(4):635–674. doi: 10.1111/j.1469-8137.1994.tb02969.x. [DOI] [PubMed] [Google Scholar]
- 13.Rajaniemi TK. Root foraging traits and competitive ability in heterogeneous soils. Oecologia. 2007;153(1):145–152. doi: 10.1007/s00442-007-0706-2. [DOI] [PubMed] [Google Scholar]
- 14.Malamy JE. Intrinsic and environmental response pathways that regulate root system architecture. Plant Cell & Environment. 2005;28(1):67–77. doi: 10.1111/j.1365-3040.2005.01306.x. [DOI] [PubMed] [Google Scholar]
- 15.Valladares F, Gianoli E, Gómez JM. Ecological limits to plant phenotypic plasticity. New Phytologist. 2007;176(4):749–763. doi: 10.1111/j.1469-8137.2007.02275.x. [DOI] [PubMed] [Google Scholar]
- 16.Smith S, Smet ID. Root system architecture: insights from Arabidopsis and cereal crops. Philosophical Transactions of The Royal Society B Biological Sciences. 2012;367(1595):1441–1452. doi: 10.1098/rstb.2011.0234. [DOI] [PMC free article] [PubMed] [Google Scholar]
- 17.de Dorlodot S, et al. Root system architecture: opportunities and constraints for genetic improvement of crops. Trends Plant Science. 2007;12(10):474–481. doi: 10.1016/j.tplants.2007.08.012. [DOI] [PubMed] [Google Scholar]
- 18.Herder GD, Isterdael GV, Beeckman T, Smet I. The roots of a new green revolution. Trends Plant Science. 2010;15(11):600–607. doi: 10.1016/j.tplants.2010.08.009. [DOI] [PubMed] [Google Scholar]
- 19.Großkinsky DK, et al. Phenotyping in the fields: dissecting the genetics of quantitative traits and digital farming. New Phytologis. 2015;207(4):950–952. doi: 10.1111/nph.13529. [DOI] [PubMed] [Google Scholar]
- 20.Rogers ED, Benfey PN. Regulation of plant root system architecture: implications for crop advancement. Current Opinion in Biotechnology. 2015;32:93–98. doi: 10.1016/j.copbio.2014.11.015. [DOI] [PubMed] [Google Scholar]
- 21.Araus JL, Cairns JE. Field high-throughput phenotyping: the new crop breeding frontier. Trends in Plant Science. 2014;19(1):52–61. doi: 10.1016/j.tplants.2013.09.008. [DOI] [PubMed] [Google Scholar]
- 22.Langridge P, Reynolds MP. Genomic tools to assist breeding for drought tolerance. Current Opinion in Biotechnology. 2015;32:130–135. doi: 10.1016/j.copbio.2014.11.027. [DOI] [PubMed] [Google Scholar]
- 23.Gahoonia, T.S. & Nielsen, N.E. Root activity and acquisition of soil phosphorus and potassium [M]/ Root Demographics and Their Efficiencies in Sustainable Agriculture, Grasslands and Forest Ecosystems. SpringerNetherlands. pp, 331–344 (1998).
- 24.Porter JR, Christensen S. Deconstructing crop processes and models via identities. Plant Cell & Environment. 2013;36(11):1919–1925. doi: 10.1111/pce.12107. [DOI] [PubMed] [Google Scholar]
- 25.Pauli. D, et al. The quest for understanding phenotypic variation via integrated approaches in the field environment. Plant Physiology. 2016;172:622–634. doi: 10.1104/pp.16.00592. [DOI] [PMC free article] [PubMed] [Google Scholar]
- 26.Paez-Garcia A, et al. Root traits and phenotyping strategies for plant improvement. Plants. 2015;4:334–355. doi: 10.3390/plants4020334. [DOI] [PMC free article] [PubMed] [Google Scholar]
- 27.Chitwood DH, Topp CN. Revealing plant cryptotypes: defining meaningful phenotypes among infinite traits. Current Opinion in Plant Biology. 2015;24:54–60. doi: 10.1016/j.pbi.2015.01.009. [DOI] [PubMed] [Google Scholar]
- 28.Hodge A, et al. Plant root growth, architecture and function. Plant and Soil. 2009;321(1):153–187. doi: 10.1007/s11104-009-9929-9. [DOI] [Google Scholar]
- 29.Kovar JL, Barber SA, Kladivko EJ, Griffith DR. Characterization of soil temperature, water content, and maize root distribution in two tillage systems. Soil and Tillage Research. 1992;24(1):11–27. doi: 10.1016/0167-1987(92)90069-N. [DOI] [Google Scholar]
- 30.Kozlowski, T. T. & Pallardy, S. G. Environmental Regulation of Vegetative Growth[M]// Growth Control in Woody Plants. pp 195-322 (1997).
- 31.Dwyer LM, Hayhoe HN, Jlb C. Prediction of soil temperature from air temperature for estimating corn emergence. Canadian Journal of Plant Science. 1990;70(3):619–628. doi: 10.4141/cjps90-078. [DOI] [Google Scholar]
- 32.Zobel RW, Waisel Y. A plant root system architectural taxonomy: a framework for root nomenclature. Plant Biosystems. 2010;144(2):507–512. doi: 10.1080/11263501003764483. [DOI] [Google Scholar]
- 33.Postma JA, Schurr U, Fiorani F. Dynamic root growth and architecture responses to limiting nutrient availability: linking physiological models and experimentation. Biotechnology Advances. 2014;32(1):53–65. doi: 10.1016/j.biotechadv.2013.08.019. [DOI] [PubMed] [Google Scholar]
- 34.Le Bot J, et al. DART: a software to analyse root system architecture and development from captured images. Plant and Soil. 2010;326(1):261–273. doi: 10.1007/s11104-009-0005-2. [DOI] [Google Scholar]
- 35.Lobet G, Pagès L, Draye X. A novel image-analysis toolbox enabling quantitative analysis of root system architecture. Plant Physiology. 2011;157(1):29–39. doi: 10.1104/pp.111.179895. [DOI] [PMC free article] [PubMed] [Google Scholar]
- 36.Pound MP, et al. RootNav: navigating images of complex root architectures. Plant Physiology. 2013;162(4):1802–1814. doi: 10.1104/pp.113.221531. [DOI] [PMC free article] [PubMed] [Google Scholar]
- 37.French A, et al. High-throughput quantification of root growth using a novel image-analysis Tool. Plant Physiology. 2009;150(4):1784–1795. doi: 10.1104/pp.109.140558. [DOI] [PMC free article] [PubMed] [Google Scholar]
- 38.Diener, J. et al. An automated image-processing pipeline for high-throughput analysis of root architecture in openalea. 7th International Conference on Functional-Structural Plant Model. Saariselka, Finland, pp 85–87 (2013).
- 39.Leitner D, Felderer B, Vontobel P, Schnepf A. Recovering root system traits using image analysis exemplified by two-dimensional neutron radiography images of lupine. Plant Physiology. 2014;164(1):24–35. doi: 10.1104/pp.113.227892. [DOI] [PMC free article] [PubMed] [Google Scholar]
- 40.Delory BM, et al. archiDART: an R package for the automated computation of plant root architectural traits. Plant and Soil. 2016;398(1):351–365. doi: 10.1007/s11104-015-2673-4. [DOI] [Google Scholar]
- 41.Manschadi AM, Hammer GL, Christopher JT, Devoil P. Genotypic variation in seedling root architectural traits and implications for drought adaptation in wheat (Triticum aestivum L.) Plant & Soil. 2008;303(1–2):115–129. doi: 10.1007/s11104-007-9492-1. [DOI] [Google Scholar]
- 42.Nakamoto T. Plagiogravitropism of maize roots. Plant & Soil. 1994;165(165):327–332. doi: 10.1007/BF00008077. [DOI] [Google Scholar]
- 43.Nagel KA, et al. Temperature responses of roots: impact on growth, root system architecture and implications for phenotyping. Functional Plant Biology. 2009;36(10-11):947–959. doi: 10.1071/FP09184. [DOI] [PubMed] [Google Scholar]
- 44.Kato Y, Abe J, Kamoshita A, Yamagishi J. Genotypic variation in root growth angle in rice (Oryzasativa L.) and its association with deep root development in upland fields with different water regimes. Plant and Soil. 2006;287:117–129. doi: 10.1007/s11104-006-9008-4. [DOI] [Google Scholar]
- 45.Fang S, Yan X, Liao H. 3D reconstruction and dynamic modeling of root architecture in situ and its application to crop phosphorus research. The Plant Journal. 2009;60:1096–1108. doi: 10.1111/j.1365-313X.2009.04009.x. [DOI] [PubMed] [Google Scholar]
- 46.Trachsel S, Kaeppler SM, Brown KM, Lynch JP. Maize root growth angles become steeper under low N conditions. Field Crops Research. 2013;140:18–31. doi: 10.1016/j.fcr.2012.09.010. [DOI] [Google Scholar]
- 47.Pagès L, et al. Calibration and evaluation of ArchiSimple, a simple model of root system architecture. Ecological Modelling. 2014;290:76–84. doi: 10.1016/j.ecolmodel.2013.11.014. [DOI] [Google Scholar]
- 48.Trewavas A. Aspects of Plant Intelligence. Annals of Botany. 2003;92(1):1–20. doi: 10.1093/aob/mcg101. [DOI] [PMC free article] [PubMed] [Google Scholar]
- 49.Nielsen KL, Lynch JP, Jablokow AG, Curits PS. Carbon cost of root systems: an architectural approach. Plant and Soil. 1994;165:161–169. doi: 10.1007/BF00009972. [DOI] [Google Scholar]
- 50.Berntson GM. Modeling root architecture: are there tradeoffs between efficiency and potential of resource acquisition? New Phytologist. 1994;127(3):483–493. doi: 10.1111/j.1469-8137.1994.tb03966.x. [DOI] [Google Scholar]
- 51.Fitter, A.H. 11—Architecture and Biomass Allocation as Components of the Plastic Response of Root Systems to Soil Heterogeneity. Exploitation of Environmental Heterogeneity by Plants. 305–323 (1994).
- 52.Ketipearachchi KW, Tatsumi J. Local fractal dimensions and multifractal analysis of the root system of legumes. Plant Production Science. 2000;3(3):287–295. doi: 10.1626/pps.3.289. [DOI] [Google Scholar]
- 53.Zhang J, et al. Effect of stratified rotary tillage on paddy soil physical properties. Journal of Nanjing Agricultural University. 2015;38(6):1016–1022. [Google Scholar]
- 54.Flinn JC, Khokhar BB. Temporal determinants of the productivity of rice-wheat cropping systems. Agricultural Systems. 1989;30(3):217–233. doi: 10.1016/0308-521X(89)90088-7. [DOI] [Google Scholar]
- 55.Ozpinar S, Ozpinar A. Tillage effects on soil properties and maize productivity in western Turkey. Archives of Agronomy & Soil Science. 2015;61(7):1029–1040. doi: 10.1080/03650340.2014.978302. [DOI] [Google Scholar]
- 56.Li CS, Tang YL, Wu C, Huang G. Effect of sowing patterns on growth, development and yield formation of wheat in rice stubble land. Transactions of the CSAE. 2012;28(18):36–43. [Google Scholar]
- 57.Wu J, Pagès L, Wu Q, Yang B, Guo Y. Three-dimensional architecture of axile roots of field-grown maize. Plant and Soil. 2015;387(1):363–377. doi: 10.1007/s11104-014-2307-2. [DOI] [Google Scholar]
- 58.Trachsel S, Kaeppler SM, Brown KM, Lynch JP. Shovelomics: high throughput phenotyping of maize (Zea mays L.) root architecture in the field. Plant and Soil. 2011;341(1-2):75–87. doi: 10.1007/s11104-010-0623-8. [DOI] [Google Scholar]
- 59.Sun, J.H. & Duan, D.G. Advanced function application and programming. Beijing, Tsinghua University press. (2003).
- 60.Studio of Erdai LZ. Pro/engineer Wildfire 2.0 Senior Design. Beijing Publishing House of Electronic Industry. (2005).
- 61.Batschelet E. Circular Statistics in Biology. The Quarterly Review of Biology. 1983;24(58):702–703. [Google Scholar]
- 62.Danjon F, Sinoquet H, Godin C, Colin F, Drexhage M. Characterization of structural tree root architecture using 3D digitising and AMAPmod software. Plant and Soil. 1999;211(2):241–258. doi: 10.1023/A:1004680824612. [DOI] [Google Scholar]
- 63.Bramley H, Turner NC, Turner DW, Tyerman SD. Comparison between gradient-dependent hydraulic conductivities of roots using the root pressure probe: the role of pressure propagations and implications for the relative roles of parallel radial pathways. Plant Cell & Environment. 2007;30(7):861–874. doi: 10.1111/j.1365-3040.2007.01678.x. [DOI] [PubMed] [Google Scholar]
- 64.Iyer-Pascuzzi AS, et al. Imaging and analysis platform for automatic phenotyping and trait ranking of plant root systems. Plant Physiology. 2010;152(3):1148–1157. doi: 10.1104/pp.109.150748. [DOI] [PMC free article] [PubMed] [Google Scholar]