Abstract
Simple leaves show unexpected growth motions: the midrib of the leaves swings periodically in association with buckling events of the leaf blade, giving the impression that the leaves are fluttering. The quantitative kinematic analysis of this motion provides information about the respective growth between the main vein and the lamina. Our three-dimensional reconstruction of an avocado tree leaf shows that the conductor of the motion is the midrib, presenting continuous oscillations and inducing buckling events on the blade. The variations in the folding angle of the leaf show that the lamina is not passive: it responds to the deformation induced by the connection to the midrib to reach a globally flat state. We model this movement as an asymmetric growth of the midrib, which directs an inhomogeneous growth of the lamina, and we suggest how the transition from the folded state to the flat state is mechanically organized.
Keywords: plant movement, plant motion, leaf growth, mechanosensitivity, buckling, three-dimensional tracking
1. Introduction
1.1. Background
Since Gerardus Mercator, cartographers have learned that flattening the world on a map is a complicated task involving non-trivial geometrical distortions. Similar problems are encountered by leaves during their development: initially curved they unfold to reach flatness, which is advantageous both for optimizing light capture and for decreasing the resistance of their surface to the wind. Flatness is reached owing to an autonomous process of finely tuned growth, which has been barely studied. In fact, most of the quantitative studies on the growth of leaves have neglected curvature, considering the leaves to be flat [1–4]. Very few studies have then focused on the movement that leaves display in space during their growth. And yet, during their expansion, these leaves present many different motions. Plant motions have long been observed—as early as before the common era by Androsthenos of Thasos [5] and later extensively described by Darwin [6]. Some can be grouped as mature sudden movements [7–9] that recently attracted the interest of physicists because they are extremely quick, for example the dramatic fly trap snapping [10] or the striking catapulting of ferns' spores [11]. They can also be just at the human time scale, such as the long-studied sensitive plants [12]. On a slower time scale, plants also exhibit many motions that are related to their growth and circadian rhythm [6,13,14]. The origins of these movements are still debated, as is the relation between the movement and the shape of the plant organ itself. Among them, the growth motions of leaves are of particular interest because of their ecological importance as the leaves' shape and positioning are crucial to optimize their light capture and minimize their resistance to wind. Here, based on our measurements, we propose that these growth movements might be of importance in the mechanisms by which the leaf finally becomes flat.
1.2. The growth of leaves
The development of the primordium, protruding out of the stem surface near the apical meristem, comes with two broken symmetries: proximal/distal and adaxial/abaxial. The first main central vein expands, and a lamina develops on both sides. The broken adaxial/abaxial symmetry, which will result in the top and bottom surface asymmetry of the leaf (respectively), is first visible with an asymmetrical development of the veins, which is more intense on the abaxial part. The geometry of the free space around the developing leaf induces different packing strategies and shapes [15]. A common one, as in the case of the avocado tree leaf, is to fold in two with a flat lamina folded around a curved central vein. During its expansion outside the bud, the leaf will present globally some inverse adaxial growth, curving the leaf in the opposite direction and opening the lamina before eventually reaching a final flat straight state, typically in 10 days (see electronic supplementary material, video S1). During this growth, the leaf also presents more rapid movements, with typically a circadian rhythm, and also quicker movements of particular interest: the leaf curves back and forth across its midrib and flutters its blade accordingly. We have observed these movements on a wide range of plants; for example, the oak tree, hazelnut, citrus and many tropical plants (http://www.msc.univ-paris-diderot.fr/plant-dynamics/selection/selectionmov.html), including our case study: the avocado tree Persea americana. In this paper, we will characterize this phenomenon and investigate the physical mechanisms involved in this widespread motion.
1.3. Question
The growing leaf is a composite object, made of epithelia, mesophyll and veins. As already mentioned, the main veins can develop considerably and protrude out of the abaxial surface, creating the folding in the bud state [16]. In the blade, mechanical constraints between the various elements have been proposed to explain the creation and the geometry of the reticular vein networks and in particular their connection angles [17]; and these lignified veins are ascribed to be the mechanical support of the leaf. The differential growth of the blade along its own surface has also been recognized as the origin of undulating leaf borders [18,19], and of the particular shape of petals [20]. In evolutionary terms, flower petals are believed to be modified leaves [21]. Their motions have recently been found to originate from blade growth [22]. Other leaf motions, such as rolling and unrolling, have been explained also by the variation in the double curvature of the blade [23]; in these cases, the motion could also be ascribed to the effect of the dense parallel veins in the leaf blade. In the case of avocado, as for the common case of simply folded in two leaves, only the central vein protrudes, and we can consider the leaf as made mostly of a roughly cylindrical midrib (which could itself be viewed as a composite beam [24]) and two symmetric quasi-two-dimensional surfaces (the blade or lamina) attached to it. In this framework, the role of secondary veins is ‘absorbed’ in the lamina. The two growth effects, of the lamina and the midrib, are potentially effective in leaf development [25].
The main aim of this study was to understand the interplay of these two growths in the development of the leaf and in generating the motions of leaves.
In the following, we first detail our experimental method and results. Then we present three toy models representing three different limit cases. Finally, we use these toy models to discuss the experimental results.
2. Material and methods
2.1. Experiment
We focused on the leaf of the avocado tree. Avocado leaves are typical of simple leaves and they display strong and characteristic movements. The analysis was made easier by the fact that this organ is large (many centimetres) and can be observed over several days of development, with a large growth ratio (approx. 10). Typical time scales from the emergence of the new leaf to maturity were approximately two weeks. Leaves were marked a few days after emerging by a grid (made up typically of 100 or more markers spaced by approx. 5 mm) of red fluorescent oil-based paint—the viscosity of the mix was optimized to follow the leaf during growth. The development was followed via time lapse photography. Every 15 min two snapshots were taken simultaneously from two spatially shifted cameras. The flash light was filtered in green, to protect against phototropic effects, as well as guaranteeing maximum contrast for the red markers.
2.2. Three-dimensional reconstruction
The fluorescence of the markers allowed segmentation of the image based on a colour scale. The positions of the markers were tracked separately in each two-dimensional image stack by using singular value decomposition and the Longuet–Higgins algorithm [26]. This provided at each time step the two-dimensional position of each marker i in the left camera (xli(t), yli(t)) and in the right camera (xri(t), yri(t)). Typical stereoscopic techniques are designed to first calibrate the cameras and then obtain three-dimensional positions owing to both of the two-dimensional positions obtained for each camera, and the cameras' calibration [27]. For calibration, we took different snapshots of a grid with known three-dimensional positions. Next, for each camera, we computed the camera projection matrix from the known three-dimensional scene points and the corresponding two-dimensional image points using direct linear transformation (algorithm of Trucco & Verri [28]). Finally, we performed the reconstruction from the two-dimensional positions (xli(t), yli(t), xri(t), yri(t)) and the calibration matrices by using the Kim Daesik algorithm (https://github.com/tjrantal/direct-linear-transformation/blob/master/octavetest/daesikweb/reconstruction.m) in order to get the three-dimensional coordinates (xi(t), yi(t), zi(t)).
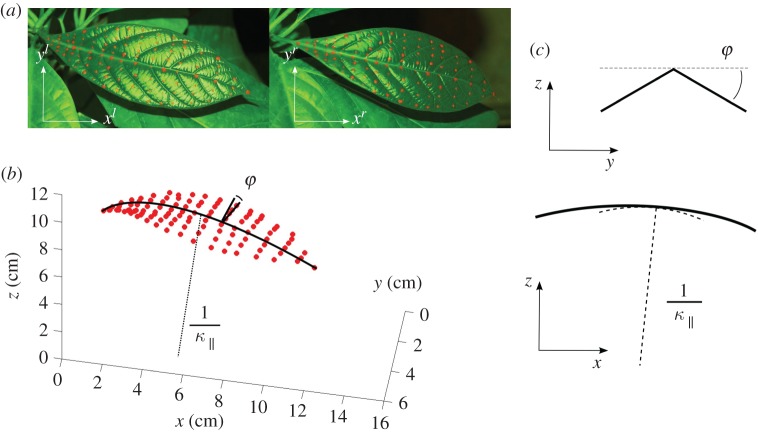
Figure 1a shows an example of the two shifted snapshots at a given time as well as the corresponding three-dimensional reconstruction of the leaf (figure 1b). See also the electronic supplementary material, video S2, for a full reconstruction with time. Full tracking and quantification of the experiment is demanding but we checked qualitatively a dozen times that the observed phenomenon is generic, and that it is also observed on many other species.
Figure 1.
Experimental set-up. (a) A typical view from the two spatially shifted cameras. (b) The corresponding three-dimensional reconstruction. We label as φ the folding angle of the blade and as κ∥ the curvature of the midrib. (c) The corresponding two-dimensional projections. (Online version in colour.)
2.3. Quantitative measurements
From the coordinates obtained from the collection of markers, we can reconstruct the geometric surface and its corresponding parameters such as local angles, local area, mean and Gaussian curvature, etc. Delaunay triangulation of our markers has defined a set of triangles whose area was monitored in order to access the local growth of the lamina as a function of time. Two other measures are of particular interest: the midrib curvature (κ∥) and the folding angle of the blade (φ). By convention, κ∥ was defined as the derivative of the local vertical angle as a function of the curvilinear abscissa going from the base to the end of the leaf. This means that a concave (respectively, convex) shape has a positive (respectively, negative) curvature. The folding angle φ indicates the deviation from the flat state, therefore it goes from 0° to 90° when the leaf goes from flat to completely folded. The sign is defined to match the curvature definition: it is positive (respectively, negative) if the leaf is folded downwards abaxially (respectively, upwards adaxially). The complementary angle to the folding angle is labelled as the opening angle. We also measured Δzg, which is the vertical position of the barycentre of the midrib, with respect to the stem, as an indication of the mean position in space. For quantification of the leaf curvature, one could use either the local curvature or the total deviation (integration of the local curvature along the object). Biologically speaking, a flat surface is useful, for example for light capture or for minimizing the surface, and it is this local property which is meaningful. Therefore, in this paper, we will define and quantify the so-called ‘flatness’ by using Gaussian curvature, which is a local property.
3. Experimental results
3.1. Global growth
Figure 2 displays the mean areal growth over the main expansion period. It shows that, even if the shape of the leaf does seem to change during this process, the average growth is rather inhomogeneous. Some parts expands much less, in particular the base, which stops growing quickly. On the contrary, the blade is developing more at the front periphery, which corresponds to a global opening of an originally folded lamina on a curved midrib.
Figure 2.
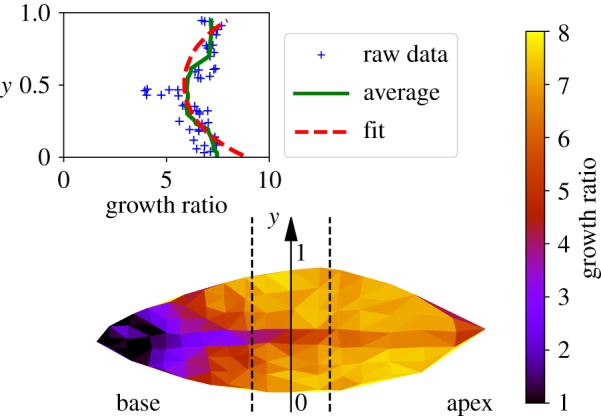
Areal growth measurement on the lamina over three weeks of development observed on the adaxial part of the leaf. For each triangle, the growth ratio (Af − A0)/A0 has been computed and plotted in colour scale, A0 and Af being, respectively, the initial and final local area of the leaf. In the inset, we plot a cross section of the growth ratio as a function of ‘y’, the transverse dimension for the central region of the lamina, delimited by the dotted lines. Each cross indicates a ‘triangle’ measurement, the green line represents the average and the dotted red line is the fit according to equation (4.3) (see Discussion). (Online version in colour.)
3.2. Swinging and fluttering
Figure 3 focuses on the typical results obtained for a given point of the midrib located in the middle of the expansion region, but note that the same behaviour is observed at the other points. Midrib local curvature and local folding angle evolution are plotted as a function of time. To put these results in perspective, we also plotted in figure 3a the averaged midrib vertical position. One sees clearly the 24 h cycle, which can be ascribed to the circadian variation of the plant's turgor pressure, plus a small perturbation during the night. On the local midrib curvature, one can see the same circadian oscillation, plus a complete oscillation during the night (which we call ‘swinging’, κ∥ changing sign). The small oscillation about the vertical position during the night can thus be ascribed to the effect of changing the leaf curvature on the average position. On the local folding angle, we observe the same oscillations as for the curvature, except that at each change of sign of the curvature we observe a jump in the angle (which we call the ‘fluterring’, φ changing sign). As qualitatively visible in the preliminary observation (see electronic supplementary material, video S1), the midrib curvature is correlated to a global change of concavity of the blade, associated with buckling events for the lamina. Every time κ∥ changes sign, the whole blade buckles with the angle φ jumping from a typical value of ±5° to its opposite. The same data (folding angle φ as a function of κ∥ along time) are plotted against each other in figure 4. This figure shows a gap in the folding angle. The essential points are first that the gap does not appear in the midrib curvature and second that κ∥ and φ otherwise vary proportionally. During the early days of leaf development when growth is more significant, movements are ampler and buckling is stronger. Conversely, when growth tails off with time, buckling becomes more difficult to achieve and eventually disappears (see electronic supplementary material, videos).
Figure 3.
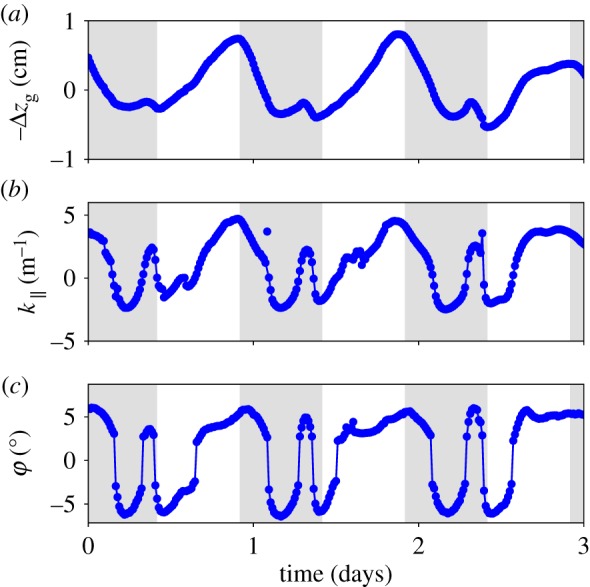
Sample of experimental data for a given point on the midrib located in the middle of the expansion region. The evolution of the mean vertical position (a), midrib curvature (b) and folding angle (c) as a function of time, for 3 days. The grey areas correspond to night-time. (Online version in colour.)
Figure 4.
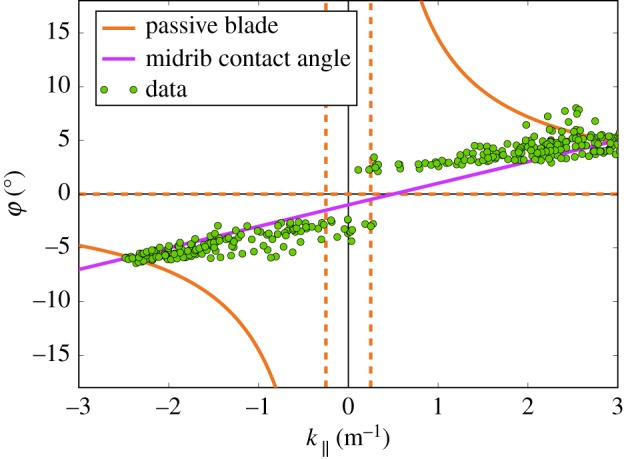
Temporal data of figure 3 (folding angle and midrib curvature) plotted against each other (single green dots). We see the opening of a buckling gap, followed by a linear regime between the two quantities in both directions. For comparison of our experimental data, we plot equation (4.1) (with  ) as the orange line and equation (4.5) (with
  and
and  ) as the violet line. (Online version in colour.)
3.3. Gaussian curvature
Figure 5 displays the Gaussian curvature computed for each marker on the lamina. The error bars indicate the natural standard deviation over the lamina. The inset shows the time period corresponding to figure 3 and more generally to the young stage of the leaf: Gaussian curvature is changing periodically while always staying significantly positive. At larger time scales, Gaussian curvature tends to a smaller and smaller value, indicating that the leaf is asymptotically going towards the flat state. Although the surface is growing in time, an estimation of the global angular deviation (defined as the integration of a typical curvature along a typical length) remains roughly constant (see electronic supplementary material, figures S19 and S20). This is only possible because the Gaussian curvature is decreasing. Note that the finite time of growth (typically approx. 20 days) does not allow perfectly zero curvature to be reached, therefore a finite but small residual Gaussian curvature remains at the end of leaf growth.
Figure 5.
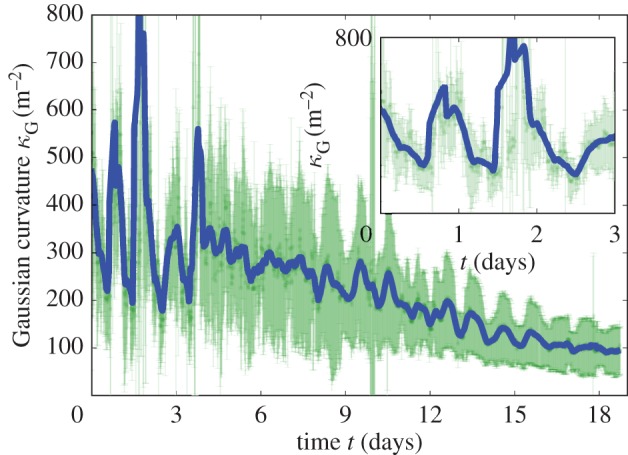
Gaussian curvature of the lamina as a function of time. Curvature has been computed for vertices all over the leaf by considering the two parts of the lamina separately in order to exclude the folding angle in the computation. The error bars in light green represent their standard deviation, while a smoothed mean is represented by the thick blue line (for raw data, see the electronic supplementary material, figure S19). The inset shows a zoom over the first three days corresponding to figure 3. (Online version in colour.)
3.4. Anisotropic growth
From our observations, it is clear that the midrib extends more in length than in width (see also electronic supplementary material, figure S10). We quantified the order of magnitude of this ‘anisotropic’ growth of the midrib as the ratio of the longitudinal strain to the orthogonal strain:  , where λ∥ and λ⊥ are the stretches in the parallel and perpendicular directions, respectively. For avocado we measured
  (λ∥∼ 7, and λ⊥∼ 1.5).
4. Toy models
To clarify the meaning of these results, we compare the development of the leaf with possible non-living unfolding mechanisms. In this section, we derive three different toy models. We investigate first the unfolding as a consequence of pure differential growth in the midrib connected to a passive lamina (model 1), then pure lamina growth (model 2) and finally an effect of eccentric growth in the midrib on the local attachment lamina angle (model 3).
4.1. Model 1: unfolding by pure differential growth without a centro-lateral gradient of in-plane growth in the lamina
In this model, the motion is induced exclusively by a gradient of growth perpendicular to the surface of the leaf (in the thickness) but with no gradient of in-plane growth. The difference in growth between the abaxial side and the adaxial side can either be localized at the vein and imposed on the lamina or localized in the lamina and imposed on the vein. The mathematical terminology for this change of shape is an isometric deformation combined with a homogeneous dilatation [29]. The leaf, which consists of two thin shells joining along a curved but planar vein, can be idealized by two surfaces connected along a planar curve, each of them lying on a different cone; for this simpler geometry, one mode of isometric deformation with homogeneous dilatation is analytically tractable and the relation of the folding angle to the midrib curvature can be computed. For thin shells, isometric modes of deformation are known to be the most economical energetically when they are possible [30,31]; such modes can be typically actuated by deforming a curve belonging to the shell, such as the midrib in the blade.
A folded leaf can be approximated by a surface with a one-parameter (ρ) family of isometric deformations Sρ, each surface being constituted by two blades Sρ,1 and Sρ,2 situated on the mirror image of two cones and meeting at the curved midrib (figure 6):
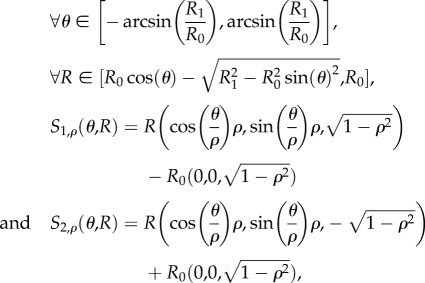 |
with R0, R1 strictly positive and ρ in ]0, 1[.
Figure 6.
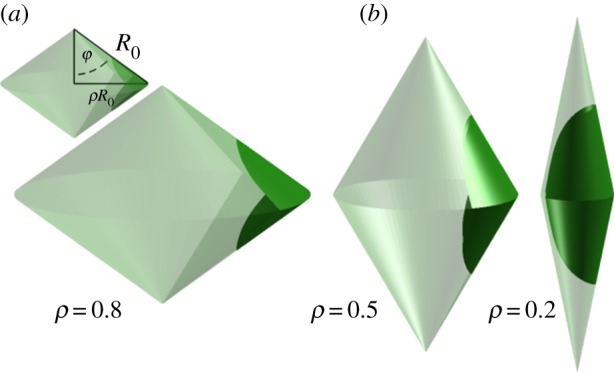
(a) (transparent surface) Mirror image of two cones; (green surface) a leaf blade; φ, folding angle; R0, radius of curvature of the vein situated between the two blades when the leaf is completely folded; ρR0, radius of curvature of the vein situated between the two blades while the leaf unfolds. (b) Successive isometric deformations on the leaf supported by different cones. (Online version in colour.)
ρ = R∥/R0 is the dimensionless parameter which quantifies the ratio between the radius of curvature of the vein situated between the two blades while the leaf unfolds (R∥) with respect to its value when the leaf is completely folded (R0). R1 is a conserved geometrical characteristic of the lamina; it corresponds to the distance between the middle point of the main vein and the boundaries of the lamina (figure 7).
Figure 7.
(a) The flat surface  and (b) the subset of sphere
  . Both surfaces are parametrized by the two parameters r and θ.
Given this framework, the folding angle (i.e. the half apical angle of the cone) φ is given by:  whereas the curvature of the vein at the junction of the blade (along the R = R0 line) is given by κ∥ = 1/(ρR0). Therefore, the folding angle reads as a function of the midrib curvature,
| 4.1 |
where κ0 = 1/R0 is the curvature of the vein when the leaf is totally folded. This relation would apply in particular to a passive lamina subjected to the anisotropic growth of the midrib.
4.2. Model 2: unfolding by a centro-lateral gradient of in-plane growth of the lamina
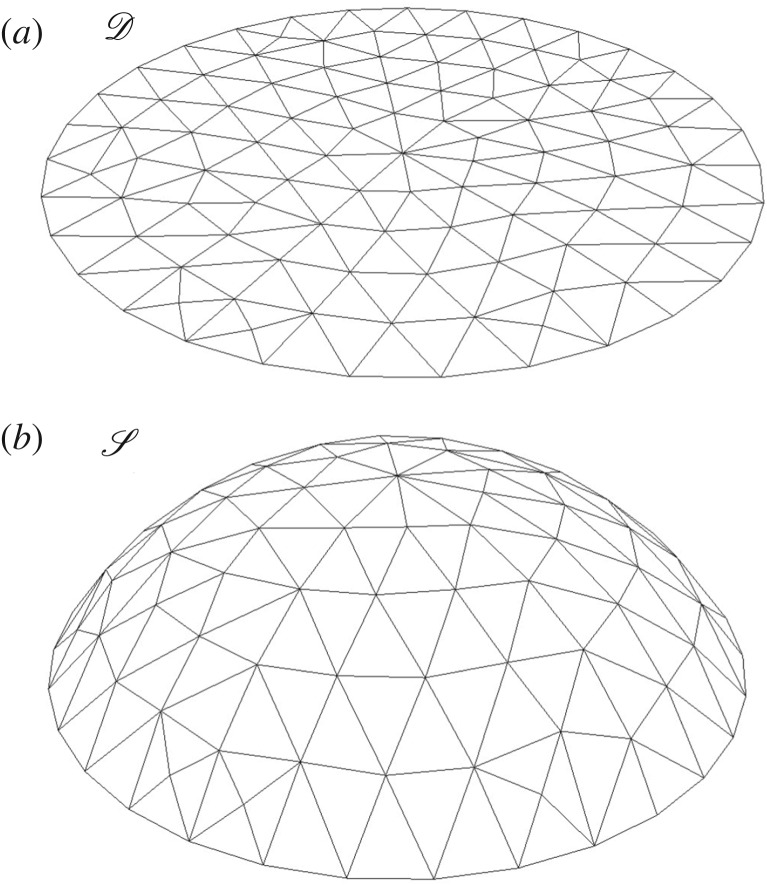
If the lamina alone is involved in the global flattening of the leaf, this could be achieved by a centro-lateral gradient of the in-plane growth. The hypothesis here is to neglect completely the rigidity of the midrib and to consider only a surface going from curved to flat via pure orthoradial growth. In this second toy model, we consider the simplest case of a symmetrical spherical side cap of Gaussian curvature κG. Mathematically, it is easier to detail the inverse transformation: let us consider the flat disc  parametrized by the two cylindrical variables (r, θ); r ∈ [0, R], θ ∈ [0, 2π]. In Cartesian coordinates, and as shown in figure 7, the application F from the disc
  to the subset of sphere
  of Gaussian curvature
  reads
reads
 |
4.2 |
The result is that the orthoradial metric of the flat surface which transforms into a part of a sphere is  . Conversely, this means that the orthoradial growth necessary to flatten the curved sphere of Gaussian curvature κG verifies the following stretch:
| 4.3 |
This toy model shows that the lamina alone can manage to overcome a given Gaussian curvature κG if an appropriate centro-lateral gradient of in-plane growth (stretch λ(r)) develops in the lamina.
4.3. Model 3: unfolding by anisotropic differential growth of the midrib alone
Finally, one can consider only the midrib, neglecting completely the rigidity of the lamina. In this case, the lamina is just seen as a prolongation of the midrib, extending from attachment points on the midrib. In this picture, the opening angle of the lamina is directly linked to the evolution of these ‘attachment points’. Considered by itself, the motion of swinging of the midrib can be explained by a differential growth between the abaxial and the adaxial parts similarly to a bimetallic strip. But the midrib is three dimensional, inducing an effect in the perpendicular direction. Therefore differential growth will induce a change of both longitudinal curvature of the midrib and perpendicular opening of the lamina at the same time.
For the sake of simplicity,1 one can consider the midrib to be analogous to a simple rectangular bimetallic strip. Timoshenko [32] developed the corresponding theory long ago. One can adapt it for a midrib made of two components which have different growth rates  and
and  , and comparable thickness h varying slowly compared with the curvatures [33]; then, for each dimension (∥ or ⊥) the kinematic bimetallic strip equation reads
| 4.4 |
As Timoshenko pointed out, the magnitude of the ratio of the Young modulus does not produce any substantial effect on the curvature of the strip, which is due to differential growth only. What enables us to make the link between the two curvatures is then the relation between the differential growth longitudinally or perpendically characterized by the differential growth anisotropy  . Given a typical length scale ℓ localizing the perpendicular curvature, one can rewrite the equation as a function of the local lamina folding angle,
| 4.5 |
This equation is another (proportional) prediction of interdependence of the folding angle at the midrib and midrib curvature.
5. Discussion
During unfolding, the coordination of growth rates over a whole leaf has to be precisely tuned to avoid overstretching and tearing of the tissue. However, similar to the morphogenes in the French flag model that spread from localized sources, the unfolding impetus might originate in a localized area of the leaf and propagate over the whole leaf. Unravelling this organization based on kinematics is made possible by both scrutinizing minute desynchronizations during growth and comparing growth with simplified mechanical models where one part of the leaf dominates the other, whose rigidity is supposed to be nil.
5.1. Comparison with idealized models
5.1.1. Toy model 1 shows that the lamina cannot be passive
For maize, the unrolling of the midrib has been shown to be the motor during the unfolding of the leaf [24]; for avocado, it is natural to start by investigating the first toy model where the blade is perfectly passive. Equation (4.1) describes what one can observe by building an artificial leaf (see electronic supplementary material, figure S11), and trying to induce its motion by forcing the midrib. When the midrib curvature is reduced, one observes that the folding angle increases, up to the point where the two laminae are in contact (φ = π/2). This is the opposite of what is observed in our experimental data. Indeed, in figure 4, we see that the passive blade hypothesis calculation is erroneous in two ways: the variation of the folding angle versus the midrib curvature has the wrong monotony, and it displays a jump in the local curvature instead of a gap in the folding angle. Pure differential growth between the sides of the blades or the sides of the vein cannot describe the unfolding; an in-plane gradient of growth is necessary.
5.1.2. Toy model 2, alone, is not likely to be compatible with the reversion of folding
Starting from a globally positive Gaussian curvature (with a fold around a curved midrib), a decrease in curvature of the midrib, together with a decrease in the folding angle as observed in figure 4, corresponds to a global decrease in the Gaussian curvature. This can be achieved only by a relative extension of the lamina border, far from the midrib, while the lamina near the midrib remains relatively unchanged. Keeping this relative extension of the leaf periphery would lead at some point to a flat leaf, with a null Gaussian curvature. The gradient of in-plane growth is imposed by the initial Gaussian curvature. The inset of figure 2 shows a fit of equation (4.3) with κG = 8.9W−2, where W is the width of the leaf; for approximately 10 cm the Gaussian curvature is approximately 1000 m−2, which is consistent with what has been measured in figure 5.
The issue is that, if continued, it would end up in the undulation of this lamina border, with a global Gaussian curvature becoming negative (figure 9), as observed elsewhere [19,22,34]. But in the case of typical leaves, such as the avocado leaf, the border does not become wavy, and it eventually becomes completely flat. During the oscillations, we also observe that Gaussian curvature always remains positive, as shown in figure 5. When the midrib curvature changes sign, the folding angle simultaneously changes sign also. It is still possible that the lamina extension necessary to bring the global Gaussian curvature to zero (flat leaf) would then invert its variation to induce a positive Gaussian curvature again. This requires inverse growth, where now the lamina near the midrib extends relatively to the lamina border. This is indeed possible, and even necessary, but it would be very lucky that it would fold each time on the opposite side: it could fold again on the original side, keeping the midrib curvature with the same sign. Therefore, this mechanism, alone, is unlikely.
Figure 8.
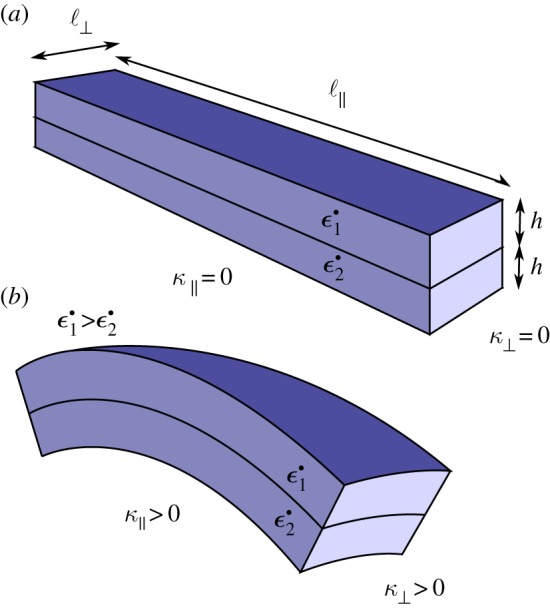
Bimetallic strip geometry. Two rectangular shapes of a long dimension ℓ∥, an orthogonal dimension ℓ⊥ and a height h have different growth rates  and
and  . A differential in the growth rate will induce both longitudinal curvature (κ∥) and perpendicular curvature (κ⊥) of the same sign. (Online version in colour.)
Figure 9.
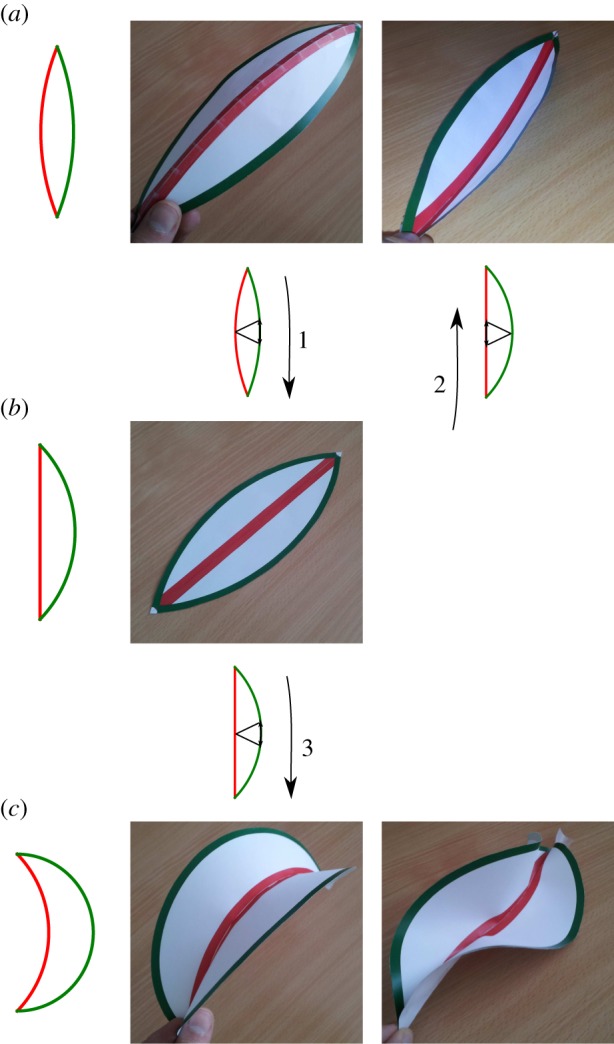
Gaussian curvature as a function of blade growth: elliptic versus hyperbolic solutions. (a–c) We represent schematically the growth of a blade by the edge (green lines) while keeping the midrib at constant length (red line). On the left side is the projection of the surface, while the three-dimensional shape is on the right. (a) Gaussian curvature is positive and the solution is elliptically curved to one side or the other. After growth (1) we reach a flat state. (b) Flat state: Gaussian curvature is null. If one reverses growth by extending the midrib (2), we can go back to one of the two solutions of (a). If growth continues on the edge (3), we get to (c). (c) Gaussian curvature is negative, and there are two elliptic solutions (a curved surface, or twisted on the edge). These shapes, most commonly the first one, can be observed in abnormally grown leaves (see electronic supplementary material, figure S18). (Online version in colour.)
5.1.3. Toy model 3 reveals under which conditions the midrib could direct the lamina
The brutal change in the folding angle φ (figure 4) suggests that it is directed from outside. During the inversion, the vein imposes for each half-blade both the position of the border and the angle of attachment; using the terminology of differential geometry, both the non-free boundary and the tangent plane at the boundary are imposed. While it is fairly easy to deform a convex surface isometrically by actuating it along a non-closed curve [29,35], if the direction of the tangent plane to the curve is simultaneously imposed and there are no isometric modes of deformation in general, the surface has to be stretched or compressed to satisfy the boundary conditions. These conflicting constraints at the boundary are exactly the ones of our third toy model. Because the length scale ℓ of equation (4.5) on which the fold is localized is typically the radius of the midrib, this indicates that the folding angle of the lamina should vary linearly with the longitudinal curvature of the midrib and that the slope of this variation should be the order of magnitude of the diameter of the midrib. In the experiment (figure 4), we indeed observed a linear dependence of the folding angle as a function of the midrib curvature even if there was a jump at the buckling event. The anisotropy of differential growth necessary to reproduce the data can be estimated as  (see figure 4 and electronic supplementary material, figure S15). Although it was proposed that cells have independent growth mechanisms in different directions [36], this measure is much lower than the anisotropy
  of in-plane growth of the vein measured experimentally.
Still, the fact that the folding angle of the lamina follows qualitatively the variation in the connection angle makes the midrib a good candidate to direct the global opening of the whole lamina. Qualitative consistency of this scenario can be demonstrated by experimental cuts at strategic times in the development of the leaf: different curvatures at different places induce different folding angles (see electronic supplementary material, figure S17). The proposed mechanism is reminiscent of what has been observed previously in the the maple bud, where both lamina folds and longitudinal curvature of the midrib are associated with an asymmetric midrib growth, the abaxial side growing much more than the adaxial one [16]; similarly, the reverse motion when the avocado leaf unfolds, with its fluttering oscillation, would result in reverse and oscillating asymmetric growth between the adaxial–abaxial sides of the midrib.
5.2. Midrib is forcing the independent buckling of the two half-blades
Model 3 suggests that the reversal is monitored by both an active change of the vein curvature and an increase of the target opening angle along the midrib: first the target opening angle is low, having it frustrated, while keeping the half-blades non-frustrated (close to their natural curvature) is the most advantageous energetically; at some point, as the target opening angle increases, the frustration becomes too high and another equivalently energetic solution arises corresponding to an inverted frustrated half-blade and a non-frustrated opening angle; the jump from one equivalent configuration to the other is called buckling. In the case of the buckling of Dionaea muscipula, Forterre et al. [10] developed a toy model illustrating the balance between bending and stretching. Similarly, here, we have a balance between stretching, bending and target opening angle frustration. The typical deformation of the blade at the transition is  , where h is the typical thickness of the blade [37]. As the deformations are quite small, it makes them difficult to measure experimentally; only the time scales of the movement can be compared with the theoretical predictions.
5.2.1. Time scales
Quantitatively, growth-induced motions are limited by the poroelastic time scale [7–9]. When the time constant of a phenomenon is greater than the poroelastic limit, it is always induced by growth, while if the time constant is less it is necessarily an accelerated event induced either by buckling or by other mechanical instability. For a typical plant tissue of size L, Forterre et al. estimated the poroelastic time scale to vary with tissue size as τp ∼ 0.077 × 10⁹ m2 s−1 × L2 [7]. In our case, the midrib with size of a few millimetres evolves in a few hours, which is very slow compared with the poroelastic limit ( ). On the contrary, the lamina with size of approximately 1 mm flutters very fast (approx. 1° min−1; figure 3), flirting with or crossing the poroelastic limit (τ(1 mm) ∼ 80 s).
This demonstrates that the midrib curvature changes with growth, whereas the lamina takes advantage of a mechanical phenomenon, such as buckling instability, to flutter fast. Figure 4 shows that the midrib curvature not only changes sign but also does it continuously, while the blade folding angle shows a jump. Together with the time scales, this indicates that the midrib changes shape with inhomogeneous growth, while the blade is forced by this midrib into fast buckling. In this picture, the lamina, at least during the duration of the buckling, is acting passively, although at a longer time scale the deformations that it undergoes could act as a guide and incentive for the variation in its growth.
5.3. Mechanosensitivity
5.3.1. Feedback
It is now well established that growth is strongly dependent on the local mechanics of the tissue (see, for example, [38,39] for recent reviews or [40] for recent results on the rheology of leaves). Here, the contrasting movement between the natural closure of the lamina when the midrib curvature is reduced and the opposite opening angle at the contact with the midrib will create a local stress. This stress must induce a local growth reaction to release it, reopening the angle locally. We can then imagine that such a local reaction propagates in the lamina so that finally the whole lamina is expanding, especially at its periphery.
This is a remarkable phenomenon: by some means, the midrib manages to mechanically direct the lamina at a distance to remain oscillating between an enhanced growth at the periphery (state (1) of the scenario discussed in figure 9) and an enhanced growth at the midrib (respectively, state (2)), in a very controlled way through the angles at the boundary. By doing so, it forces the leaf to change its global Gaussian curvature, which would remain the same if the lamina was passive, first by decreasing it (1) and then increasing it again (2). As the oscillation of the curvature reduces in time, so does the oscillation in the inhomogeneous growth of the lamina, around the symmetric flat state. This decreasing oscillation of the curvature is thus an efficient conducting signal to get closer and closer to a flat surface, as observed in figure 5. Interestingly, the folding angle also decreases slightly as a function of time (see electronic supplementary material, figure S21). Although of minor magnitude, this is another contribution to the final flatness of the leaf.
5.3.2. Influence of gravity
As described in the results section, the buckling events disappear after some time. One could ask if it is harder to move the leaf due to its increasing weight. Let us consider a leaf extending to a typical size L, its surface being S and its thickness being h. The simplest scaling for Gaussian curvature is κG ∝ 1/L2. The bending energy involved in buckling scales as Ebending∝SEh3κG. On the other hand, the gravitational potential energy scales as Egravity∝ShρV
gL, where ρV is the volumetric mass density of the leaf and g is the gravitational field. Overall, the ratio of the two energies reads Egravity/Ebending ∝ L3ρVg/(Eh2). The two terms become comparable only for a critical value  . For typical plant values (E ∼ 300 MPa [41], h ∼ 1 mm, ρV∼ 103 kg .m−3), which gives Lc∼30 cm.
This scaling argument indicates that the weight can be neglected in most of the development as the size of the leaf is often significantly smaller than Lc.
The combination of increasing length and the reduction in the Gaussian curvature makes the two energetic terms of bending and gravity comparable at the end of development as the full size of a leaf approaches Lc. This could potentially explain the tailing off observed in the buckling events at the end of the growth period, although we still believe it is most probably primarily due to a decrease in available energy as the growth process is also progressively stopping.
5.3.3. Absence of oscillations in tortuous plants
The relation of the oscillations to the convergence towards a flat state can be checked in the special case of tortuous plants, and in particular the twisting hazel. The simple folding in two leaves of the hazel plant presents the same typical motions of the avocado leaf (see electronic supplementary material, video S3, or online videos (http://www.arkive.org/hazel/corylus-avellana/video-04.html)). However, in the case of twisting plants none of these oscillations are observed. Only a constant opening is observed, leading finally to a non-flat leaf, interestingly still with a positive Gaussian curvature (see electronic supplementary material, video S4). Another argument is given by the observation of an avocado leaf constrained by a too large midrib curvature; this leaf could not achieve buckling movements and ended up exhibiting an undulated, negative Gaussian curvature surface at its periphery (see electronic supplementary material, figure S16).
6. Conclusion
In conclusion, we have revealed the typical motion observed in young growing simple leaves, which seems common to many species. The blade flutters as a consequence of the directing motion of the midrib, which swings back and forth. The main observations are buckling events, the proportionality of the opening angle to the midrib curvature and the convergence of the leaf towards a flat state without undulation at its periphery. We provide a parsimonious understanding of these motions as a periodic asymmetric growth of the midrib, directing a periodic inhomogeneous growth of the lamina, enhanced first at the periphery during the opening of the leaf and then near the midrib during the closing. This inhomogeneous growth is controlled by the midrib via geometry and locally induced stresses at the connecting angle. This mechanism is parsimonious as it derives only from the reversal of the motions observed in the first formation of the leaf inside the bud. This is an interesting mechanism that provides plants with the opportunity to achieve their posture regulation by combining the joint goals of flattening the blade surface and straightening the midrib line, in order to reach a final flat shape.
Supplementary Material
Supplementary Material
Supplementary Material
Acknowledgements
J.D. would like to warmly thank Cyprien Gay for stimulating discussions.
Endnote
Although a biologically realistic geometry of the midrib can be modelled rigorously through conformal mapping (see electronic supplementary material), we discuss here the pedagogical case of the bimetallic strip (figure 8). In the electronic supplementary material, we also prove that the two approaches are equivalent.
Data accessibility
Raw data corresponding to the three-dimensional tracking of the experiment are provided in full in the electronic supplementary material of this paper.
Authors' contributions
S.D., R.B. and J.D. designed the research. J.D. set up and performed the experiments. J.D. analysed the data. J.D., S.D., R.B. and E.C. discussed the results. J.D., S.D. and E.C. wrote the paper.
Competing interests
We declare we have no competing interests.
Funding
No funding has been received for this article.
References
- 1.Runions A, Tsiantis M, Prusinkiewicz P. 2017. A common developmental program can produce diverse leaf shapes. New Phytol. 216, 401–418. ( 10.1111/nph.14449) [DOI] [PMC free article] [PubMed] [Google Scholar]
- 2.Bilsborough GD. et al. 2011. Model for the regulation of Arabidopsis thaliana leaf margin development. Proc. Natl Acad. Sci. USA 108, 3424–3429. ( 10.1073/pnas.1015162108) [DOI] [PMC free article] [PubMed] [Google Scholar]
- 3.Walter A, Schurr U. 2005. Dynamics of leaf and root growth: endogenous control versus environmental impact. Ann. Bot. 95, 891–900. ( 10.1093/aob/mci103) [DOI] [PMC free article] [PubMed] [Google Scholar]
- 4.Wang L, Beyer ST, Cronk QCB, Walus K. 2011. Delivering high-resolution landmarks using inkjet micropatterning for spatial monitoring of leaf expansion. Plant Methods 7, 1 ( 10.1186/1746-4811-7-1) [DOI] [PMC free article] [PubMed] [Google Scholar]
- 5.Satter RL, Galston AW. 1973. Leaf movements: Rosetta Stone of plant behavior? BioScience 23, 407–416. ( 10.2307/1296540) [DOI] [Google Scholar]
- 6.Darwin C. 1888. The ‘Power of movement in plants.’–1880. In The life and letters of Charles Darwin, including an autobiographical chapter, vol. 3 (ed. Darwin F.), pp. 329–338. London, UK: John Murray. [Google Scholar]
- 7.Forterre Y. 2013. Slow, fast and furious: understanding the physics of plant movements. J. Exp. Bot. 64, 4745–4760. ( 10.1093/jxb/ert230) [DOI] [PubMed] [Google Scholar]
- 8.Dumais J, Forterre Y. 2012. ‘Vegetable dynamicks’: the role of water in plant movements. Annu. Rev. Fluid Mech. 44, 453–478. ( 10.1146/annurev-fluid-120710-101200) [DOI] [Google Scholar]
- 9.Skotheim JM, Mahadevan L. 2005. Physical limits and design principles for plant and fungal movements. Science 308, 1308–1310. ( 10.1126/science.1107976) [DOI] [PubMed] [Google Scholar]
- 10.Forterre Y, Skotheim JM, Dumais J, Mahadevan L. 2005. How the Venus flytrap snaps. Nature 433, 421–425. ( 10.1038/nature03185) [DOI] [PubMed] [Google Scholar]
- 11.Noblin X, Rojas NO, Westbrook J, Llorens C, Argentina M, Dumais J. 2012. The fern sporangium: a unique catapult. Science 335, 1322SEP. ( 10.1126/science.1215985) [DOI] [PubMed] [Google Scholar]
- 12.Hill J. 1762. The sleep of plants, and cause of motion in the sensitive plant, explained. London, UK: R. Baldwin.
- 13.Rivière M, Derr J, Douady S. 2017. Motions of leaves and stems, from growth to potential use. Phys. Biol. 14, 051001 ( 10.1088/1478-3975/aa5945) [DOI] [PubMed] [Google Scholar]
- 14.Moran N. 2015. Rhythmic leaf movements: physiological and molecular aspects. In Rhythms in plants (eds Mancuso S, Shabala S), pp. 57–95. Berlin, Germany: Springer. [Google Scholar]
- 15.Couturier E, Courrech du Pont S, Douady S. 2011. The filling law: a general framework for leaf folding and its consequences on leaf shape diversity. J. Theor. Biol. 289, 47–64. ( 10.1016/j.jtbi.2011.08.020) [DOI] [PubMed] [Google Scholar]
- 16.Couturier E, Brunel N, Douady S, Nakayama N. 2012. Abaxial growth and steric constraints guide leaf folding and shape in Acer pseudoplatanus. Am. J. Bot. 99, 1289–1299. ( 10.3732/ajb.1100325) [DOI] [PubMed] [Google Scholar]
- 17.Bohn S, Andreotti B, Douady S, Munzinger J, Couder Y. 2002. Constitutive property of the local organization of leaf venation networks. Phys. Rev. E 65, 061914 ( 10.1103/PhysRevE.65.061914) [DOI] [PubMed] [Google Scholar]
- 18.Nath U, Crawford BCW, Carpenter R, Coen E. 2003. Genetic control of surface curvature. Science 299, 1404–1407. ( 10.1126/science.1079354) [DOI] [PubMed] [Google Scholar]
- 19.Sharon E, Marder M, Swinney H. 2004. Leaves, flowers and garbage bags: making waves rippled fractal patterns on thin plastic sheets and biological membranes offer elegant examples of the spontaneous breaking of symmetry. Am. Sci. 92, 254–261. ( 10.1511/2004.47.932) [DOI] [Google Scholar]
- 20.Amar MB, Müller MM, Trejo M. 2012. Petal shapes of sympetalous flowers: the interplay between growth, geometry and elasticity. New. J. Phys. 14, 085014 ( 10.1088/1367-2630/14/8/085014) [DOI] [Google Scholar]
- 21.von Goethe JW, Miller GL. 2009. The metamorphosis of plants. Cambridge, MA: MIT Press. [Google Scholar]
- 22.Liang H, Mahadevan L. 2011. Growth, geometry, and mechanics of a blooming lily. Proc. Natl Acad. Sci. USA 108, 5516–5521. ( 10.1073/pnas.1007808108) [DOI] [PMC free article] [PubMed] [Google Scholar]
- 23.Moulia B. 2000. Leaves as shell structures: double curvature, auto-stresses, and minimal mechanical energy constraints on leaf rolling in grasses. J. Plant Growth. Regul. 19, 19–30. ( 10.1007/s003440000004) [DOI] [PubMed] [Google Scholar]
- 24.Moulia B, Fournier M. 1997. Mechanics of the maize leaf: a composite beam model of the midrib. J. Mater. Sci. 32, 2771–2780. ( 10.1023/A:1018604012754) [DOI] [Google Scholar]
- 25.Boudaoud A. 2010. An introduction to the mechanics of morphogenesis for plant biologists. Trends. Plant Sci. 15, 353–360. ( 10.1016/j.tplants.2010.04.002) [DOI] [PubMed] [Google Scholar]
- 26.Scott GL, Longuet-Higgins HC. 1991. An algorithm for associating the features of two images. Proc. R. Soc. Lond. B 244, 21–26. ( 10.1098/rspb.1991.0045) [DOI] [PubMed] [Google Scholar]
- 27.Hartley R, Zisserman A. 2003. Multiple view geometry in computer vision. Cambridge, UK: Cambridge University Press. [Google Scholar]
- 28.Trucco E, Verri A. 1998. Introductory techniques for 3-D computer vision. Upper Saddle River, NJ: Prentice Hall. [Google Scholar]
- 29.Eisenhart LP. 1909. A treatise on the differential geometry of curves and surfaces. Boston, MA: Ginn. [Google Scholar]
- 30.Jellett JH. 1849. On the properties of inextensible surfaces. Trans. R. Irish Acad. 22, 343–377. [Google Scholar]
- 31.Couturier E, Dumais J, Cerda E, Katifori E. 2013. Folding of an opened spherical shell. Soft. Matter 9, 8359–8367. ( 10.1039/c3sm50575h) [DOI] [Google Scholar]
- 32.Timoshenko S. 1925. Analysis of bi-metal thermostats. J. Opt. Soc. Am. 11, 233–255. ( 10.1364/JOSA.11.000233) [DOI] [Google Scholar]
- 33.Bastien R, Douady S, Moulia B. 2014. A unifying modeling of plant shoot gravitropism with an explicit account of the effects of growth. Plant Biophys. Model. 5, 136 ( 10.3389/fpls.2014.00136) [DOI] [PMC free article] [PubMed] [Google Scholar]
- 34.Dervaux J, Ben Amar M. 2008. Morphogenesis of growing soft tissues. Phys. Rev. Lett. 101, 068101 ( 10.1103/PhysRevLett.101.068101) [DOI] [PubMed] [Google Scholar]
- 35.Couturier E. 2016. Folded isometric deformations and banana-shaped seedpod. Proc. R. Soc. A 472, 20150760 ( 10.1098/rspa.2015.0760) [DOI] [PMC free article] [PubMed] [Google Scholar]
- 36.Baskin TI. 2005. Anisotropic expansion of the plant cell wall. Annu. Rev. Cell Dev. Biol. 21, 203–222. ( 10.1146/annurev.cellbio.20.082503.103053) [DOI] [PubMed] [Google Scholar]
- 37.Pauchard L, Pomeau Y, Rica S. 1997. Déformation des coques élastiques. C. R. Acad. Sci. IIB 324, 411–418. ( 10.1016/S1251-8069(99)80052-9) [DOI] [Google Scholar]
- 38.Moulia B. et al. 2011. Integrative mechanobiology of growth and architectural development in changing mechanical environments. In Mechanical integration of plant cells and plants (ed. Wojtaszek P.), pp. 269–302. Berlin, Germany: Springer. [Google Scholar]
- 39.Moulia B, Coutand C, Julien J-L. 2015. Mechanosensitive control of plant growth: bearing the load, sensing, transducing, and responding. Front. Plant Sci. 6, 52 ( 10.3389/fpls.2015.00052) [DOI] [PMC free article] [PubMed] [Google Scholar]
- 40.Sahaf M, Sharon E. 2016. The rheology of a growing leaf: stress-induced changes in the mechanical properties of leaves. J. Exp. Bot. 67, 5509–5515. ( 10.1093/jxb/erw316) [DOI] [PMC free article] [PubMed] [Google Scholar]
- 41.Nezhad AS, Naghavi M, Packirisamy M, Bhat R, Geitmann A. 2013. Quantification of the young's modulus of the primary plant cell wall using bending-lab-on-chip (bloc). Lab. Chip. 13, 2599–2608. ( 10.1039/c3lc00012e) [DOI] [PubMed] [Google Scholar]
Associated Data
This section collects any data citations, data availability statements, or supplementary materials included in this article.
Supplementary Materials
Data Availability Statement
Raw data corresponding to the three-dimensional tracking of the experiment are provided in full in the electronic supplementary material of this paper.


