Abstract
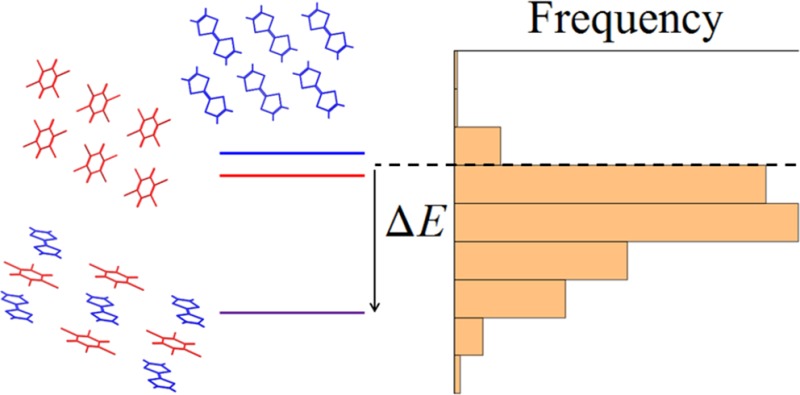
We present a periodic density functional theory study of the stability of 350 organic cocrystals relative to their pure single-component structures, the largest study of cocrystals yet performed with high-level computational methods. Our calculations demonstrate that cocrystals are on average 8 kJ mol–1 more stable than their constituent single-component structures and are very rarely (<5% of cases) less stable; cocrystallization is almost always a thermodynamically favorable process. We consider the variation in stability between different categories of systems—hydrogen-bonded, halogen-bonded, and weakly bound cocrystals—finding that, contrary to chemical intuition, the presence of hydrogen or halogen bond interactions is not necessarily a good predictor of stability. Finally, we investigate the correlation of the relative stability with simple chemical descriptors: changes in packing efficiency and hydrogen bond strength. We find some broad qualitative agreement with chemical intuition—more densely packed cocrystals with stronger hydrogen bonding tend to be more stable—but the relationship is weak, suggesting that such simple descriptors do not capture the complex balance of interactions driving cocrystallization. Our conclusions suggest that while cocrystallization is often a thermodynamically favorable process, it remains difficult to formulate general rules to guide synthesis, highlighting the continued importance of high-level computation in predicting and rationalizing such systems.
Short abstract
Solid state density functional theory is used to evaluate the energetic stability of 350 observed cocrystals with respect to the crystal structures of the separate coformers. The results demonstrate that the vast majority of known cocrystals are more stable than the stoichiometrically weighted sum of their component crystals. We analyze the distribution of energies and the influence of hydrogen and halogen bonding.
Introduction
Co-crystals, where two or more neutral molecules crystallize together within a single crystal lattice, continue to receive high levels of interest in the field of crystal engineering. A major driver for cocrystal studies is the increased opportunity for the modification of solid form properties that is introduced by the combination of two different chemical entities, rather than chemical modification of the original molecules. This has been exemplified by the modification of dissolution rate,1 mechanical properties,2 optical properties,3 stability to hydration,4 and melting point5 through cocrystallization.
Like polymorphism, cocrystallization is a phenomenon that is straightforward in principle, but where the definition of guiding rules and the development of predictive methods is challenging. In the area of polymorphism, the use of computational modeling has helped understand the typical energy difference between observed structures: most pairs of polymorphs are separated by lattice energy differences of less than 2 kJ mol–1, and 95% by less than 7.2 kJ mol–1,6 and we are gaining a better understanding of the magnitude of entropic contributions and their impact on polymorph free energy differences.6,7
We are not aware of a general guideline for the difference in energy between a typical cocrystal and the pure crystal structures of its individual components. This is despite the utility of such a characteristic value; most obviously, it would indicate whether cocrystallization in general is likely to be spontaneous (i.e., thermodynamically favorable with respect to formation of the separate, pure structures). A better quantitative understanding of the typical energetic driving force for cocrystallization also provides context for the introduction or modification of intermolecular interactions in attempts to induce the cocrystallization of two molecules.
Computational chemists have developed a range of methods for predicting cocrystallization. These include the use of simplified models for the possible interactions between molecules,8 specific criteria based on electrostatic potentials between donor and acceptor atoms on coformers,9 models trained from crystallographic databases for predicting the propensity of competing hydrogen bond donor–acceptor combinations,10 the adaptation of liquid-phase models to predict mixing enthalpies between components11 and, recently, the use of machine learning based on molecular descriptors.12 Furthermore, the methods developed for crystal structure prediction (CSP) have been applied to cocrystal prediction by exploring the complete space of crystal packing possibilities of the single components and their cocrystals and an evaluation of the possible energetic gain of cocrystallization.13−15 The possibilities for different stoichiometric ratios of cocrystal components must be considered in predicting cocrystallization; in the case of CSP, this involves predicting the landscapes of possible structures at a range of stoichiometries.13,16 From a computational CSP perspective, a quantification of the characteristic energy of observed cocrystals with respect to their separate single components would help define the relevant energy range within which a CSP study should explore possible cocrystal structures.
Discussions of whether a cocrystal is thermodynamically more or less stable than the corresponding pure structures has largely been limited to studies of specific sets of cocrystal systems. Computationally, these typically involve a small closely related set of target molecules17,18 rather than a broad, chemically diverse space, making the conclusions drawn from such studies useful for those specific systems but difficult to apply to cocrystallization generally. A recent effort to investigate cocrystallization as a general phenomenon by Gavezzotti et al.19 considered a large set of around 1500 cocrystal structures, but only calculated energies relative to the single-component structures for a small fraction (97) of those, using the efficient but physically approximate PIXEL method.20 That being said, both their work and the work of others on cocrystals of specific composition indicate that cocrystallization is likely a thermodynamically driven process; observed cocrystals are usually found to be more stable than the pure structures, but more general and quantitative conclusions regarding the magnitude of this stability cannot be reached in these studies.
The aim of the present work is to accurately compute the thermodynamic stabilities of a large set of experimentally known cocrystals with respect to the pure structures of the molecules concerned. Ideally, in order to reach generally applicable conclusions, the set of structures must be both sufficiently large and chemically diverse to make generally representative conclusions. While the relative stabilities will likely show considerable variation depending on the physical nature of each system, it is our hypothesis that cocrystallization is in general thermodynamically driven to a degree that is resolvable with current computational methods.
We also explore whether the calculated cocrystal stability could be linked with a straightforward structural descriptor. We consider several relatively simple descriptors of both the crystal structures and the molecules within them. In particular, we calculate and compare descriptors for two typical strong, directional intermolecular interactions—hydrogen bonding and halogen bonding—as well as the packing efficiency of the structures. We assess whether the change in these descriptors between the pure structures and the cocrystal can be linked to the observed stability of the cocrystal relative to its single component structures.
Considering a hypothetical binary cocrystal with composition AmBn, we hereafter refer to the constituent molecular species A and B as the components of the cocrystal. Hence, we term crystal structures of purely constituent A or B as the corresponding single-component structures of the cocrystal. We define the relative thermodynamic stability of the cocrystal as
| 1 |
where Etot is the total energy of a crystal structure per formula unit of constituent(s): Etot (AmBn) is the calculated energy of the cocrystal; Etot(A) and Etot(B) are energies of the single-component crystal structures of coformers A and B, respectively. Where polymorphism has been observed in the single-component structures, we present the cocrystal stability relative to the single-component structures with the lowest total calculated energy per formula unit.
The cost-effective energy evaluation and structural optimization of molecular crystal structures is itself a difficult problem and an area of considerable research. Here, we apply periodic density functional theory (DFT) calculations, performed in a plane wave basis and supplemented by a dispersion correction (DFT+D). Thus, the energy differences calculated using eq 1 account for both intermolecular energy differences and changes in intramolecular energy between the single component and cocrystal structures. The best DFT+D methods have been demonstrated to obtain values correct to within a few kJ mol–1 relative to experimentally derived lattice energies for a molecular crystal benchmark set of 23 organic crystal structures.21 While such periodic DFT calculations are quite computationally demanding compared to force field based methods, they remain tractable for large sets of structures using large scale high-performance computing.
Method and Computational Details
General Cocrystal Structure Set
Our aim was to select a representative set of organic cocrystal structures, from which general observations on the energetics of cocrystallization can be made. The set of cocrystals and their corresponding single-component structures were obtained from the Cambridge Structural Database (CSD)22 using the ConQuest software package. For the general cocrystal set, constituent elements were limited to C, H, N, O, F, S, and Cl. We define cocrystals for the purposes of this work as crystal structures:
containing at least two chemically different polyatomic units,
containing only overall neutral molecules (i.e., nonionic structures), and
not containing any of a set (defined in the Supporting Information) of common solvents or small molecules known to be liquid/gaseous at room temperature, ruling out solvates and clathrates.
To avoid duplicate and low-quality structures, all searches were initially restricted to the predefined “best hydrogens” subset23 of the CSD. Matching of molecules between cocrystals and possible single component structures was handled using SMILES strings. Further details of our search procedure are provided in the Supporting Information. For brevity, we will refer to structures in the text by their CSD reference codes.
Halogen-Bonded Cocrystal Set
The general set of cocrystal structures was supplemented by a specific search performed to identify halogen-bonded cocrystals and their corresponding single-component structures. We identified all cocrystals containing at least one possible halogen bond, which we defined as a contact D···X—A, where D is one of N, O, S, or Cl; X is either Br or I; the D···X distance is less than the sum of the van der Waals radii of the two atoms plus a tolerance of 0.1 Å and the angle formed by D···X—A is greater than 160°.
This process, combined with the additional restriction that crystal structures were also available for the individual components of each cocrystal, yielded 3303 unique cocrystal structures matching the general cocrystal criteria, and 34 unique cocrystal structures for the halogen-bonded set. Of the latter, only 28 successfully completed our optimization procedure—we then randomly selected cocrystals from the general set until 322 (and their corresponding single component structures) were successfully geometry optimized. This gave a total combined set of 350 cocrystals for our computational study. The assembled set of single component structures include all crystal polymorphs available within the CSD of each molecule found in the cocrystal set.
While our set excludes any structures that are reported as salts in the CSD, such an unambiguous definition is not always possible due to dynamic proton transfer or disorder. Indeed, the experimental determination of cocrystal versus salt can be sensitive to conditions, as described for the cocrystal target of the most recent (sixth) Blind Test of CSP methods.24 Since our optimization procedure allows all structural degrees of freedom to relax, it is feasible for proton transfer between species to occur if the cocrystal configuration is unstable at the level of theory used in our calculations, potentially changing structures defined in the CSD as being neutral cocrystals into ionic salts.
Periodic DFT Optimizations
All experimental cocrystal and single-component structures in our sets were optimized using plane-wave-based periodic DFT using the CASTEP25 and VASP26−29 packages. Structural optimization was performed in two steps to aid convergence—an initial optimization in which only atomic positions were optimized (i.e., the lattice parameters are fixed) followed by a second optimization in which both atomic positions and cell parameters are fully flexible. Such a procedure has been noted to improve convergence of DFT optimizations of experimentally obtained organic crystal structures.30
Throughout our calculations, the PBE exchange-correlation functional31 was employed, supplemented with the Becke–Johnson-damped Grimme dispersion corrections32,33—the D2 version in CASTEP and the more recent D3 version in VASP. Except where otherwise noted, we present only the final resulting structures and energies from our VASP calculations (PBE+D3) due to the more accurate dispersion correction.
All calculations in VASP made use of the projector-augmented wave (PAW) method34 and the standard supplied pseudopotentials.35 The convergence criteria for all VASP calculations were as follows: a plane-wave energy cutoff of 500 eV, an energy tolerance in convergence of the electronic minimization of 1 × 10⁻⁷ eV per atom, and a force tolerance in the geometry optimization of 3 × 10⁻² eV Å–1. These tolerances were found to yield sufficiently accurate energies (and converged minimizations) while moderating the considerable total cost of the many optimizations to be performed. The computational settings used are also in line with those used in other work employing DFT in VASP for accurate energy evaluations of organic crystal structures.17,30,36,37
Further details regarding our optimization procedure are given in the Supporting Information.
Calculation of Descriptors
Hydrogen Bonding
Analysis of the hydrogen-bonding environments in crystal structures was carried out using in-house code in conjunction with the CSD Python API.38 A molecular shell was constructed around each unique species in a crystal structure to count all hydrogen bonds in which the species participates (i.e., ignoring crystal symmetry). In cases of chemically equivalent but symmetrically unrelated moieties (e.g., a Z′ = 2 single-component crystal), hydrogen bond counts were averaged over the distinct moieties. Contacts were considered hydrogen bonds if they satisfied all of the following criteria:
the H···A contact distance is less than the sum of the van der Waals’ radii of the two atoms,
the D—H···A contact angle is greater than or equal to 130 degrees,
the donor atom D is any of N, O, or S, and
the acceptor atom A is any of N, O, or S.
Additionally, we calculated a basic measure of the strength of a hydrogen bond based on the Coulombic attraction between the partial charges of the (positively charged) hydrogen and (negatively charged) acceptor atom involved (the H···A electrostatic interaction). We computed these charges (qH and qA respectively) based on fitting to the molecular electrostatic potential in vacuo of each unique moiety in the optimized crystal structure using the CHELPG method39 in Gaussian09.40 The strength of an individual hydrogen bond is then straightforwardly calculated as
| 2 |
where rHA is the hydrogen-acceptor distance. A total hydrogen-bond attraction energy was then calculated for a given crystal structure C as
| 3 |
where the sum runs over all hydrogen bonds present in the unit-cell.
Finally, the change in this measure of hydrogen bond strength upon forming the cocrystal can be calculated in analogy with eq 1:
| 4 |
Packing Coefficient
To determine the efficiency of packing of a given crystal structure, we use the packing coefficient CK as defined by Kitaigorodsky.41 Each molecule is assumed to exclude a volume Vmol based on the van der Waals’ radii of its constituent atoms. The packing coefficient for a crystal structure with unit cell volume Vcell is therefore
| 5 |
and this value was calculated for each of our optimized crystal structures using the PLATON package,42 with a spherical probe of radius 1.2 Å, and an integration grid of 0.1 Å spacing.
Analogously to eq 1, the change in packing coefficient upon forming the cocrystal can be defined as the difference between CK in the cocrystal and the stoichiometrically normalized sum of CK values of the single components:
| 6 |
Results and Discussion
Distribution of the Energetic Stability of Cocrystals
We first analyze the distribution of cocrystal stabilities in the overall cocrystal set, comprising 350 cocrystal structures, relative to the single-component structures of their constituent coformers (Figure 1). The results are presented in two ways: as an energy gain per cocrystal formula unit (blue bars) and as an energy gain per molecule (orange bars, the energy gain per formula unit divided by the number of molecules in the formula unit).
Figure 1.
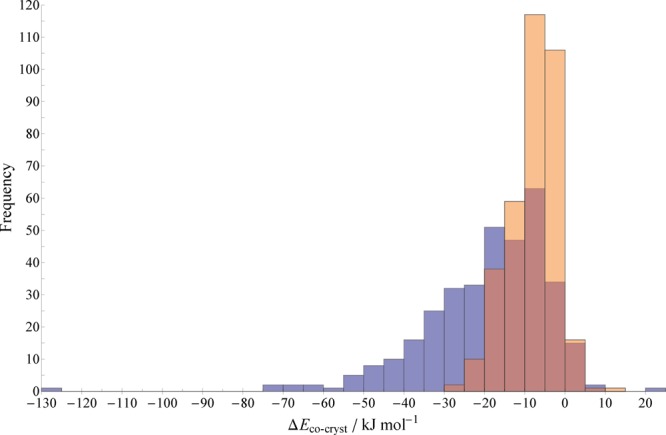
Distributions of calculated (PBE+D3) relative stabilities (defined in eq 1) for the full set of 350 cocrystals relative to their corresponding single-component structures. Blue bars are the energy per formula unit of the cocrystal (as defined within its CSD entry), while orange bars are the energy per molecule (the dark regions of bars indicate overlap). Values are expressed in kJ mol–1 and collected into bins of width 5 kJ mol–1.
It is clear from Figure 1 that the calculations generally and reliably predict observed cocrystals to be more stable than their corresponding single-component structures. The mean value of the data is −8.0 kJ per mole of molecules or −19.1 kJ per mole of cocrystal formula unit—the average gain in stability achieved by cocrystallization is greater than the typical energy difference between crystal polymorphs of organic molecules (around 2 kJ mol–1).6 The median stability is −6.7 kJ mol–1 of molecules (−16.2 kJ mol–1 of formula unit), and the distribution is skewed toward increasing cocrystal stability.
Note the magnitude of the energy per formula unit depends on the definition of the latter (obtained from the cocrystal’s CSD entry), hence the obvious outlier value at −129 kJ mol–1; this cocrystal, CSD refcode RAWFAW, has an unusually large formula unit containing seven molecules (tris(piperazine) tetrakis(1,1,1-tris(4-hydroxyphenyl)ethane)). Thus, the stability per molecule of RAWFAW relative to the single component structures is a much less extreme value: −18.4 kJ mol–1.
Of the 350 cocrystals considered in Figure 1, only 18 (5.1%) are found to be less stable than the corresponding single-component structures—i.e., our level of theory indicates that 95% of experimentally observed cocrystals in the CSD are thermodynamically favorable. Of those that are found to be less stable, the instability never exceeds +10.2 kJ mol–1 of molecules (+20.5 kJ mol–1 of formula unit); the range of positive (in)stabilities is considerably smaller than the range of negative stabilities.
The mean relative stability per formula unit of cocrystal in our data set, −19.1 kJ mol–1, is in reasonably good agreement with the work of Chan et al.,17 who obtained a value of −11.5 kJ mol–1 also using periodic DFT calculations in VASP (with the PW91 functional and a custom dispersion correction). Chan et al. considered only cocrystals of a few select molecules, so the distribution of cocrystal stabilities that we compute is likely to be more generally representative of organic cocrystals. We also agree extremely well with Chan et al. concerning the proportion of cocrystal structures that are predicted to be more stable than the single-component structures, 94.9% in both cases (though their figure also includes several structures that were known a priori to be salts).
Other efforts to compute relative stabilities of specific sets of cocrystals have used the force field and electrostatic models common in CSP, with varying success. Issa et al.18 used a combination of electrostatic multipoles (derived from MP2 charge densities) and “exp-6” repulsion-dispersion potentials to compute relative stabilities in DMAREL43 for a set of 26 cocrystals of three molecules of interest with assorted coformers. This approach yielded stabilities of similar magnitude to our work in cases where cocrystallization was predicted to be favorable; however, it did not consistently predict cocrystals to be more stable, and at times strongly disfavored the cocrystal.
It is difficult to fully quantify the uncertainty in calculated relative stabilities. On the basis of a benchmark comparing to lattice energies derived from measured sublimation enthalpies, the PBE+D3 energy model achieves a mean absolute error of 4.5 kJ mol–1 with a random error (one standard deviation) of 5.6 kJ mol–1.37 This is a relatively small error compared to magnitude of the cocrystal stability for the majority of systems; approximately one-third of the cocrystals studied have a stability relative to the single component structures within about 5 kJ mol–1 of zero—this is the proportion of cocrystal structures where the uncertainty in the energy calculation makes it unclear whether they are truly stable relative to their pure components. However, given that our relative stabilities are differences in energies between crystal structures, we expect that fortuitous cancellation of error might reduce the size of this uncertainty, in particular with regards to systematic errors in the PBE+D3 description of the intramolecular physics. It has also been shown6 that within an empirical force-field and electrostatic multipole description of organic crystals, the contribution of vibrational energy terms to free energy differences between polymorphs rarely exceeds 2 kJ mol–1. Errors of this magnitude, due to us not including vibrational energies, are small relative to the static lattice energy differences.
We therefore suggest that while we are unable to fully quantify the uncertainty in our calculated stabilities, we remain confident that the distribution of stabilities is broadly correct and certainly that the qualitative findings—cocrystallization is very often energetically favorable, and very rarely significantly unfavorable—are reliable.
Distribution Subsets: The Influence of Hydrogen and Halogen Bonding
Given our specific inclusion of the halogen-bonding cocrystal subset and the large number of more general cocrystals considered, we can categorize our systems into three different types of cocrystals: hydrogen-bonded, halogen-bonded, and those without one of these specific strong, directional interactions, which for convenience we will refer to as “weakly bound”.
Hydrogen-Bonded Cocrystals
The vast majority (82%) of cocrystals in our set exhibit hydrogen bonding, despite our making no particular efforts to favor such systems. This likely reflects the conventional synthetic routes to the formation of cocrystals being constructed around the complementary pairing of hydrogen bond donor and acceptor species. The distribution of hydrogen-bonded relative stabilities seen in Figure 2a is therefore unsurprisingly similar to our overall distribution in Figure 1. The range in ΔEcocryst in this set is from −24.6 kJ mol–1 (the most stable cocrystal, relative to the corresponding single-component structures) to +10.2 kJ mol–1 (the least stable).
Figure 2.
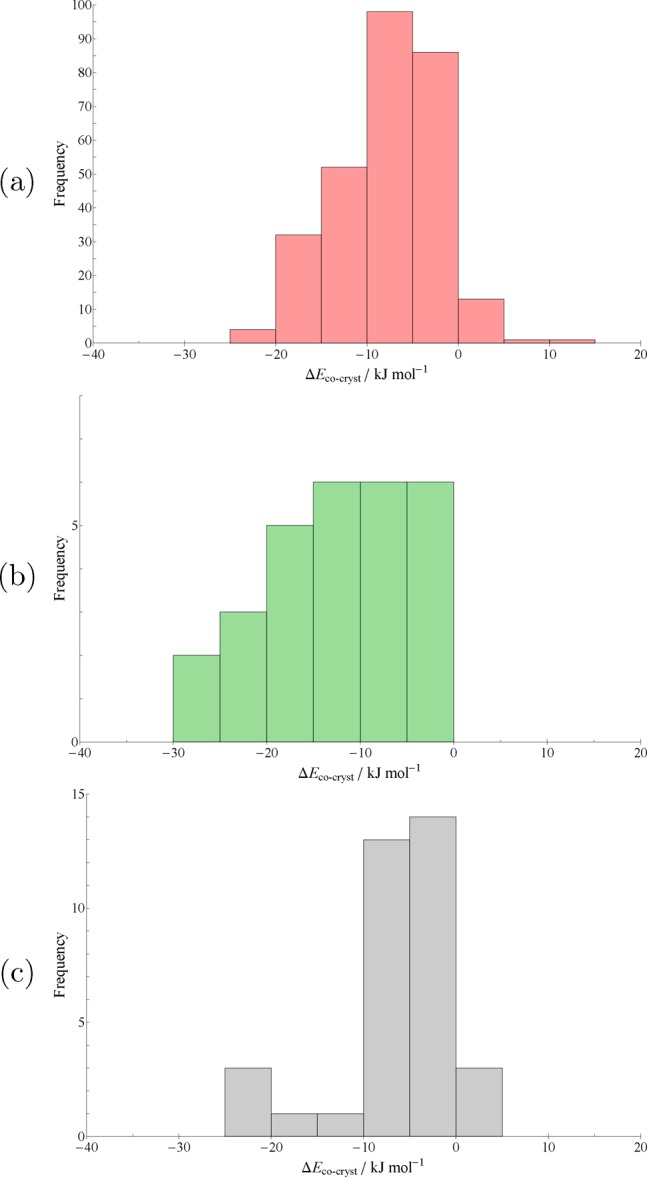
PBE+D3 relative stabilities of our test set of 350 cocrystals, broken down into subsets of (a) hydrogen-bonded (red), (b) halogen-bonded (green), and (c) “weakly-bound” (gray) systems. Each histogram spans the same energy range on the horizontal axis, but note the different frequency ranges on the vertical axes, due to the different subset sizes.
The most stable of our hydrogen-bonded cocrystals is RADHEL, a 1:2 cocrystal of 1,4-di[bis(4′-hydroxyphenyl)methyl]benzene (RADGUA) and 1,4-diazanaphthalene (HEYJOK01). Two additional hydrogen bonds are formed per molecule in the cocrystal, as the diazanaphthalene molecule cannot form hydrogen bonds on its own.
The least stable hydrogen-bonded cocrystal, which is also the least-stable cocrystal overall, is CSD refcode AWAJOX02—a cocrystal of 2,2′-diethoxy-α-truxilic acid and trans-2-ethoxycinnamic acid. This particular case seems to be due to conformational strain in one of the component molecules, as discussed in a later section.
Halogen-Bonded Cocrystals
As there are fewer structures than in any of the other cocrystal subsets, the energies of the individual structures are also presented as a pair of bar charts in Figure 3.
Figure 3.
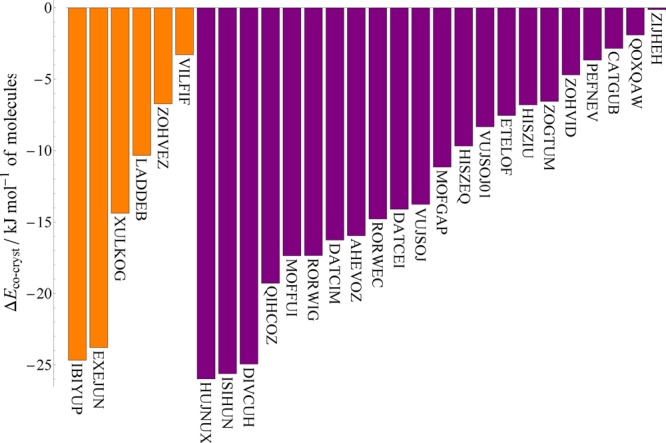
PBE+D3 relative stabilities of the subset of halogen-bonded cocrystals. Orange bars indicate structures in which bromine forms the halogen bond, while purple bars indicate iodine. Each structure is labeled by the CSD refcode of the cocrystal.
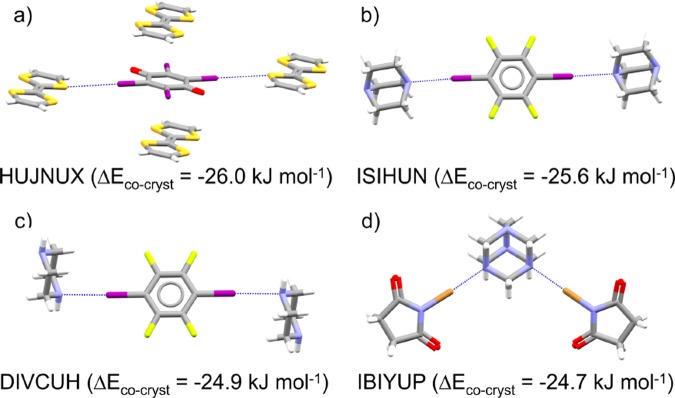
The most stable halogen-bonded cocrystal is also the most stable of all the cocrystals that we consider in this work: HUJNUX, a 1:1 cocrystal of tetraiodo-para-benzoquinone and tetrathiafulvalene (TTF), with a relative stability of −26.0 kJ mol–1 (Figure 4a). The cocrystal gains two halogen bonds per molecule, though this is also true of a number of other, less-stable cocrystals in our set. As well as the I···S halogen bonds that are formed in the cocrystal, the large stability of this cocrystal is most likely related to charge transfer between the stacked, planar donor and acceptor molecules.44 The next most stable halogen bonded cocrystals (Figure 4b–d) have no other obvious strong intermolecular interactions, so most likely gain their stability through the halogen bonds themselves. These involve highly polarized halogen atoms, such as the iodine in 1,4-diiodo-2,3,5,6-tetrafluorobenzene (ISIHUN, DIVCUH) or the bromine in N-bromosuccinimide (IBIYUP).45
Figure 4.
Four halogen bonded cocrystals found to be most stable with respect to their single component structures: (a) HUJNUX, tetraiodo-para-benzoquinone: tetrathiafulvalene (TTF), (b) ISIHUN, (c) DIVCUH, and (d) IBIYUP. Atoms are colored by element type: gray = carbon; white = hydrogen; blue = nitrogen; red = oxygen, light yellow = fluorine, yellow = sulfur; purple = iodine; brown = bromine. Dashed blue lines indicate halogen bonds. Cocrystal energies are given in kJ mol–1 per molecule with respect to the single-component crystals of their components.
Meanwhile, the least stable halogen-bonded cocrystal, ZIJHEH, is a 1:1 system of 3,6-diiodotetrachlorobenzene (ZZZAVM02) and 4-methylbenzenesulfinamide (ZIJGOQ). This structure gains only one halogen bond per molecule, among the fewest in our set, and ΔEcocryst is only −0.1 kJ mol–1.
It is not possible to state that either halogen leads to more stable cocrystals than the other—though the bromine-bonded sample is considerably smaller, both samples display similar distributions of ΔEcocryst. This is particularly noticeable when considering the ZOHVEZ/ZOHVID pair, 1:1 cocrystals of 3,4,5-trichlorophenol and para-haloaniline featuring halogen···Cl interactions, that are chemically identical apart from the halogen atom present (Br in ZOHVEZ and I in ZOHVID). Despite the change in halogen atom, the ΔEcocryst values obtained are −6.7 and −4.7 respectively; the difference between these is small and within the estimated uncertainty of the energy calculations. The two cocrystal structures are isostructural with very small differences in atomic coordinates, indicating that the considerable increase in size of the I atom relative to the Br atom does not affect the packing of the cocrystal. This is despite the fact that the single-component structures of the haloanilines pack differently. At least in this case, substituting Br with I does not substantially affect the relative stability of the resulting cocrystal.
Weakly Bound Cocrystals
Our “weakly bound” subset of cocrystals (Figure 2c) is perhaps the most visibly distinct from the overall distribution of relative stabilities (Figure 1). A larger proportion of weakly bound structures have small or slightly positive relative stability values compared with the overall set or the other subsets. The least-stable weakly bound structure is IFIMAL, a 2:1 (defined in the CSD as being 1:1/2) cocrystal of endo4a,5,8,8a-tetrahydro-5,8-ethano-1,4-naphthoquinone (HETNQU) and para-benzoquinone (BNZQUI).
However, there is also a larger proportion of very stable (25–30 kJ mol–1) cocrystals in the weakly bound set compared to the other subsets. This is perhaps counterintuitive, as one might expect the lack of strong, directional interactions to reduce the likelihood of the cocrystal being significantly more stable. As we found in the halogen bond set, the most stable cocrystal structure is likely a charge transfer complex. This most stable structure is PINHID, a 1:1 cocrystal of 6,12-dioxa-anthanthrene (or peri-xanthenoxanthene, QUPMUJ10) and tetracyanoquinodimethane (TCNQ, CSD refcode TCYQME), with ΔEcocryst = −23.6 kJ mol–1 (per molecule).
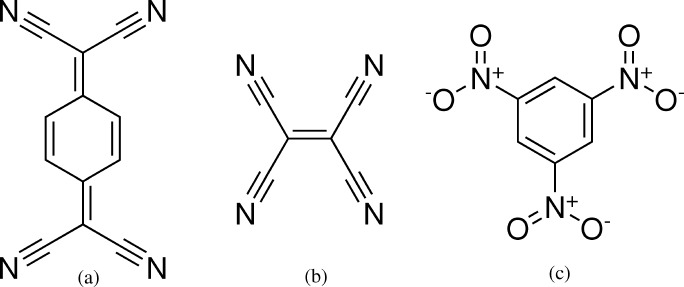
In fact, many of the more-stable half of the weakly bound cocrystal subset are found to contain TCNQ, tetracyanoethylene (TCNE, CSD refcode TCYETY), or trinitrobenzene (TNBENZ) (Figure 5), which all have electron-deficient π-systems and are typical acceptor species in charge-transfer systems, paired with planar aromatic donors. All of the low energy cocrystals (up to ΔEcocryst = −4.2 kJ mol–1) in this set contain aromatic donor and acceptor molecules, all with face-to-face packing in their cocrystal structures and the possibility for charge transfer between coformers. Therefore, it is likely that many of the unusually stable “weakly bound” systems are in fact charge-transfer cocrystals with strong interactions between donor and acceptor species.
Figure 5.
Three examples of common molecules in our weakly bound cocrystal set: (a) tetracyanoquinodimethane (TCYQME), (b) tetracyanoethylene (TCYETY02), and (c) trinitrobenzene (TNBENZ13). All three species are electron-deficient and commonly used as acceptor species in charge-transfer complexes.
The most stable cocrystal in this subset that lacks face-to-face packing of aromatic donor and acceptor molecules is the 1:1 cocrystal of 4,4′-bipyridine with 1,4-diethynylbenzene (RUXMAZ, ΔEcocryst = −4.2 kJ mol–1), which contains C–H···N interactions (C–H···A interactions were not classed as hydrogen bonds in our definition of cocrystal subsets). As we did not specifically target our search to include or exclude particular types of systems in this case (unlike for the halogen bonds), this indicates a considerable experimental bias in the CSD toward charge-transfer systems among cocrystals that lack hydrogen bonds or halogen bonds. It is possible this is precisely because the lack of other sources of strong, directional interactions in weakly bound cocrystals discourages attempts at their synthesis.
Comparison of Subsets
Table 1 presents a summary of the calculated energies categorized by the type of interactions present. We preface our analysis by highlighting that the considerably smaller halogen-bonded and weakly bound sets may be less representative of their overall category than the hydrogen-bonded set.
Table 1. Minimum, Mean, and Maximum Relative Stabilities (kJ mol–1 per molecule) Calculated Using PBE+D3 for our Subsets of Experimental Cocrystal Structures, Categorized by the Presence or Absence of Strong Interactionsa.
|
ΔEcocryst/kJ mol–1 |
|||||
|---|---|---|---|---|---|
| type | structures | min | mean | max | N(ΔEcocryst > 0) |
| hydrogen-bonded | 287 | –24.6 | –7.7 | +10.3 | 15 (5.2%) |
| halogen-bonded | 28 | –26.0 | –12.6 | –0.1 | 0 |
| weakly bound | 35 | –23.6 | –6.5 | +1.1 | 3 (8.6%) |
Also shown is the proportion of structures with relative stabilities greater than zero (indicating instability compared to the single-component structures).
Regarding the energetics of the three different categories, we see that there is only a slight difference in the average relative stability between the hydrogen-bonded and weakly bound subsets, but the average relative stability of halogen-bonded systems appears to be markedly greater (by around 5 kJ mol–1). Given their relative scarcity in the CSD (we obtained approximately 1% as many halogen-bonded cocrystals compared to general cocrystals in our searches), they are overrepresented in our overall set of structures, and their greater average relative stability could therefore bias our overall relative stability values slightly. It is clear that, at least for the structures considered in our searches, halogen-bonding leads, on average, to considerably more stable cocrystals relative to the single component structures.
The difference between the average values for the hydrogen-bonded and weakly bound sets, on the other hand, is considerably smaller, only 1.2 kJ mol–1 in favor of hydrogen-bonded cocrystals. The sign of this difference agrees with chemical intuition that cocrystal synthesis via formation of more complementary (or stronger) hydrogen bonding relative to the single component might lead to more stable cocrystals. In turn, the energetics of weakly bound systems might be expected to be less sensitive to their composition due to the nonspecificity of the interactions, leading to less strongly favored cocrystals on average. As discussed above, all of the most stable cocrystals in the “weakly bound” subset are composed of charge donor–acceptor molecules that probably lead to charge-transfer complexes. Apart from likely charge-transfer complexes, the ΔEcocryst values in the “weakly bound” subset are −4.2 kJ mol–1 or smaller.
The minimum values of ΔEcocryst across the three sets show relatively little variation (no more than 1.5 kJ mol–1), suggesting that the greatest possible stability is also not necessarily intrinsic to a particular category, and therefore that the most stable of all cocrystals are not necessarily those with strongly directional, specific interactions. However, the maximum value of ΔEcocryst (i.e., the greatest instability) is considerably larger for the hydrogen-bonded set. The least stable cocrystal is AWAJOX02, with ΔEcocryst = 10.3 kJ mol–1; this structure, which is discussed further below, is a result of a photodimerization reaction of ortho-ethoxy-trans-cinnamic acid, leading to a 1:1 cocrystal of the photodimerization product with unreacted ortho-ethoxy-trans-cinnamic acid.46 Given the unusual route to this cocrystal, it is unsurprising that the energy of the cocrystal structure is an outlier in our data set. Apart from AWAJOX02, the next least stable cocrystal is ABUCIP, a cocrystal of the agrochemical thiophanate-ethyl and 2,2′-bipyridine with ΔEcocryst = 5.8 kJ mol–1, which is still noticeably higher than any structures in the halogen bonding or “weakly bound” subsets. This higher maximum ΔEcocryst may simply be due to greater sampling of that population, or perhaps a greater systematic error in the description of hydrogen-bonding using the PBE+D3 level of theory (though the latter might be expected to largely cancel out when considering energy differences). Alternatively, it may be that hydrogen bonding does occasionally result in cocrystals that are thermodynamically unfavorable—perhaps due to the hydrogen bonds encouraging nucleation pathways that yield the cocrystal (i.e., perhaps kinetic effects driving structures to higher-energy local minima are more significant in hydrogen-bonded systems).
On the other hand, when looking at the proportion of cocrystals that are unstable in a given subset, this quantity is greatest for weakly bound cocrystals, which suggests these combinations of systems are more likely to yield less-stable cocrystals, as might be expected from chemical intuition. However, the effect of small sample size is particularly noticeable here—if just one of these structures with ΔEcocryst > 0 were excluded, this proportion would move much closer to the hydrogen-bonded set. While our halogen-bonded subset is also quite small, it is a much larger proportion of all halogen-bonded cocrystal systems in the CSD than the other subsets are of their categories. Hence, we can more confidently state that the lack of any significantly unstable halogen-bonded systems indicates that these interactions are particularly useful for synthesis favoring cocrystals.
To improve our understanding and rationalize the distributions we observe, we now consider further specific cases, as well as to attempt to correlate the distributions we obtain with chemical descriptors.
Individual Cocrystal Energetics of Note
Instability Caused by Molecular Strain
The most unstable cocrystal in our set is AWAJOX02, a hydrogen-bonded cocrystal of 2,2′-diethoxy-α-truxilic acid (XOSKEV) and ortho-ethoxy-trans-cinnamic acid (ZZZNQS05), which our procedure predicts to be 10.3 kJ mol–1 higher in energy than the single components. For both component molecules, the single-component structures display molecular geometries that resemble the gas-phase minima that chemical intuition would suggest. However, in the cocrystal, both molecules are noticeably distorted from those geometries—the 2,2′-diethoxy-α-truxilic acid geometry is compressed such that the overall shape is flattened (Figure 6), while ortho-ethoxy-trans-cinnamic acid’s conjugated backbone is noticeably nonplanar (approximately 10° deviation, while the molecule in the single-component case is nearly perfectly planar).
Figure 6.
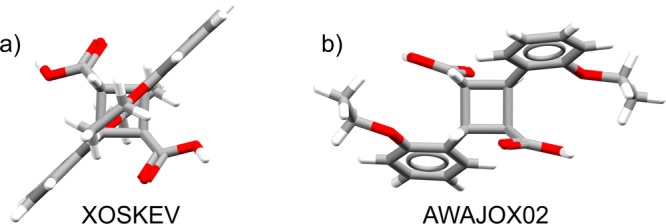
Molecular conformations of 2,2′-diethoxy-α-truxilic acid in (a) its single-component crystal structure (XOSKEV) and (b) the cocrystal (AWAJOX02) with ortho-ethoxy-trans-cinnamic acid.
Molecular geometry optimizations at a comparable level of theory to our crystal calculations (PBE+D3/6-311G** in Gaussian0940) confirm this hypothesis; in the cocrystal, AWAJOX02, the strain energy (the energy required to adopt the in-crystal conformation relative to the nearest local gas-phase minimum) is 48 kJ mol–1 for the truxilic acid and 20 kJ mol–1 for the cinnamic acid. In comparison, the pure truxilic acid crystal XOSKEV exhibits a molecular strain energy of 37 kJ mol–1, and the pure cinnamic acid ZZZNQS05 a strain energy of 17 kJ mol–1—the single-component structures place the molecules (particularly the truxilic acid) under markedly less strain than the cocrystal.
Note also that these strain energies are relative to the nearest gas-phase minimum to the observed in-crystal conformer—the XOSKEV gas-phase minimum is 6 kJ mol–1 higher in energy than that of the same molecule in AWAJOX02, meaning that the formation of the AWAJOX02 in-crystal conformation is further disfavored. Interestingly, but perhaps fortuitously, the sum of these strain energies relative to the lowest energy conformer and averaged over the two molecules in AWAJOX02 is about +10 kJ mol–1, i.e., very similar to the overall relative cocrystal stability we calculate. The unusual energetics of this cocrystal likely relate to its formation as the product of photodimerization of the α′ (Z′ = 3) polymorph of ortho-ethoxy-trans-cinnamic acid, in which two out of three independent molecules in the asymmetric unit combine to form the product, leaving one molecule unreacted in an ordered 1:1 cocrystal. Thus, the cocrystal exists as a result of this solid-state reaction, rather than the stabilization gained from combining the two molecules in a crystal. Our observations regarding intramolecular strain are in agreement with the observed buildup of molecular strain as the photodimerization reaction proceeds.46 The molecules are strained because they are constrained by the packing of the reactant ortho-ethoxy-trans-cinnamic acid polymorph.
Indications of Entropic Contributions to Small Stabilities
Another interesting, specific case is the cocrystal VIGDAR01, of celecoxib (DIBBUL) and nicotinamide (NICOAM), which recent experimental work by Zhang et al.47 has determined to be entropy-stabilized–the difference in enthalpy between the cocrystal and the single-component structures is positive. Being a cocrystal of nicotinamide, this is one of the systems previously investigated by Chan et al.,17 who predicted it to be slightly less stable than the single component structures in advance of the experimental work. (However, Chan et al. used the only available structure in the CSD at the time, VIGDAR, a very similar structure but one which they proposed had assignment errors that they corrected.17)
Our work predicts a slight energetic favorability of −1.9 kJ mol–1 for VIGDAR01, contrary to experiment. However, given that the uncertainty in our calculated energies is likely to be on the order of a few kilojoules per mole, we cannot definitively state that a value of this magnitude is indicative in either direction. Indeed, Chan et al. predict a similarly marginal value of +1.5 kJ mol–1 using PW91 with a dispersion correction (after a proposed structural reassignment), and it is known that periodic DFT can produce considerable variation in such small energy differences between crystal structures based on the functional employed (see, e.g., qualitative reordering of stability of polymorphs of organic semiconductors48).
While cocrystals with such small magnitude (in)stabilities cannot be firmly classified as more or less stable, such small computed values likely indicate cases where the cocrystal is potentially experimentally accessible, due to (for example) entropic effects at finite temperature reversing the relative stability computed at zero temperature. In particular, a small calculated stability of a cocrystal which contains at least one molecule with marked conformational freedom within the crystal structure might indicate potentially entropically stabilized cases like VIGDAR01. In this way, computing the relative stability can still be a powerful tool for predicting and validating experimental cocrystallization outcomes, even in cases where the cocrystal is not definitively more stable.
Cocrystal Packing Efficiency
We first consider as a descriptor the change in the packing efficiency (defined in eq 6) upon forming the cocrystal. Given that, according to our results in Figure 1 and Table 1, cocrystals are usually thermodynamically more stable than their single-component counterparts, we consider the possibility that this is purely down to improved efficiency of packing in the cocrystal (and therefore improved nonspecific interactions in general).
Figure 7.
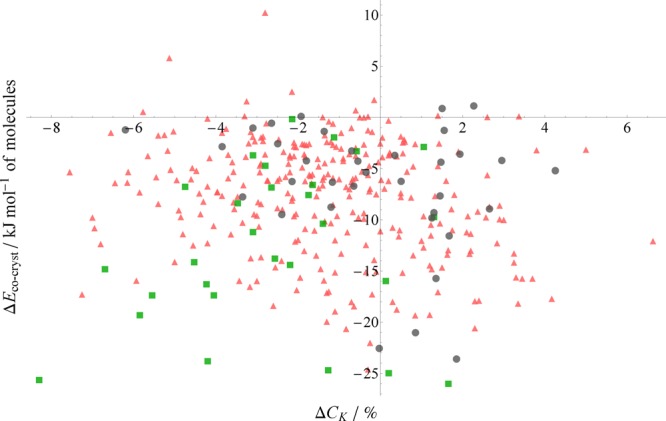
PBE+D3 relative stabilities of cocrystals plotted against the change in packing coefficient upon forming the cocrystal. A negative value of ΔCK indicates less efficient packing in the cocrystal. Red triangles are from our hydrogen-bonded set, green squares are halogen-bonded, and gray circles are weakly bound cocrystals.
One significant finding is that the majority of cocrystals (245 cocrystals, 70% of the set) pack less efficiently than their single-component counterparts—evidently the energetic drivers of cocrystallization are more complex than simply improved packing in the cocrystal. One interpretation of this observation is that the directionality of the strong, specific interactions (such as hydrogen or halogen bonds) used to form cocrystals forces their structures to sacrifice close packing to improve the geometry of these interactions.
Unfortunately, our calculations reveal no clear correlation between relative stability and the change in packing efficiency. The overall set displays virtually no relationship; examining the subsets, only the halogen-bonded subset displays even a qualitative relationship, which in this case is negative—less densely packed cocrystals tend to have greater relative stabilities. Even this, however, is subject to a number of exceptions.
This is perhaps unsurprising, as it has been observed that the packing efficiency alone is a very poor predictor for many physical properties of crystals.49 It can clearly be said that cocrystallization occurs despite generally resulting in less favorable packing, but no significant trend, either overall or within the subsets of interaction types, can be seen. Evidently, packing information alone is insufficient to rationalize the relative stabilities we obtain.
Hydrogen-Bonding Analysis
As discussed, chemical intuition often leads to synthetic routes to cocrystals that attempt to either create new hydrogen bonds that are not possible in the single-component structures, or to improve the quality of the hydrogen bonds that do form. However, our results (Figure 1 and Table 1) indicate that the presence alone of hydrogen bonding is not sufficient to yield more-stable cocrystals compared to the other sets of cocrystals. We now consider whether the change in hydrogen-bonding in the cocrystal can be correlated with its stability—in the first instance by simply considering the number of hydrogen bonds gained or lost, and in the second by quantifying the quality of the hydrogen bonds formed. The presence of hydrogen bonding is not confined to our “hydrogen-bonding” subset; however, 11 of the cocrystals in our halogen-bonded subset also display hydrogen bonding as well. Hence, we include these structures in the following analysis.
It was found in the course of analyzing the hydrogen bonding in our structures that six of our cocrystals underwent proton transfer during the periodic DFT optimizations. All six structures feature O–H···N hydrogen bonds, along which coordinate the hydrogen atom transfers to protonate the N atom during the optimization. Evidently, at this level of theory, the experimental structures as presented in the CSD were unstable with respect to proton transfer between the species, resulting in these structures forming salts. It would, of course, be interesting to revisit these structures experimentally to verify the proton positions and monitor whether proton transfer occurs at low temperature (recalling that our calculations are temperature-free), as well as examining the sensitivity of proton transfer to the computational method (e.g., DFT functional). These structures are listed in the Supporting Information; their energies have been retained in the data in Figure 1 and Table 1, but they are omitted from the hydrogen-bond analysis.
Simple Hydrogen-Bond Count
Presented in Figure 8 is a plot of the computed relative stability of each cocrystal against the overall change in the average number of hydrogen bonds per molecule. For obvious reasons, here we only include structures within the hydrogen-bonded subset plus any from the halogen-bonded subset which also feature hydrogen bonding. Immediately apparent is the considerable majority (246, 84.3% of the set) of cocrystals which have exactly zero net change in the number of hydrogen bonds present compared to the single-component structures. Those cocrystals which do change the number of hydrogen bonds per molecule are nearly five times more likely to gain than lose them—13.0% of all structures considered compared to 2.7%, respectively—as might be expected if synthetic procedures are guided by complementary pairing of donor and acceptor molecules.
Figure 8.
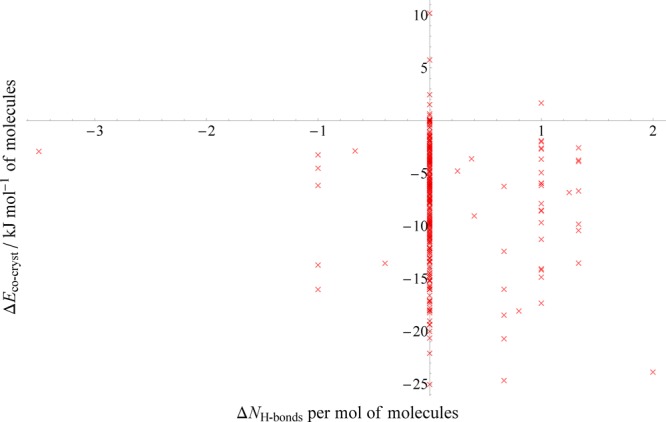
PBE+D3 relative stabilities of cocrystals plotted against the overall change in the number of hydrogen bonds per molecule upon forming the cocrystal. Positive values indicate more hydrogen bonds in the cocrystal. Only the 292 cocrystals from our set in which hydrogen bonding occurs are plotted here; 281 from the hydrogen-bonded subset (287-6 that underwent proton transfer) and 11 additional structures in the halogen-bonded subset.
More surprisingly, Figure 8 indicates that, even in the minority of cases in which the hydrogen bond count does change, there is no significant correlation with the computed relative stability. The overall picture is that an increased number of hydrogen bonds per molecule has no systematic effect on the relative stability of the cocrystal. Indeed, there is a slight trend for structures which do gain in hydrogen bonds to be less stable on average as the number of hydrogen bonds increases above 0.5 per molecule, though this is unlikely to be significant. Interesting, both the most extreme gain (+2) and the most extreme loss (−31/2) in hydrogen bonds occur in the halogen-bonded set.
Examining the systems that behave contrary to the presumed relationship that more hydrogen bonds leads to greater stability does not reveal anything unusual. Consider VEKKEB, a 2:1 cocrystal of acetophenone (ACETPH) and trans-9,10-dihydroxy-9,10-diphenyl-9,10-dihydroanthracene (DIKCOP01), and one of the cocrystals with the largest gain in hydrogen bonds per molecule (11/3 on average). Yet the relative stability of VEKKEB is only −2.5 kJ mol–1, well below the average value. Its single-component structures exhibit no hydrogen bonding, and both molecules are reasonably rigid, so there are no obvious indicators that either of the single-component structures are unusually stable and would therefore lead to only a marginally stable cocrystal. On the other hand, CEKKOU, a 1:1 cocrystal of benzene-1,2,3-triol (PYRGAL02) and 1,10-phenanthroline (OPENAN), has a considerable and above-average relative stability of −15.9 kJ mol–1 despite losing an average of one hydrogen bond per molecule upon forming the cocrystal. While OPENAN cannot form hydrogen bonds in the pure crystal due to only possessing acceptor atoms, PYRGAL02 has three hydroxyl groups and forms six hydrogen bonds per molecule in the crystal, which one might assume would make it unusually stable and thus disfavor formation of the cocrystal CEKKOU, the opposite of what we calculate.
Contrary to chemical intuition, it appears that the simple change in hydrogen bond count does not correlate with the stability of the resulting cocrystal. One weakness of this descriptor is that it considers all H-bonds equally—no chemical or geometric information is involved (apart from the criteria used to define what contacts are H-bonds in the first place). Hence, the H-bonds are binary—they either exist or do not—and there is no measure of their quality or strength. Clearly, a descriptor which very often shows a change of exactly zero between cocrystal and single components is of minimal benefit.
Weighting by Hydrogen-Bond Strength
A more physically meaningful descriptor instead considers the change in both the number and quality of hydrogen bonds, using the electrostatic H-bond attraction measure we define in eq 4. While this now requires specific geometric information from the crystal structures, it allows us to quantify the strength of a hydrogen bond and therefore numerically describe the change in strength of H-bonding between structures. Figure 9 shows the cocrystal relative stability as a function of the total change in the hydrogen bond electrostatic attraction upon forming the cocrystal. Note that the magnitudes of the hydrogen bond energies are large because we have not included the repulsion energy that typically cancels much of the electrostatic stabilization of hydrogen bonds.
Figure 9.
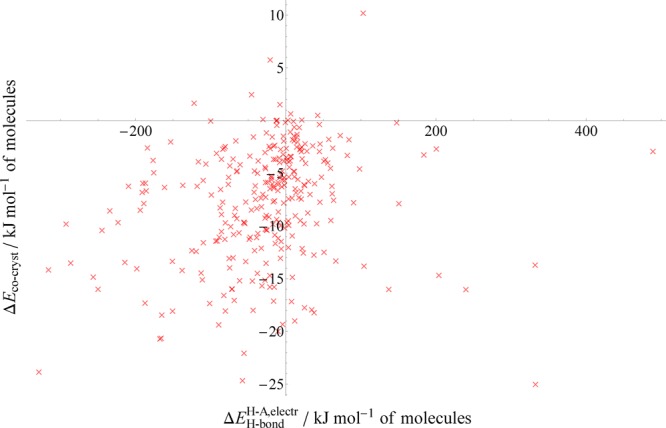
Relative stabilities of cocrystals as a function of the change in the H-bond strength measure defined in eq 4. Note that this measure considers only the Coulombic attraction between H and A, hence the magnitude of the values along the x-axis.
Although the correlation between this descriptor and the relative stability is very weak (R2 = 0.05), there is a statistically significant proportional relationship (P-value = 4 × 10⁻⁴, relative to a random normal distribution of points). Broadly speaking, a gain in overall hydrogen bonding strength usually leads to a gain in cocrystal stability, though the magnitude of the latter is very weakly correlated with the gain in strength.
As an attempt to incorporate greater physical accuracy into our hydrogen bond strength measure, we also recalculated the changes in hydrogen bond strength including the acceptor–donor Coulombic interaction as well. The strength measure therefore considers a system akin to a model dipole, with the acceptor Coulombically interacting with both the hydrogen atom and the donor atom. Unfortunately, this model not only failed to improve the relationship observed between the change in strength of the hydrogen bond and the cocrystal, it qualitatively altered the character of the hydrogen bond measure (around 20% of all our crystal structures had a net positive, i.e., repulsive hydrogen bond energy when the D···A interaction was included). We present this data in the Supporting Information, but here simply state that this attempt to improve our energetic description of the hydrogen bonding was unsuccessful.
Halogen-Bond Counts
None of the corresponding single-component structures of the halogen bond cocrystal subset exhibit halogen bonding, so when analyzing the effect of halogen bonding on the cocrystal stability, we may count those in the cocrystals alone. Figure 10 presents the relative stabilities of the halogen-bonded cocrystals as a function of the number of halogen bonds gained per molecule in the cocrystal structure.
Figure 10.
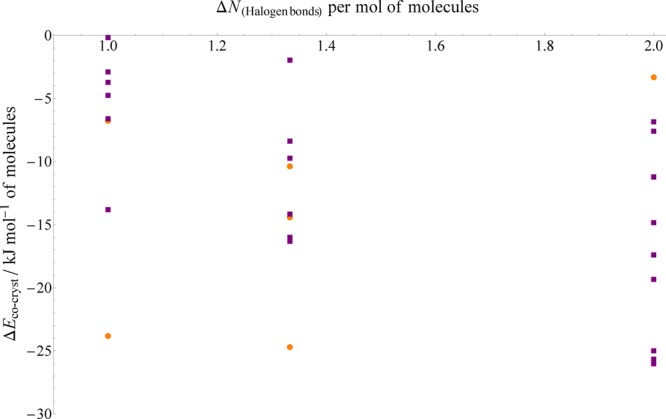
PBE+D3 relative stabilities of halogen-bonded cocrystals plotted against the gain in halogen bonds per molecule. Orange circles indicate structures in which bromine forms the halogen bond, while purple squares indicate iodine.
The bromine-bonded systems exhibit no particular relationship between their relative stabilities and bromine bond counts; there are only six structures amd it is not possible to discern a meaningful trend. However, the iodine-bonded systems, while displaying considerable variation, do exhibit a noticeable trend toward increasing stability with increasing iodine bond count. The distributions for each value of the bond count (1, 11/3, and 2 per molecule) shift toward increasing stability as the bond count increases–the minimum, maximum, and average values all become more negative. (Note that the noninteger change in halogen bonds of 11/3 results from cases where a system of 2:1 stoichiometry, such as the cocrystal LADDEB, gains one halogen bond to the first molecule and two to the second, giving a total of four halogen bonds averaged over three molecules.)
The reasons for this relationship applying only to the iodine-bonded cases are uncertain, though it is possible that iodine bonds are sufficiently strong compared to bromine bonds that they make up a larger proportion of the change in energy between the cocrystal and single-component structures. Regardless, the number of new iodine bonds created in the cocrystal appears to offer modest predictive power as to the degree to which it is more stable than the single-component structures.
Perhaps the clearest outlier is the bromine-bonded cocrystal EXEJUN (relative to components FATLER01 and HXMTAM07), the fifth-most stable halogen-bonded cocrystal (ΔEcocryst = −23.8 kJ mol–1) despite only gaining one halogen bond per molecule. However, upon inspection, this cocrystal’s stability may be due to a considerable change in hydrogen bonding; EXEJUN contains two hydrogen bonds to each molecule in addition to the halogen bond, while no hydrogen bonding is present in either of the single component structures. (Note that this is already a more extreme change in hydrogen bonding per molecule than exhibited by any of the hydrogen-bonded cocrystal set.)
Combining Hydrogen Bonding and Packing Efficiency
The most informative description is obtained by simultaneously considering the change in packing coefficient in the cocrystal and the measure of the change in hydrogen bond strength, as is shown in Figure 11, where points are colored according to ΔEcocryst.
Figure 11.
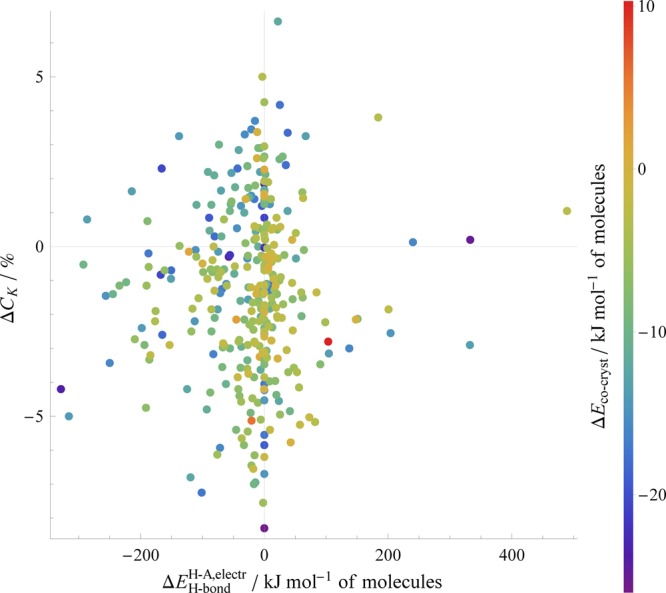
Relative stabilities of cocrystals (indicated by color) as a function of both the change in packing coefficient and the change in the H-bond strength measure. Note that a more negative value for ΔEH-bond indicates a net gain in strength in the cocrystal. This plot includes all of our cocrystals except for the six structures found to undergo proton transfer in their structural optimizations.
While the data presented still show considerable variation, there is a general agreement with chemical intuition when our descriptors are combined. More stable cocrystals tend to be those that both increase the strength of the H-bonds present and increase their efficiency of crystal packing (i.e., those points in the upper-left quadrant) relative to the single component structures. Conversely, the less-stable cocrystals tend to be those that show little gain or a net loss in H-bond strength, as well as having less efficient packing.
As mentioned, a majority of the cocrystals considered pack less efficiently than their single-component structures. This is despite the overwhelming proportion of cocrystals that our PBE+D3 optimizations predict to be more stable. In some cases, this less-efficient packing is offset by a gain in H-bond strength. However, the spread of data in Figure 11 indicate that a simple balance of these two factors is insufficient to explain the variation in the relative stabilities observed; several comparatively stable cocrystals demonstrate both a loss in packing efficiency and a considerable loss in H-bond strength. Moreover, two of our most stable cocrystals either suffer a large loss in hydrogen-bonding (and very little change in packing) or a very large loss in packing efficiency (and have no hydrogen bonding). Evidently, the complexities of intermolecular interactions driving cocrystallization cannot be completely described by such comparatively simple descriptors.
Limitations of Descriptors
A major drawback of both the packing efficiency and the hydrogen bond strength descriptor is that they are dependent on the crystal structure, not merely molecular information. (The straightforward count of hydrogen bonds, while also dependent the crystal structure, is at least constrained by the structure of the individual molecules and the stoichiometry in the cocrystal.) This reduces the utility of these descriptors for predicting the stability of cocrystals based solely on the molecules involved—a desirable goal for crystal engineering purposes.
However, these descriptors still can be useful to provide a qualitative model for the relative stability of a hypothesized structure without requiring an expensive periodic DFT optimization, and the relative difference in descriptors may be more informative than the absolute values. If a hypothetical cocrystal structure demonstrates both reduced packing efficiency and weaker H-bonding compared to its single components, it is unlikely to be considerably more stable according to our calculations. Such a structure may therefore be less worthy of synthetic targeting than another cocrystal structure in which both descriptors improve.
It is notable that these descriptors are not necessarily independent of each other–the H-bond strength measure (depending as it does on rHA) can in principle be improved through denser packing without any substantial rearrangement of molecules, e.g., in the trivial case of compression of a given crystal structure. However, there is no systematic physical link between the two descriptors, and the data in Figure 11 show the values obtained tend to be largely independent of each other in practice.
It should also be mentioned that our method for computing the partial charges for measuring the H-bond strength acts on the isolated gas-phase molecules in their crystal geometry—the only influence of the surrounding crystal environment on these charges is indirect, in enforcing the precise molecular conformation adopted. Our H-bond strength measure lacks any description of polarization due to neighboring molecules (even the other molecule involved in the H-bond) and is therefore only a basic description of this interaction.
A stronger correlation between the descriptors and stability might be also seen in a set which does not focus solely on observed structures. Our use of structures from the CSD restricts our test set to systems which are already experimentally known, and there are physical factors that could promote the formation of a cocrystal beyond the packing and specific interactions—for example, kinetic or solvent effects during the crystallization process—such that it is observed regardless of the change in packing efficiency or the H-bond interaction network. However, given our focus on rationalizing cocrystal formation for experimentally observed cases, and the expense of considering a chemically as well as crystallographically diverse set of hypothetical computationally generated structures, we leave such exploration to future efforts.
Conclusions
We have demonstrated that periodic DFT using the PBE+D3 level of theory predicts the vast majority of organic cocrystals to be energetically more stable than their single-component counterparts. Cocrystallization seems to almost always be a thermodynamically favorable process, with 95% of cocrystals more stable than their single-component structures. The characteristic gain in stability upon cocrystallization averages 8 kJ mol–1 (per molecule), a value considerably greater than that associated with crystalline polymorphism but well within the region of relevance for computational CSP studies.
Both the sign and magnitude of this stability are in very good agreement with previous, smaller studies of specific, chemically related sets of molecules. We find that considering our own specific set of halogen-bonded cocrystals reveals a slightly greater stability than the general lighter-element organic case, and that all of the halogen-bonded systems we consider are more stable as the cocrystal than as separate single-component crystals.
We have also shown that the gain in stability upon cocrystallization is a complex phenomenon that is not necessarily well-described by changes in basic environmental or crystalline descriptors like molecular hydrogen bond count, strength of hydrogen bonding, or crystalline packing efficiency. Qualitative overall trends can be observed that match chemical intuition—more strongly hydrogen-bonded and efficiently packed cocrystals tend to be more stable. However, the considerable variance and significant number of exceptions in the general data set support the idea that cocrystallization is driven by a wide range and balance of physical factors that are not encapsulated by these descriptors. That said, when looking at extremes of stability or at groups of specific, more closely related systems such as halogen-bonded cocrystals, it appears that these basic descriptors can be of some utility in rationalizing the observed stability. Such descriptors may therefore be more appropriately used in narrowly targeted surveys of related systems. This is particularly true of, for example, the increase in number of halogen bonds, which tracks well with the typical relative stability in the specific case of iodine-bonded systems.
The size of our test set and the expense of periodic DFT limit us to employing only one exchange-correlation functional and dispersion correction scheme, but we suggest that the wide variety of cocrystal systems considered and the sheer size of the set (at least three times larger, and much more chemically diverse, than any other DFT study yet undertaken) make our conclusions reasonably applicable to the general case. Even if the precise value of the stability may vary due to a systematic inaccuracy of the functional, we emphasize that the size and breadth of the test set make our study more illuminating of cocrystallization generally than conclusions obtained from a considerably smaller test set assessed with a more expensive method or a range of functionals.
We have made our set of optimized structures available in the Supporting Information, along with the identification of the relevant single-component structures for each cocrystal. It is our hope that, beyond our evaluation of the characteristic relative stability, this data set enables further work exploring the phenomenon of cocrystallization in general.
The availability of our benchmark value for the relative stability of organic cocrystal systems will also inform computational CSP studies, both for the prediction of specific cocrystal structures as well as for indicating when single-component structures may compete with cocrystals in the configuration space. Experimental work can also be assured that cocrystallization is predicted by theory to generally be a thermodynamic process, which may help to provide routes for the simplification or streamlining of cocrystal screening procedures. Along these lines, a particularly relevant avenue for further computational work is consideration of the effects of thermal motion on the relative cocrystal stability via the calculation of, e.g., lattice free energies as has been performed in our group for crystal polymorphs.6
The range of calculated values of the stability highlights the importance of using the most physically accurate possible description of systems that is still computationally tractable, as attempting to explain or rationalize such complex and multifaceted interactions using simple descriptors or highly approximate interaction models can be unrepresentative of the true energetics of cocrystallization. The current work demonstrates the power of high-level quantum mechanical methods to provide insights that should be valuable in interpreting and guiding the experimental study of cocrystals, as well as computational efforts aimed at predicting cocrystallization.
Acknowledgments
We thank the European Research Council for funding under the European Union’s Seventh Framework Programme (FP/2007-2013)/ERC Grant Agreement No. 307358 (ERC-stG-2012-ANGLE). We acknowledge the use of the IRIDIS High Performance Computing Facility, and associated support services at the University of Southampton, in the completion of this work. We also acknowledge the ARCHER UK National Supercomputing Service which was accessed via the UK’s HPC Materials Chemistry Consortium membership, which is funded by the EPSRC (EP/L000202).
Supporting Information Available
The Supporting Information is available free of charge on the ACS Publications website at DOI: 10.1021/acs.cgd.7b01375.
Description of CSD search, list of common solvents, structures that undergo proton transfer upon optimization, and results of hydrogen bond calculation including donor–acceptor Coulombic repulsion (PDF)
Tables of cocrystal Cambridge Structural Database refcodes with their corresponding single-component structures, calculated relative stabilities, and specific interaction counts (XLSX)
Optimized PBE+D3 structures for all co-crystals and their single-component structures, provided in crystallographic information file (.cif) format (ZIP)
The authors declare no competing financial interest.
Special Issue
Published as part of a Crystal Growth and Design virtual special issue Honoring Prof. William Jones and His Contributions to Organic Solid-State Chemistry
Supplementary Material
References
- Thakuria R.; Delori A.; Jones W.; Lipert M. P.; Roy L.; Rodríguez-Hornedo N. Int. J. Pharm. 2013, 453, 101–125. 10.1016/j.ijpharm.2012.10.043. [DOI] [PubMed] [Google Scholar]
- Karki S.; Friščić T.; Fábián L.; Laity P. R.; Day G. M.; Jones W. Adv. Mater. 2009, 21, 3905–3909. 10.1002/adma.200900533. [DOI] [Google Scholar]
- Yan D.; Delori A.; Lloyd G. O.; Friščić T.; Day G. M.; Jones W.; Lu J.; Wei M.; Evans D. G.; Duan X. Angew. Chem., Int. Ed. 2011, 50, 12483–12486. 10.1002/anie.201106391. [DOI] [PubMed] [Google Scholar]
- Trask A. V.; Motherwell W. D. S.; Jones W. Cryst. Growth Des. 2005, 5, 1013–1021. 10.1021/cg0496540. [DOI] [Google Scholar]
- Fleischman S. G.; Kuduva S. S.; McMahon J. A.; Moulton B.; Bailey Walsh R. D.; Rodríguez-Hornedo N.; Zaworotko M. J. Cryst. Growth Des. 2003, 3, 909–919. 10.1021/cg034035x. [DOI] [Google Scholar]
- Nyman J.; Day G. M. CrystEngComm 2015, 17, 5154–5165. 10.1039/C5CE00045A. [DOI] [Google Scholar]
- Nyman J.; Day G. M. Phys. Chem. Chem. Phys. 2016, 18, 31132–31143. 10.1039/C6CP05447A. [DOI] [PMC free article] [PubMed] [Google Scholar]
- Musumeci D.; Hunter C. A.; Prohens R.; Scuderi S.; McCabe J. F. Chem. Sci. 2011, 2, 883–890. 10.1039/c0sc00555j. [DOI] [Google Scholar]
- Aakeroy C. B.; Wijethunga T. K.; Desper J. New J. Chem. 2015, 39, 822–828. 10.1039/C4NJ01324G. [DOI] [Google Scholar]
- Delori A.; Galek P. T. A.; Pidcock E.; Patni M.; Jones W. CrystEngComm 2013, 15, 2916–2928. 10.1039/c3ce26765b. [DOI] [Google Scholar]
- Klamt A. J. Cheminform. 2012, 4, O14. 10.1186/1758-2946-4-S1-O14. [DOI] [Google Scholar]
- Wicker J. G. P.; Crowley L. M.; Robshaw O.; Little E. J.; Stokes S. P.; Cooper R. I.; Lawrence S. E. CrystEngComm 2017, 19, 5336–5340. 10.1039/C7CE00587C. [DOI] [Google Scholar]
- Cruz-Cabeza A.; Day G. M.; Jones W. Chem. - Eur. J. 2008, 14, 8830–8836. 10.1002/chem.200800668. [DOI] [PubMed] [Google Scholar]
- Karamertzanis P. G.; Kazantsev A. V.; Issa N.; Welch G. W.; Adjiman C. S.; Pantelides C. C.; Price S. L. J. Chem. Theory Comput. 2009, 5, 1432–1448. 10.1021/ct8004326. [DOI] [PubMed] [Google Scholar]
- Bučar D.-K.; Day G. M.; Halasz I.; Zhang G. G. Z.; Sander J. R. G.; Reid D. G.; MacGillivray L. R.; Duer M. J.; Jones W. Chem. Sci. 2013, 4, 4417–4425. 10.1039/c3sc51419f. [DOI] [Google Scholar]
- Cruz-Cabeza A. J.; Karki S.; Fabian L.; Friščić T.; Day G. M.; Jones W. Chem. Commun. 2010, 46, 2224–2226. 10.1039/b922955h. [DOI] [PubMed] [Google Scholar]
- Chan H. C. S.; Kendrick J.; Neumann M. A.; Leusen F. J. J. CrystEngComm 2013, 15, 3799–3807. 10.1039/c3ce40107c. [DOI] [Google Scholar]
- Issa N.; Karamertzanis P. G.; Welch G. W. A.; Price S. L. Cryst. Growth Des. 2009, 9, 442–453. 10.1021/cg800685z. [DOI] [Google Scholar]
- Gavezzotti A.; Colombo V.; Lo Presti L. Cryst. Growth Des. 2016, 16, 6095–6104. 10.1021/acs.cgd.6b01146. [DOI] [Google Scholar]
- Gavezzotti A. J. Phys. Chem. B 2002, 106, 4145–4154. 10.1021/jp0144202. [DOI] [Google Scholar]
- Otero-de-la Roza A.; Johnson E. R. J. Chem. Phys. 2012, 137, 054103. 10.1063/1.4738961. [DOI] [PubMed] [Google Scholar]
- Allen F. H. Acta Crystallogr., Sect. B: Struct. Sci. 2002, 58, 380–388. 10.1107/S0108768102003890. [DOI] [PubMed] [Google Scholar]
- van de Streek J. Acta Crystallogr., Sect. B: Struct. Sci. 2006, 62, 567–579. 10.1107/S0108768106019677. [DOI] [PubMed] [Google Scholar]
- Reilly A. M.; et al. Acta Crystallogr., Sect. B: Struct. Sci., Cryst. Eng. Mater. 2016, 72, 439–459. 10.1107/S2052520616007447. [DOI] [PMC free article] [PubMed] [Google Scholar]
- Clark S.; Segall M.; Pickard C.; Hasnip P.; Probert M.; Refson K.; Payne M. Z. Z. Kristallogr. - Cryst. Mater. 2005, 220, 567–570. 10.1524/zkri.220.5.567.65075. [DOI] [Google Scholar]
- Kresse G.; Hafner J. Phys. Rev. B: Condens. Matter Mater. Phys. 1993, 47, 558–561. 10.1103/PhysRevB.47.558. [DOI] [PubMed] [Google Scholar]
- Kresse G.; Hafner J. Phys. Rev. B: Condens. Matter Mater. Phys. 1994, 49, 14251–14269. 10.1103/PhysRevB.49.14251. [DOI] [PubMed] [Google Scholar]
- Kresse G.; Furthmüller J. Comput. Mater. Sci. 1996, 6, 15–50. 10.1016/0927-0256(96)00008-0. [DOI] [Google Scholar]
- Kresse G.; Furthmüller J. Phys. Rev. B: Condens. Matter Mater. Phys. 1996, 54, 11169–11186. 10.1103/PhysRevB.54.11169. [DOI] [PubMed] [Google Scholar]
- van de Streek J.; Neumann M. A. Acta Crystallogr., Sect. B: Struct. Sci. 2010, 66, 544–558. 10.1107/S0108768110031873. [DOI] [PMC free article] [PubMed] [Google Scholar]
- Perdew J. P.; Burke K.; Ernzerhof M. Phys. Rev. Lett. 1996, 77, 3865–3868. 10.1103/PhysRevLett.77.3865. [DOI] [PubMed] [Google Scholar]
- Grimme S.; Antony J.; Ehrlich S.; Krieg H. J. Chem. Phys. 2010, 132, 154104. 10.1063/1.3382344. [DOI] [PubMed] [Google Scholar]
- Grimme S.; Ehrlich S.; Goerigk L. J. Comput. Chem. 2011, 32, 1456–1465. 10.1002/jcc.21759. [DOI] [PubMed] [Google Scholar]
- Blöchl P. E. Phys. Rev. B: Condens. Matter Mater. Phys. 1994, 50, 17953–17979. 10.1103/PhysRevB.50.17953. [DOI] [PubMed] [Google Scholar]
- Kresse G.; Joubert D. Phys. Rev. B: Condens. Matter Mater. Phys. 1999, 59, 1758–1775. 10.1103/PhysRevB.59.1758. [DOI] [Google Scholar]
- Neumann M. A.; Perrin M.-A. J. Phys. Chem. B 2005, 109, 15531–15541. 10.1021/jp050121r. [DOI] [PubMed] [Google Scholar]
- Moellmann J.; Grimme S. J. Phys. Chem. C 2014, 118, 7615–7621. 10.1021/jp501237c. [DOI] [Google Scholar]
- Groom C. R.; Bruno I. J.; Lightfoot M. P.; Ward S. C. Acta Crystallogr., Sect. B: Struct. Sci., Cryst. Eng. Mater. 2016, 72, 171–179. 10.1107/S2052520616003954. [DOI] [PMC free article] [PubMed] [Google Scholar]
- Breneman C. M.; Wiberg K. B. J. Comput. Chem. 1990, 11, 361–373. 10.1002/jcc.540110311. [DOI] [Google Scholar]
- Frisch M. J.et al. Gaussian 09, Revision D.01; Gaussian Inc.: Wallingford, CT, 2016.
- Kitaigorodsky A.Molecular Crystals and Molecules; Physical Chemistry; Elsevier Science, 2012. [Google Scholar]
- Spek A. L. Acta Crystallogr., Sect. D: Biol. Crystallogr. 2009, 65, 148–155. 10.1107/S090744490804362X. [DOI] [PMC free article] [PubMed] [Google Scholar]
- Willock D. J.; Price S. L.; Leslie M.; Catlow C. R. A. J. Comput. Chem. 1995, 16, 628–647. 10.1002/jcc.540160511. [DOI] [Google Scholar]
- Horiuchi S.; Kobayashi K.; Kumai R.; Minami N.; Kagawa F.; Tokura Y. Nat. Commun. 2015, 6, 7469. 10.1038/ncomms8469. [DOI] [PMC free article] [PubMed] [Google Scholar]
- Raatikainen K.; Rissanen K. CrystEngComm 2011, 13, 6972–6977. 10.1039/c1ce05447c. [DOI] [Google Scholar]
- Fernandes M. A.; Levendis D. C. Acta Crystallogr., Sect. B: Struct. Sci. 2004, 60, 315–324. 10.1107/S0108768104007955. [DOI] [PubMed] [Google Scholar]
- Zhang S.-W.; Brunskill A. P. J.; Schwartz E.; Sun S. Cryst. Growth Des. 2017, 17, 2836–2843. 10.1021/acs.cgd.7b00308. [DOI] [Google Scholar]
- Taylor C. R.; Bygrave P. J.; Hart J. N.; Allan N. L.; Manby F. R. Phys. Chem. Chem. Phys. 2012, 14, 7739–7743. 10.1039/c2cp24090d. [DOI] [PubMed] [Google Scholar]
- Gavezzotti A. Crystallogr. Rev. 1998, 7, 5–121. 10.1080/08893119808035402. [DOI] [Google Scholar]
Associated Data
This section collects any data citations, data availability statements, or supplementary materials included in this article.


