Abstract
Analysis of patient genomes and transcriptomes routinely recognizes new gene sets associated with human disease. Here we present an integrative natural language processing system which infers common functions for a gene set through automatic mining of the scientific literature with biological networks. This system links genes with associated literature phrases and combines these links with protein interactions in a single heterogeneous network. Multiscale functional annotations are inferred based on network distances between phrases and genes and then visualized as an ontology of biological concepts. To evaluate this system, we predict functions for gene sets representing known pathways and find that our approach achieves substantial improvement over the conventional text-mining baseline method. Moreover, our system discovers novel annotations for gene sets or pathways without previously known functions. Two case studies demonstrate how the system is used in discovery of new cancer-related pathways with ontological annotations.
Keywords: text mining, functional annotations, knowledge network, gene interactions
1. Introduction
With significant advances in ‘omics technologies, it has become increasingly routine to identify functionally related sets of genes based on different biological patterns. For example, a gene set may be computationally derived based on differential expression1,2, based on associations to the same phenotypes3,4, or based on a high density of molecular interactions among the genes5–8. Because of their functional relationships, these gene sets can often be interpreted as cellular pathways or protein complexes, enabling a systems approach to studying human diseases beyond individual genes2–5.
Given a gene set of interest, a critical task is to learn what is its overall function as a pathway or complex in the cell. There are two major approaches to address this task. The first approach is to search for significant overlap with known pathways in manually curated databases such as the Gene Ontology (GO)9 and the Kyoto Encyclopedia of Genes and Genomes (KEGG)10. However, it is very likely that little or no overlap can be found due to the limited coverage of these databases, especially when querying with gene sets related to a rare disease.
The second approach is to search for scientific articles that describe each gene in the set, and then summarize these articles to describe the aggregate function of the gene set. Manually performing this process requires substantial domain knowledge and does not scale to large pathways. While automatic summarization of free text has been proposed by many text-mining methods11–12, these methods can describe only one gene rather than a gene set. In particular, automatic summarization for a gene set requires addressing several new challenges. First, the increased number of free text articles introduces diverse and noisy annotations compared to individual genes. Second, the relationship between pathway functions and gene interactions should be considered, since genes can perform very different functions when participating in different biological processes. Third, literature contains many potential and diverse function annotations, only some of which are relevant. Thus researchers need systematic approaches to filter, organize and display the most useful information in literature to better understand the biological pathways represented by a gene set. Many related approaches mine literature data to study the functions of a group of genes together. CoCiter tests the significance of co-citation of a gene set either from a user-defined queried gene sets or a known pathway13. Since the functions of this gene set are provided by user, CoCiter is not able to automatically mine new functional annotations to describe the gene set. Martini is a gene set comparison tool which assesses the similarity of two gene sets by using keywords extracted from Medline abstracts14. Although gene sets are compared using keywords, the functional description for each gene set is not explicitly generated.
Here we develop a novel approach to automatically mine functional annotations of pathways from a large corpus of literature supported by biological networks. Our approach has two major advantages over previous text mining methods. First, it integrates semantic information derived from literature with biological information derived from experimental and interactome data. In this framework, annotations and genes are linked through a comprehensive similarity network. By propagating information in the network, an annotation can be assigned to a gene even when the two were never mentioned together in the same literature. Second, we adopt a new way to organize and visualize functional annotations using a data structure called a “Hierarchical Concept Ontology”. This ontology reduces redundant information and visual complexity to display the complex structure embedded in the network. We evaluate our method on both manually-curated pathway annotations and gene sets derived from computational tools. We observe substantial improvement in predicting the manually curated annotations in comparison to a text-mining baseline (non-network) approach. We further explore two case studies to demonstrate how our method can combine text mining, molecular networks and advanced visualization to discover new pathways related to cancer.
2. Methods
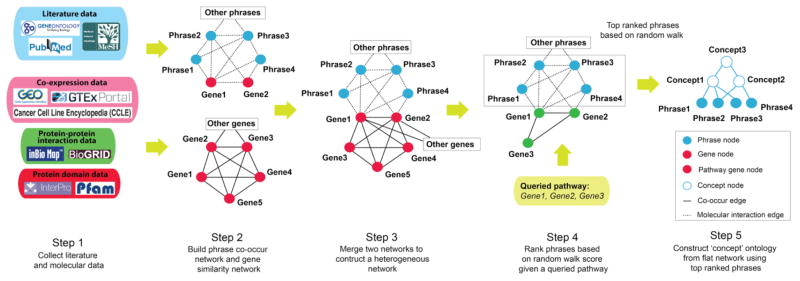
Our method consists of four major steps (Fig. 1). First, it constructs a vocabulary of high quality phrases (a sequence of one or more words) by processing a large corpus of PubMed journal articles15 using a software AutoPhrase16. Second, phrases are connected within a weighted network based on their probability of co-occurrence within the same articles. Third, our method builds a phrase-gene similarity network by joining the phrase-phrase network with an existing gene-gene network derived from experimental data. Fourth, phrases are ranked by how well they describe the function of a gene set. Finally, top-ranked phrases are projected into a low-dimensional space and hierarchically clustered to create a Concept Ontology.
Figure 1.
Diagram of our method
2.1 Constructing a phrase-gene network
We construct a weighted network to quantify the functional similarities between both phrases and genes. The edge weight wAB between phrase A and phrase B is defined as:
| (1) |
where Pr(A) is the marginal probability that phrase A appears in any article and Pr(A, B) is the probability that phrase A and phrase B co-occur in the same article. Intuitively, two phrases receive a large edge weight if they co-occur together more often than expected given their individual probabilities. In practice, non-informative phrases such as ‘cell lines’ and ‘system biology’ have many network neighbors with low edge weights; thus we retain only the top 50 edges for each phrase. To calculate the edge weight between two genes, we integrate multiple heterogeneous data sources, including gene co-expression, protein-protein interaction, protein-domain co-occurrence and genetic interaction (see section 3.1). We perform this integration in an unsupervised fashion using a network-fusion-based algorithmic framework17. To calculate the edge weight between a phrase and a gene, the name of the gene is considered as a phrase and the weight is then calculated by Eqn. 1. In this way, the phrase-phrase and gene-gene networks are joined into a single network consisting of both phrases and genes as nodes.
2.2 Ranking candidate annotations of a pathway
Based on connections in this initial phrase-gene network, we further identify non-obvious links between phrases and genes through a random walk transformation of the network. An association score between gene A and phrase B is defined as the probability of randomly walking from A to B in the network, with restart probability = 0.5. Similarly, the association score between a queried gene set (pathway) and a phrase is defined as the average association score between the phrase and all genes in the set. We then rank pathways based on these scores. To efficiently rank a large number of phrases in a reasonable time, we only consider phrases that are within a distance of <3 to any of the genes in a queried pathway. Use of this filter in practice did not result in any significant decrease in performance (as evaluated below). Finally, we select all phrases with scores above a threshold as the candidate annotations of the queried pathway. We will discuss how to empirically pick this threshold in the below ‘Experimental results’ section.
2.3 Visualizing results as a Concept Ontology
The number of candidate annotations returned by the previous step can be very large, especially for large pathways. In general, synonyms are connected by the strongest weights because they are exchangeable in the literature. Phrases related to the same topic such as ‘tumor suppressor’ and ‘driver mutations’ will also be assigned strong weights but weaker than synonyms. Such intuition encouraged us to organize the flat phrase networks into a data-driven hierarchical ‘concept’ ontology18–19. For this purpose we adopt a network embedding approach17 in which phrases are projected into a low-dimensional space and the cosine of two phrase embedding vectors is used as their pairwise distance. Given this new distance matrix, we then apply a network clustering approach, CLiXO18, to transform the flat phrase network into a data-driven ‘concept’ ontology, where leaf nodes are phrases and internal nodes are clusters of similar phrases suggestive of higher order ‘concepts’. Low-level concepts tend to be relatively concrete, because all phrases are strongly connected with each other, while high-level concepts tend to be more abstract, because phrases are more loosely connected with each other. Similar to a manually curated ontology, we assign each concept a name using a representative phrase having minimum distance with all the other phrases in the same concept cluster. Cytoscape20 is then applied to visualize the data-driven Concept Ontology.
3. Experimental results
3.1 Dataset and experimental settings
We obtained 33,462,308 journal articles from PubMed published between 1994 to 2017. For each article, we only used the abstract and title rather than the whole article. We obtained 41,367 gene descriptions and gene name synonyms from NCBI15. The lengths of descriptions ranged from 100 to 300 words. AutoPhrase16 then identified 727,289 phrases from the text corpus combining both gene descriptions and journal articles.
To calculate gene similarities, we aggregated various types of molecular networks using a Random Forest (RF) model trained to best recover the GO semantic distance between gene pairs. The trained model can be viewed as a nonlinear weighting of different kinds of features to reflect statistical pairwise correlations between two genes. The integrated data sources include coexpression networks, protein-protein interaction networks and protein-domain co-occurrences and genetics interactions, as follows. For co-expression networks, we used 980 genome-wide datasets extracted from the Gene Expression Omnibus (GEO) database21. We also used co-expression networks from the Genotype-Tissue Expression (GTEx)22 project in which both global and tissue-specific co-expression are considered. In addition, we calculated a co-expression matrix on both the Human Protein Atlas and the Cancer Cell Line Encyclopedia23,24. For protein-protein interaction networks, we included all interactions in InBioMap25 and only physical interactions in BioGRID26. In addition, we included genetic interaction data inferred from radiation hybrid genotypes27 and domain co-occurrence data from InterPro28 and PFAM29.
3.2 Performance
3.2.1 Recovering curated names in GO
We examined the ability of our method to recover the names of known biological processes and cellular components in GO, given only information about their sets of annotated genes. For each GO term, we looked for its curated name among all candidate phrases ranked according to their association scores to the genes in the term (Section 2.2). Gene-term annotations were taken using experimental evidence codes (EXP, IDA, IPI, IMP, IGI, and IEP) but not in silico codes (e.g. IEA) to avoid potential leakage of labels.
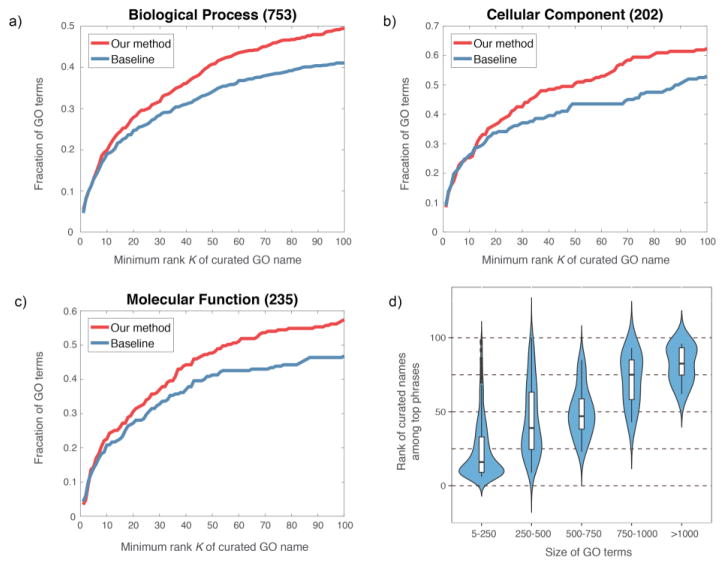
We found that for 40% of terms in the biological process branch of GO, the curated name was among the top 50 candidates (Fig. 2a). Similarly, for 50% of terms in the cellular component branch, the curated name was among the top 50 candidates (Fig. 2b). More generally, we calculated the proportion of GO terms for which the curated name was among the top K candidate names of the term. For comparison, we set up a baseline approach in which a phrase is scored and ranked simply by the number of articles that mention this phrase together with any of the genes in the gene set. This simple but intuitive baseline mimics a search engine that ranks documents based on word frequency30. Our method substantially outperformed this baseline approach in naming terms across all three branches of GO (Fig. 2a–c). Here, for each term we only considered the curated name itself and did not reward returning the names of ancestors or descendants. In practice, however, we also observed the names of ancestors and descendants among the top ranked phrases (Fig. S1–3).
Figure 2.
Comparison of our method and baseline on recovering term names of three Gene Ontology categories: Biological Process (a), Cellular Component (b) and Molecular Function (c). The fraction of terms for which the curated name was among the top K candidate phrases. (d) The correspondence between the rank of term names and the sizes of terms. The Y-axis shows the distribution of ranks of curated names with varying sparsity levels shown in the X-axis.
Further examining these results, we observed that the rank of the curated name identified by our method was positively correlated with the size of the gene set (Fig. 2d). That is, our method predicted more accurately when the gene set was small. For sets with fewer than 250 genes, our method found the correct curated term among the top 10 phrases the majority of the time. When the gene set was larger than 750 genes, our method could only detect the curated name among the top ~75 phrases. An explanation for this result is that large gene sets tend to cover broad or diverse functions and thus are more difficult to summarize by a short phrase.
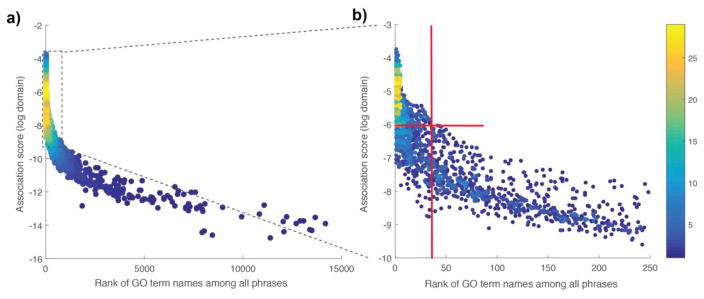
Next, we studied another critical problem: Given a ranking of phrases, how do we determine the threshold to select the most relevant phrases? To address this problem, for each GO term, we compared the ranking of its curated name with its association score. As shown in Figs. 3a–b, better rankings of curated names were generally tied to stronger association scores. This implies that the association scores across different GO terms are comparable. Therefore, we applied a universal threshold on the association score to determine final annotations for every GO term. We found that when the score is larger than −6 (log domain), we could always find the curated name among top 40 ranked phrases, regardless of term size (Fig. 3b). Therefore, we used −6 as our universal threshold to determine annotations.
Figure 3.
Selecting relevant phrases based on the association score. (a) For each GO term, the association score of its curated name is plotted with the rank of this score among all candidate phrases. (b) Zoom-in of panel (a) reveals that applying a threshold of ≥ −6 on the association score guarantees that the curated name of a term is ranked among the top 40 candidate phrases.
3.2 Functional annotations for unknown cancer pathways
Encouraged by the ability of our method to recover the curated names of known pathways, we set out to assign names to new gene sets inferred from molecular data. We analyzed a total of 2,132 gene sets detected by the hierarchical clustering algorithm CLiXO18 based on a human gene similarity network with 19,035 genes and 181,156,095 edges (Section 3.1). Of these, we only considered those that did not significantly overlap with known pathways. In this section, we chose two example gene sets which were suggested to be highly related to cancer by our approach to demonstrate how our method can help to discover new biological knowledge.
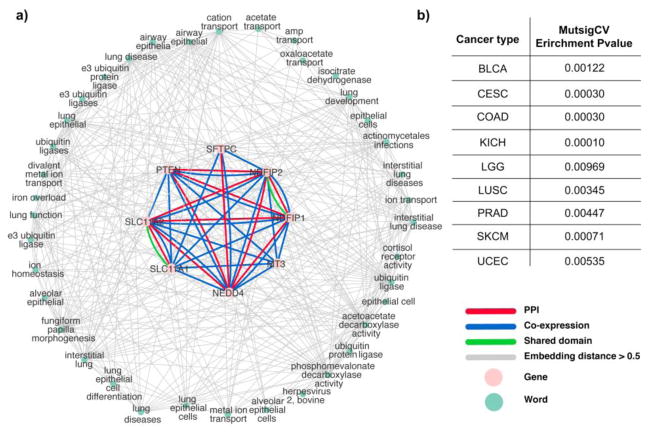
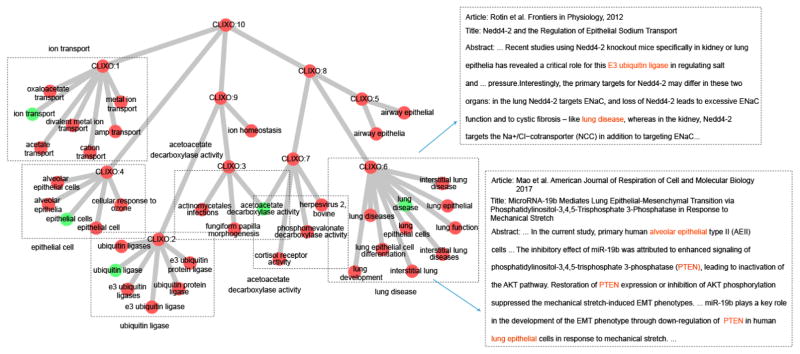
As a first case study, we examined a pathway consisting of eight strongly interacting genes: NEDD4, PTEN, SLC11A2, SLC11A1, SFTPC, MT3, NDFIP1 and NDFIP2 (Fig. 4a). To our knowledge, this pathway was previously unknown, as it has poor overlap with all catalogued pathways in GO and KEGG (Jaccard Index ≤ 0.25). Our method identified 38 literature phrases associated with this set of genes (Fig. 4a). Although each of these phrases might represent a distinct biological function, we found that some were highly related to one another, forming a hairball-like subnetwork of gene-phrase linkages (Fig. 4a). Thus, it would be very challenging for a human to summarize the overall functions of this pathway. To address this challenge, we applied CLiXO to hierarchically organize these phrases into a Concept Ontology. Visualization of this ontology revealed six major functions at multiple scales (Fig. 5). On a molecular level, this pathway has functions related to ‘ion transport’, ‘acetoacetate decarboxylase activity’ and ‘ubiquitin ligase’. On a cellular and organismal level, it is involved in ‘epithelial cells’ and ‘lung disease’. These descriptions were supported by direct associations between phrases and genes in multiple articles, such as ‘lung disease’ and NEDD4 in Rotin et al.29,31 and ‘lung epithelial cell’ and PTEN in Mao et al.32, and by indirect associations learned through the random walk transformation. As validation of these descriptions, we found that genes in this pathway were recurrently mutated in lung squamous cell carcinoma (LUSC), a disease in epithelial cells33, based on MutSigCV scores34 in The Cancer Genome Atlas (TCGA)35. All evidence suggested that this is a novel functional pathway related to lung cancer.
Figure 4.
Discovery and characterization of a new pathway by our method. (a) The pathway is defined by eight genes related by protein interactions, co-expression and protein shared domains. These functions of these genes are collectively described by 38 phrases. (b) Cancer types in which these genes are significant mutated in The Cancer Genome Atlas (TCGA).
Figure 5.
Summarization of biological function by a Concept Ontology. The 38 phrases describing the pathway in Fig. 4 were hierarchically clustered based on their semantic relations using the CLiXO algorithm. These phrases were organized into six major concepts. We list two of the journal articles, Mao et al.32 and Rotin et al.29,31, contributing to the concepts ‘lung disease’ and ‘epithelial cell’.
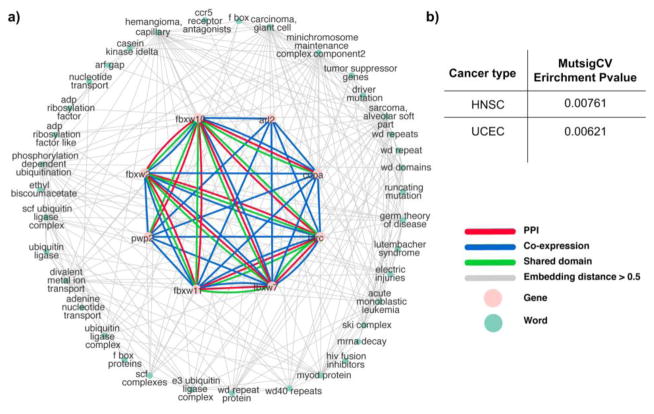
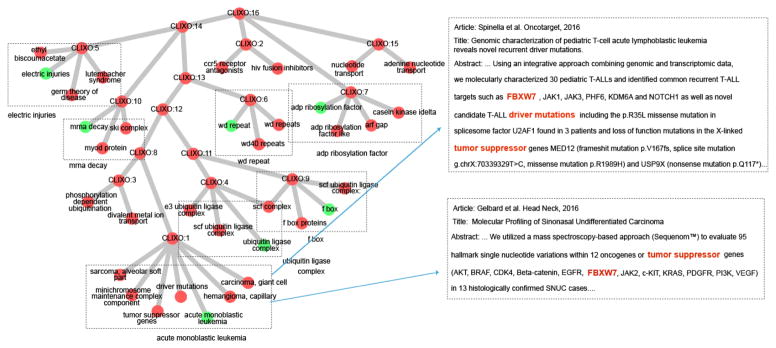
As a second case study, we examined another pathway, consisting of eight genes FBXW7, ARL2, FBXW11, FBXW2, BTRC, PWP2, COPA and FBXW10. These genes strongly interacted with each other primarily through domain co-occurrence, suggesting their proteins share similar 3D structures (Fig. 6a). This pathway was also previously unknown (Jaccard Index ≤ 0.1 in GO and KEGG). Our method described its functions with 37 phrases, which could be hierarchically organized into six major concepts (Fig. 7). An interesting concept was ‘acute monoblastic leukemia’, suggesting this pathway was cancer-associated. As shown in Fig. 7, validation for this pathway was achieved by tracing back the actual literature referencing these genes and diseases simultaneously. One of the articles, Gelbard et al.36, related FBXW7 to sinonasal carcinoma, a kind of head and neck cancer. This is consistent with our finding that these genes were recurrently mutated in the HNSC and UCEC patient cohorts in TCGA (Fig. 6b). These two examples demonstrate how pathways can be automatically discovered and annotated by integrating years of biomedical knowledge with ‘omics datasets.
Figure 6.
Discovery and characterization of another new pathway by our method. (a) The pathway is defined by eight genes related by protein interactions, co-expression, and protein shared domains. The functions of these genes are collectively described by 37 phrases set out around the periphery. (b) Cancer types in which these genes are recurrently mutated in TCGA.
Figure 7.
Summarization of biological function by a Concept Ontology. The 37 phrases describing the pathway in Fig. 6 were hierarchically clustered based on their semantic relations, using the CLiXO algorithm. These phrases were organized into six major concepts. We list two of the journal articles, Spinella et al.37 and Gelbard et al.36, from which the concept ‘acute monoblastic leukemia’ was inferred.
4. Conclusion
In this work, we have developed a novel text mining and visualization tool for automated pathway functional annotation. Our main idea is to integrate literature and molecular interaction information into a large heterogenous network and then use a random walk-based approach to rank candidate pathway descriptions. In the final step, we use a Concept Ontology to visualize annotations as a more informative alternative to a flat network of biomedical phrases. In this work our primary focus is to annotate gene set, however, our framework can be well generalized to other applications. For instance, if the user provides a set of drugs, targets and their corresponding interaction networks, our method should be able to return the potential downstream and upstream pathways where these drugs might influence. Another application is that we can replace gene set with a group of disease symptoms and replace molecular network with symptom similarity network. Then our method might help to define the potential pathways and genes that lead to such symptoms.
One of the major limitations of our work is currently we can not accept users’ input to specify a particular context. For example, the user might want to know the roles of these genes in brain or the user only want to know the location information. Theoretically speaking, these information is all included in our result, however, they might not rank high enough to pass our filter. There are many interesting directions to explore in the future. To name a few, we plan to automatically generate sentences instead of phrases for new pathways. Sentences are more widely accepted and carry more information than phrases. Another direction is to improve our algorithm to move beyond the abstract and title to scanning complete articles and even figures. A more challenging direction is to link functional descriptions more deeply with molecular data. In our current method, the types of interactions among genes do not influence the final functional annotations. However, in practice, a rich protein-protein interactions and genetic interactions usually suggest a protein complex.
Footnotes
Supplementary Data: http://swang141.web.engr.illinois.edu/PSB/NetAnt_PSB2018_suppl.pdf
References
- 1.Ideker T, Ozier O, Schwikowski B, Siegel AF. Bioinformatics. 2002;18(Suppl 1):S233–40. doi: 10.1093/bioinformatics/18.suppl_1.s233. [DOI] [PubMed] [Google Scholar]
- 2.Ideker T, Krogan NJ. Mol Syst Biol. 2012;8:565. doi: 10.1038/msb.2011.99. [DOI] [PMC free article] [PubMed] [Google Scholar]
- 3.Califano A, Butte AJ, Friend S, Ideker T, Schadt E. Nat Genet. 2012;44:841–847. doi: 10.1038/ng.2355. [DOI] [PMC free article] [PubMed] [Google Scholar]
- 4.Visscher PM, Brown MA, McCarthy MI, Yang J. Am J Hum Genet. 2012;90:7–24. doi: 10.1016/j.ajhg.2011.11.029. [DOI] [PMC free article] [PubMed] [Google Scholar]
- 5.Nepusz T, Yu H, Paccanaro A. Nat Methods. 2012;9:471–472. doi: 10.1038/nmeth.1938. [DOI] [PMC free article] [PubMed] [Google Scholar]
- 6.Leiserson MDM, et al. Nat Genet. 2015;47:106–114. doi: 10.1038/ng.3168. [DOI] [PMC free article] [PubMed] [Google Scholar]
- 7.Hofree M, Shen JP, Carter H, Gross A, Ideker T. Nat Methods. 2013;10:1108–1115. doi: 10.1038/nmeth.2651. [DOI] [PMC free article] [PubMed] [Google Scholar]
- 8.Mostafavi S, Ray D, Warde-Farley D, Grouios C, Morris Q. Genome Biol. 2008;9(Suppl 1):S4. doi: 10.1186/gb-2008-9-s1-s4. [DOI] [PMC free article] [PubMed] [Google Scholar]
- 9.Ashburner M, et al. Nat Genet. 2000;25:25–29. doi: 10.1038/75556. [DOI] [PMC free article] [PubMed] [Google Scholar]
- 10.Kanehisa M. Nucleic Acids Res. 2000;28:27–30. doi: 10.1093/nar/28.1.27. [DOI] [PMC free article] [PubMed] [Google Scholar]
- 11.Jin F, Huang M, Lu Z, Zhu X. BioNLP ‘09. 2009 doi: 10.3115/1572364.1572377. [DOI] [Google Scholar]
- 12.Ling X, et al. Inf Process Manag. 2007;43:1777–1791. [Google Scholar]
- 13.Qiao N, Huang Y, Naveed H, Green CD, Han J-DJ. PLoS One. 2013;8:e74074. doi: 10.1371/journal.pone.0074074. [DOI] [PMC free article] [PubMed] [Google Scholar]
- 14.Soldatos TG, et al. Nucleic Acids Res. 2010;38:26–38. doi: 10.1093/nar/gkp876. [DOI] [PMC free article] [PubMed] [Google Scholar]
- 15.NCBI Resource Coordinators. Nucleic Acids Res. 2017;45:D12–D17. doi: 10.1093/nar/gkw1071. [DOI] [PMC free article] [PubMed] [Google Scholar]
- 16.Liu J, Shang J, Han J. Morgan & Claypool Publishers; 2017. [Google Scholar]
- 17.Cho H, Berger B, Peng J. Cell Syst. 2016;3:540–548. e5. doi: 10.1016/j.cels.2016.10.017. [DOI] [PMC free article] [PubMed] [Google Scholar]
- 18.Kramer M, Dutkowski J, Yu M, Bafna V, Ideker T. Bioinformatics. 2014;30:i34–42. doi: 10.1093/bioinformatics/btu282. [DOI] [PMC free article] [PubMed] [Google Scholar]
- 19.Dutkowski J, et al. Nat Biotechnol. 2013;31:38–45. doi: 10.1038/nbt.2463. [DOI] [PMC free article] [PubMed] [Google Scholar]
- 20.Shannon P, et al. Genome Res. 2003;13:2498–2504. doi: 10.1101/gr.1239303. [DOI] [PMC free article] [PubMed] [Google Scholar]
- 21.Edgar R. Nucleic Acids Res. 2002;30:207–210. doi: 10.1093/nar/30.1.207. [DOI] [PMC free article] [PubMed] [Google Scholar]
- 22.GTEx Consortium. Science. 2015;348:648–660. doi: 10.1126/science.1262110. [DOI] [PMC free article] [PubMed] [Google Scholar]
- 23.Uhlen M, et al. Nat Biotechnol. 2010;28:1248–1250. doi: 10.1038/nbt1210-1248. [DOI] [PubMed] [Google Scholar]
- 24.Barretina J, et al. Nature. 2012;483:603–607. doi: 10.1038/nature11003. [DOI] [PMC free article] [PubMed] [Google Scholar]
- 25.Li T, et al. Nat Methods. 2017;14:61–64. doi: 10.1038/nmeth.4083. [DOI] [PMC free article] [PubMed] [Google Scholar]
- 26.Stark C. Nucleic Acids Res. 2006;34:D535–D539. doi: 10.1093/nar/gkj109. [DOI] [PMC free article] [PubMed] [Google Scholar]
- 27.Lin A, Wang RT, Ahn S, Park CC, Smith DJ. Genome Res. 2010;20:1122–1132. doi: 10.1101/gr.104216.109. [DOI] [PMC free article] [PubMed] [Google Scholar]
- 28.Finn RD, et al. Nucleic Acids Res. 2017;45:D190–D199. doi: 10.1093/nar/gkw1107. [DOI] [PMC free article] [PubMed] [Google Scholar]
- 29.Finn RD. Encyclopedia of Genetics, Genomics, Proteomics and Bioinformatics. 2005 [Google Scholar]
- 30.Zhai C, Lafferty J. SIGIR ‘01. 2001 doi: 10.1145/383952.384019. [DOI] [Google Scholar]
- 31.Rotin D, Staub O. Front Physiol. 2012;3:212. doi: 10.3389/fphys.2012.00212. [DOI] [PMC free article] [PubMed] [Google Scholar]
- 32.Mao P, et al. Am J Respir Cell Mol Biol. 2017;56:11–19. doi: 10.1165/rcmb.2015-0377OC. [DOI] [PubMed] [Google Scholar]
- 33.Sutherland KD, Berns A. Mol Oncol. 2010;4:397–403. doi: 10.1016/j.molonc.2010.05.002. [DOI] [PMC free article] [PubMed] [Google Scholar]
- 34.Lawrence MS, et al. Nature. 2013;499:214–218. doi: 10.1038/nature12213. [DOI] [PMC free article] [PubMed] [Google Scholar]
- 35.Cancer Genome Atlas Research Network et al. Nat Genet. 2013;45:1113–1120. doi: 10.1038/ng.2764. [DOI] [PMC free article] [PubMed] [Google Scholar]
- 36.Gelbard A, et al. Head Neck. 2014;36:15–21. doi: 10.1002/hed.23267. [DOI] [PMC free article] [PubMed] [Google Scholar]
- 37.Spinella JF, et al. Oncotarget. 2016;7:65485–65503. doi: 10.18632/oncotarget.11796. [DOI] [PMC free article] [PubMed] [Google Scholar]


