Quantification of protein dimerization energies in lipid bilayers is hard to achieve, largely due to methodological challenges. Chadda et al. present an expansion of the single-molecule subunit-capture approach that incorporates empirical benchmarks for monomers and dimers, simplifying the process.
Abstract
The thermodynamic reasons why membrane proteins form stable complexes inside the hydrophobic lipid bilayer remain poorly understood. This is largely because of a lack of membrane–protein systems amenable for equilibrium studies and a limited number of methods for measuring these reactions. Recently, we reported the equilibrium dimerization of the CLC-ec1 Cl−/H+ transporter in lipid bilayers (Chadda et al. 2016. eLife. https://doi.org/10.7554/eLife.17438), which provided a new type of model system for studying protein association in membranes. The measurement was conducted using the subunit-capture approach, involving passive dilution of the protein in large multilamellar vesicles, followed by single-molecule photobleaching analysis of the Poisson distribution describing protein encapsulation into extruded liposomes. To estimate the fraction of dimers (FDimer) as a function of protein density, the photobleaching distributions for the nonreactive, ideal monomer and dimer species must be known so that random co-capture probabilities can be accounted for. Previously, this was done by simulating the Poisson process of protein reconstitution into a known size distribution of liposomes composed of Escherichia coli polar lipids (EPLs). In the present study, we investigate the dependency of FDimer and ΔG° on the modeling through a comparison of different liposome size distributions (EPL versus 2:1 POPE/POPG). The results show that the estimated FDimer values are comparable, except at higher densities when liposomes become saturated with protein. We then develop empirical controls to directly measure the photobleaching distributions of the nonreactive monomer (CLC-ec1 I201W/I422W) and ideal dimer (WT CLC-ec1 cross-linked by glutaraldehyde or CLC-ec1 R230C/L249C cross-linked by a disulfide bond). The measured equilibrium constants do not depend on the correction method used, indicating the robustness of the subunit-capture approach. This strategy therefore presents a model-free way to quantify protein dimerization in lipid bilayers, offering a simplified strategy in the ongoing effort to characterize equilibrium membrane–protein reactions in membranes.
Introduction
Passive dilution is a straightforward method for measuring protein self-assembly reactions. For water-soluble proteins, this is an easy experiment to carry out because one simply dilutes the sample with buffer to drive the reaction toward dissociation. For membrane proteins, the exact same experiment becomes inherently challenging, because the protein is now solvated in a two-dimensional lipid bilayer. Methods for rapidly diluting membranes do not exist because lipids or vesicles added to the bulk do not spontaneously incorporate into preformed lipid bilayers. Adding to the challenge, membranes occupy a small fraction of the sample volume, and so the protein signal is considerably lower, limiting the use of bulk detection methods. Therefore, special considerations must be made in order to overcome these hurdles to study membrane–protein reactions in membranes by passive dilution approaches.
To address these issues, we developed a single-molecule approach that uses fluorescence microscopy to examine the equilibrium protein population in large membranes (Chadda et al., 2016; Chadda and Robertson, 2016). In this method, referred to as the subunit-capture approach, the protein is incubated in large multilamellar vesicles (MLVs), which are then fractionated by extrusion forming a population of smaller vesicles. Each liposome traps zero, one, two, or more of the fluorescently labeled subunits based on their prior proximity in the membrane, and this occupancy is counted by single-molecule photobleaching analysis. The probability distribution of photobleaching steps is calculated from hundreds of vesicles, representing a fluorescent version of the Poisson distribution of protein reconstitution. This distribution depends on the protein density in the membrane, the size of the liposome compartments, and the population of oligomeric states that existed in the MLV membranes, with the latter containing information about the equilibrium constant of protein association. Recently, this method was used to measure the equilibrium dimerization reaction of the CLC-ec1 Cl−/H+ antiporter for the WT protein, as well as the destabilization caused by addition of a tryptophan at the dimerization interface (I422W, “W”; Chadda et al., 2016).
The subunit-capture approach of trapping protein into liposomes has several advantages beyond studying the protein in planar bilayers. First, the act of liposome formation captures the equilibrium distribution in the MLV membrane, analogous to a rapid, irreversible cross-linking event. Although it is possible that the oligomeric state of the protein could change after capture, this does not affect the measured photobleaching distribution. Therefore, this method allows us to freeze the state of the protein in time, separating it from the actual imaging step, and making it significantly easier to examine membranes under different experimental conditions. Second, the liposomes used in these studies can be loaded onto the slide at high density without rupture, increasing the likelihood of observing a protein at the lowest density limit. This enables a wide dynamic range of densities (from 10−9 to 10−5 subunits/lipid) that can be studied using this approach. Finally, examination of the protein by photobleaching analysis provides a rigorous method of counting all protein subunits. This serves as an important quality control step that also informs on potential aggregation, observed as an increase in liposomes with more than three steps, which can easily confound equilibrium membrane–protein reactions.
However, the subunit-capture approach is not without its own challenges. First and foremost, it requires a priori information about the capture process in order to properly quantify the protein population. Although it is straightforward to measure protein stoichiometry at low dilutions where the majority of liposomes are unoccupied (Fang et al., 2007; Walden et al., 2007; Robertson et al., 2010; Stockbridge et al., 2013), at higher densities, there is a significant probability of random co-capture of subunits. Following the Poisson distribution, an increase in density leads to an increase in multioccupied liposomes by chance alone, reporting a false signal of oligomerization. This has previously been referred to as “artifactual togetherness” or “forced cohabitation” and has been shown to occur for membrane proteins in detergent micelles (Tanford and Reynolds, 1976; Kobus and Fleming, 2005). One way of correcting this is to simulate the Poisson process of fluorescent-subunit capture into liposomes to generate the expected photobleaching distributions for nonreactive monomer and dimer populations (Chadda et al., 2016). As long as the fluorescent labeling yield is known, this is straightforward to simulate, but it requires knowledge about the liposome size distribution. Because liposome populations are often heterogenous (Walden et al., 2007), this must be measured experimentally by a high-resolution method such as cryo-electron microscopy (cryo-EM). This adds a technically challenging step to the approach, which must be conducted every time a new experimental condition is investigated, such as temperature or lipid composition. It is also not clear whether a single measurement of the liposome distribution is sufficiently precise to allow for a robust determination of the equilibrium constant. To address these issues, the dependency of the equilibrium constant on variations in the liposome size distributions is investigated, comparing the previous liposome distribution comprised of Escherichia coli polar lipids (EPLs; Walden et al., 2007) to a new distribution measured from 2:1 POPE/POPG liposomes. In addition, empirical, nonreactive monomer and dimer controls are developed based on the CLC-ec1 scaffold, presenting a model-free option for quantifying membrane–protein dimerization. Analysis of CLC-ec1 association using either correction method yields comparable values for the free energy of dimerization, demonstrating the robustness of the subunit-capture approach for quantifying equilibrium protein association in membranes.
Materials and methods
The bulk of the methods used in this study follow those reported in Chadda et al. (2016). Details of experiments specific to this study are outlined here.
Equilibrium dimerization in membranes
Equilibrium protein dimerization provides a simple model for studying the thermodynamics of protein self-assembly in membranes. In this reaction, two monomers (M) bind resulting in a dimer (D) complex in the membrane:
| (1) |
with an equilibrium constant of the reaction defined as
| (2) |
As the proteins are primarily solvated by lipids, the protein density is represented as the reactive mole fraction, χ*, of each protein species (M or D):
| (3) |
Reconstitution of CLC-ec1 by dialysis leads to randomly oriented protein in the lipid bilayer (Matulef and Maduke, 2005; Garcia-Celma et al., 2013). Here, we assume that dimerization only occurs between oriented subunits and hence use the reactive mole fraction, χ* subunits/lipid, which is equivalent to the reconstituted mole fraction χ subunits/lipid divided by 2. Note, that the mole fraction simplifies to the mole ratio at dilute conditions (Nsolvent >> Nprotein).
The equilibrium constant of the reaction is simply obtained by diluting the protein with solvent and measuring the fraction of protein in the dimer state (FDimer). For an equilibrium reaction, this will follow the dimerization isotherm:
| (4) |
Thus, plotting FDimer versus χ* yields Keq and the underlying free energy of dimerization, ΔG° = −RTln(Keqχ°), where χ° = 1 subunit/lipid represents the mole fraction standard state.
The lower-density limit in MLVs
A vesicle with a diameter of 10 µm has a surface area of 4πr2 ∼ 300 µm2 = 3 × 10⁸ nm2. Using Alipid = 0.6 nm2, this means that each leaflet contains 5 × 10⁸ lipids, with the entire bilayer containing 10−9 lipids. Therefore, the lower mole fraction limit is >2 subunits/109 lipids, χ = 2 × 10⁻⁹ subunits/lipid (χ* = 10−9 subunits/lipid).
Cryo-EM measurements of liposome size distributions
Liposomes were freeze-thawed seven times, incubated at room temperature, and then extruded through a 400-nm nucleopore filter (GE Life Sciences) 21 times before sample freezing. 3 µl of the undiluted sample was loaded onto glow-discharged Lacey carbon support films (Electron Microscope Sciences), blotted, and plunged into liquid ethane using a Vitrobot System (FEI). Images were collected at 300 kV on a JEOL 3200 fs microscope with a K2 Summit direct electron detector camera (GATAN). Magnifications of 15,000 and 30,000 were used. For size determination, liposomes were manually outlined in Fiji and ImageJ (Schindelin et al., 2012; Schneider et al., 2012) to measure the outer radii of all liposomes, including those located on the carbon. The normalized frequency histograms were averaged from two independent preparations (samples sizes, 140 and 686), and the mean ± SD is reported in Table 1.
Table 1. Radius and fractional surface area distribution of 400-nm 2:1 POPE/POPG liposomes.
| Bin range | Pradii | SD | FSA | SD |
|---|---|---|---|---|
| nm | ||||
| 5–10 | 0.000 | 0.000 | 0.000 | 0.000 |
| 10–15 | 0.014 | 0.020 | 0.002 | 0.000 |
| 15–20 | 0.071 | 0.061 | 0.005 | 0.002 |
| 20–25 | 0.163 | 0.109 | 0.051 | 0.065 |
| 25–30 | 0.179 | 0.142 | 0.091 | 0.120 |
| 30–35 | 0.151 | 0.102 | 0.106 | 0.136 |
| 35–40 | 0.076 | 0.037 | 0.067 | 0.083 |
| 40–45 | 0.042 | 0.009 | 0.043 | 0.049 |
| 45–50 | 0.046 | 0.016 | 0.043 | 0.040 |
| 50–55 | 0.027 | 0.012 | 0.030 | 0.025 |
| 55–60 | 0.025 | 0.025 | 0.020 | 0.003 |
| 60–65 | 0.007 | 0.000 | 0.015 | 0.016 |
| 65–70 | 0.005 | 0.003 | 0.008 | 0.006 |
| 70–75 | 0.011 | 0.015 | 0.007 | 0.010 |
| 75–80 | 0.011 | 0.014 | 0.012 | 0.006 |
| 80–85 | 0.014 | 0.020 | 0.012 | 0.017 |
| 85–90 | 0.008 | 0.009 | 0.012 | 0.002 |
| 90–95 | 0.007 | 0.010 | 0.008 | 0.011 |
| 95–100 | 0.000 | 0.000 | 0.000 | 0.000 |
| 100–105 | 0.007 | 0.010 | 0.010 | 0.014 |
| 105–110 | 0.011 | 0.014 | 0.024 | 0.011 |
| 110–115 | 0.004 | 0.005 | 0.006 | 0.008 |
| 115–120 | 0.007 | 0.010 | 0.013 | 0.018 |
| 120–125 | 0.000 | 0.000 | 0.000 | 0.000 |
| 125–130 | 0.021 | 0.030 | 0.045 | 0.063 |
| 130–135 | 0.007 | 0.010 | 0.016 | 0.023 |
| 135–140 | 0.014 | 0.020 | 0.035 | 0.049 |
| 140–145 | 0.004 | 0.005 | 0.009 | 0.013 |
| 145–150 | 0.011 | 0.015 | 0.030 | 0.042 |
| 150–155 | 0.008 | 0.009 | 0.038 | 0.007 |
| 155–160 | 0.007 | 0.010 | 0.023 | 0.032 |
| 160–165 | 0.004 | 0.005 | 0.012 | 0.017 |
| 165–170 | 0.004 | 0.005 | 0.013 | 0.018 |
| 170–175 | 0.004 | 0.005 | 0.014 | 0.020 |
| 175–180 | 0.004 | 0.005 | 0.015 | 0.021 |
| 180–185 | 0.004 | 0.005 | 0.015 | 0.022 |
| 185–190 | 0.004 | 0.005 | 0.016 | 0.023 |
| 190–195 | 0.004 | 0.005 | 0.017 | 0.024 |
| 195–200 | 0.007 | 0.010 | 0.036 | 0.051 |
| 200–205 | 0.000 | 0.000 | 0.000 | 0.000 |
| 205–210 | 0.000 | 0.000 | 0.000 | 0.000 |
| 210–215 | 0.004 | 0.005 | 0.021 | 0.030 |
| 215–220 | 0.001 | 0.001 | 0.034 | 0.048 |
| 220–225 | 0.000 | 0.000 | 0.000 | 0.000 |
| 225–230 | 0.000 | 0.000 | 0.000 | 0.000 |
| 230–235 | 0.000 | 0.000 | 0.000 | 0.000 |
| 235–240 | 0.000 | 0.000 | 0.000 | 0.000 |
| 240–245 | 0.000 | 0.000 | 0.000 | 0.000 |
| 245–250 | 0.000 | 0.000 | 0.000 | 0.000 |
| 250–255 | 0.004 | 0.005 | 0.030 | 0.042 |
| 255–260 | 0.000 | 0.000 | 0.000 | 0.000 |
| Sums | 1 | 1 |
Cross-linking of “WT” C85A/H234C CLC-ec1
For SDS-PAGE, glutaraldehyde (Sigma-Aldrich) was added to 8 µM WT in size exclusion buffer (150 mM NaCl, 20 mM MOPS, pH 7.5, 5 mM analytical-grade DM; Anatrace), for a final concentration of glutaraldehyde of 0.4% wt/vol (∼40 mM). The reaction was allowed to proceed for 8 min, after which 10× Tris or glycine buffer was added to quench the reaction. For reconstitution, WT protein on the C85A/H234C background was labeled with Cy5-maleimide as described previously and then cross-linked with glutaraldehyde and quenched before reconstitution into 2:1 POPE/POPG liposomes (Avanti Polar Lipids). For the R230C/L249C disulfide cross-linked construct (Nguitragool and Miller, 2007), mutations were added to the C85A/H234C background using a QuikChange II site-directed mutagenesis kit (Agilent Technologies). Purification was performed as described previously (Chadda et al., 2016) in the presence of 1 mM TCEP until the size exclusion chromatography (SEC) purification step. Labeling and reconstitution was performed as before. All samples were run on nonreducing gels. For DTT reduction, 10 µM protein was incubated with 100 mM DTT at 30°C for 1 h.
Calculation of FDimer
For a homogeneous liposome population with a single protein species, the statistics of subunit capture is described by the Poisson distribution:
| (5) |
In the subunit-capture method, it is the photobleaching probability distribution that is being measured, which can be considered as a fluorescent version of the Poisson distribution. In the case of monomer–dimer equilibrium and a heterogeneous liposome population, the system becomes sufficiently complex, making an analytical solution of the expected photobleaching distribution intractable. Instead, a stochastic simulation of the Poisson process directly calculates the nonreactive monomer and dimer distributions. Complete details on the procedure for simulating the expected monomer and dimer photobleaching distributions, as well as MATLAB simulation scripts, are available elsewhere (Chadda et al., 2016; Chadda and Robertson, 2016).
A MATLAB app was created to calculate the fraction of dimer using the various models and experimental controls based on least-squares (R2) analysis (Chadda et al., 2016). The app file is available for download as a source file in the supplemental information (MATLAB 2016b or higher is required). All of the models and experimental control data are implemented in the code. For the modeling, PCy5 = 0.72, Pnon-specific = 0.14 was used, and bias = 4, i.e., bins 1–4 in the radius probability distribution (i.e., r < 25 nm) were excluded for the dimer model, and Alipid = 0.6 nm2.
Online supplemental material
MATLAB application file for least-squares calculation of the fraction of dimer based on the various monomer/dimer benchmarks presented in this paper (MATLAB 2016b or higher required) is available for download.
Results
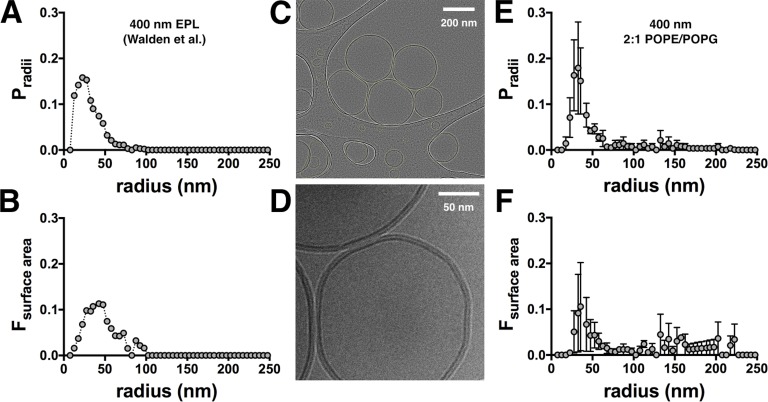
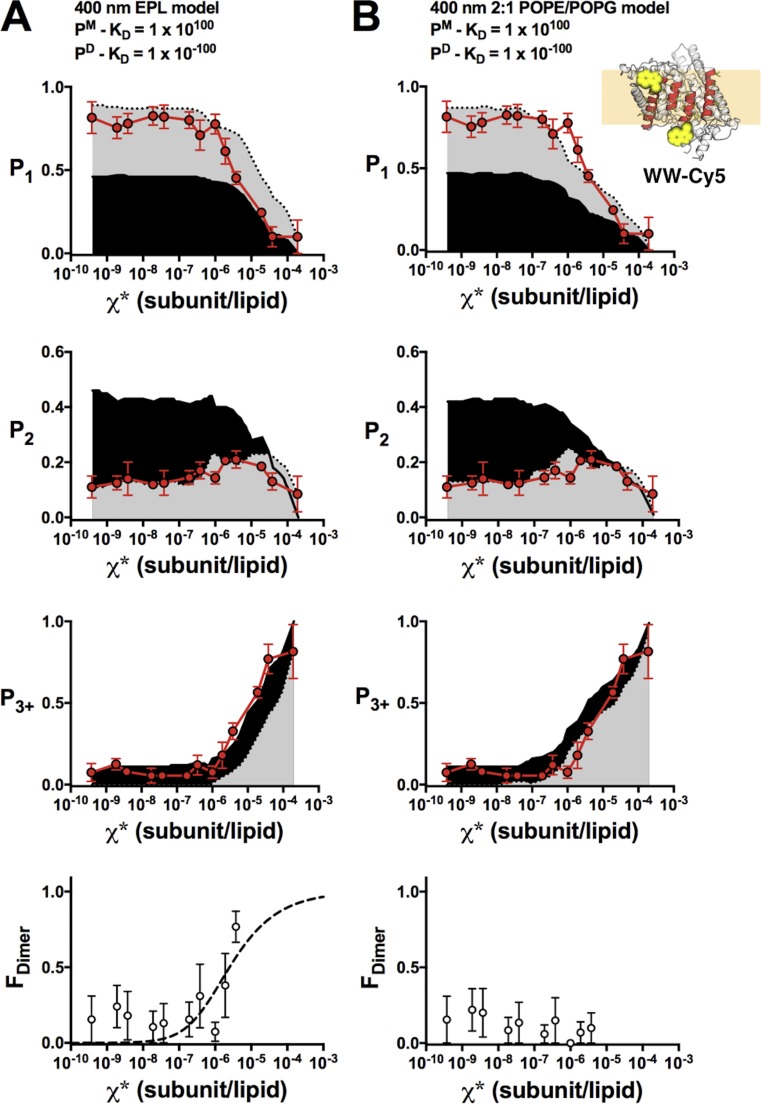
When studying protein assembly reactions, it is important to have benchmarks that map out the expected signals for the dissociated and associated states. Previously, we estimated this using a stochastic simulation of the Poisson process of subunit reconstitution into a defined liposome population based on the “Walden” distribution of 400 nm extruded vesicles comprised of EPL (Fig. 1, A and B; Walden et al., 2007). Although the data and model agreed at lower densities, it systematically deviated for χ* > 10−6 subunits/lipid, where the data contained fewer single steps (P1) and more multistep photobleaching events (P3+) than the model (see Figs. 2 A, 5 A, and 6 A). We hypothesized that larger liposomes were underrepresented in the Walden distribution, leading to a significant underestimation of liposomes containing more than three steps in the model. This could arise because of size selection during the freezing of cryo-EM samples, or it could be a result of minor differences in the lipid composition. EPL is a crude extract with ∼67% PE, 20% PG, and 10% cardiolipin, whereas our experimental lipid conditions represent a synthetic mimic made of 67% POPE and 33% POPG. To investigate this, the 400-nm extruded 2:1 POPE/POPG liposome size distribution was measured by cryo-EM (Fig. 1, C–E), showing that there is a population of larger liposomes that was not observed in the Walden distribution (Table 1). The difference is small, but the effect is pronounced when considering the fractional surface area (Fig. 1 F), which dictates the Poisson process. With the updated liposome size distribution, we reexamined the I201W/I422W (“WW”) CLC-ec1 photobleaching data from Chadda et al. (2016). Previously, this construct was found to be monomeric in detergent by both glutaraldehyde cross-linking and x-ray crystallography and also in 3:1 egg PC/POPG liposomes reconstituted at χ* = 10−5 subunits/lipid (1 µg/mg; Robertson et al., 2010). In addition, the fraction of empty liposomes (F0) measured by single-molecule colocalization microscopy for the Cy5-labeled protein and Alexa Fluor 488–labeled liposomes indicated that the protein occupancy was consistent with a monomer at saturating densities (Chadda et al., 2016). However, when FDimer was calculated using the Walden distribution, a weak apparent dimerization reaction was observed (Fig. 2 A), suggesting that dimers were either forming or that the model was incorrect at higher densities. With the 2:1 POPE/POPG distribution, the experimental WW data now correspond to the ideal monomer probabilities, and the apparent dimerization is no longer present (Fig. 2 B). This, together with the other evidence presented in previous studies, demonstrates that WW is monomeric in our experimental range of measurements and can serve as a control in the subunit-capture method.
Figure 1.
The 400-nm 2:1 POPE/POPG liposome size distribution. (A) 400-nm EPL liposome size distribution reported in Walden et al. (2007). (B) Fractional surface area (FSA) distribution. (C) Cryo-EM image of 400-nm extruded 2:1 POPE/POPG liposomes. Image has been enhanced for clear visualization of all liposomes (outlined in yellow), both in holes and on the carbon. (D) Raw cryo-EM image showing the structure of the lipid bilayer (dark lines). (E) The 400-nm 2:1 POPE/POPG liposome size distribution (mean ± SEM, n = 2). (F) FSA distribution. Actual values are reported in Table 1.
Figure 2.
WW-Cy5 is monomeric in 2:1 POPE/POPG membranes at χ* < 10−5 subunits/lipid. Comparison of experimental WW-Cy5 photobleaching probabilities (top: P1, P2, P3+; red circles, mean ± SEM, n = 2–3; previously reported in Chadda et al. [2016]) and FDimer versus χ* (bottom), against nonreactive monomer (gray) and dimer (black) predictions calculated using different liposome size distributions. (A) The 400-nm EPL Walden liposome size distribution. FDimer versus χ* shows an increase in dimerization at high densities and can be fit to a dimerization isotherm (ΔG° = −7.7 ± 0.3 kcal/mol, R2 = 0.30). (B) The 400-nm 2:1 POPE/POPG liposome size distribution. The updated liposome size distribution shows that FDimer does not increase indicating that WW-Cy5 is monomeric across the examined density range. Simulation parameters: PCy5 = 0.72, Pnon-specific = 0.14, bias = 4 and Alipid = 0.6.
Figure 5.
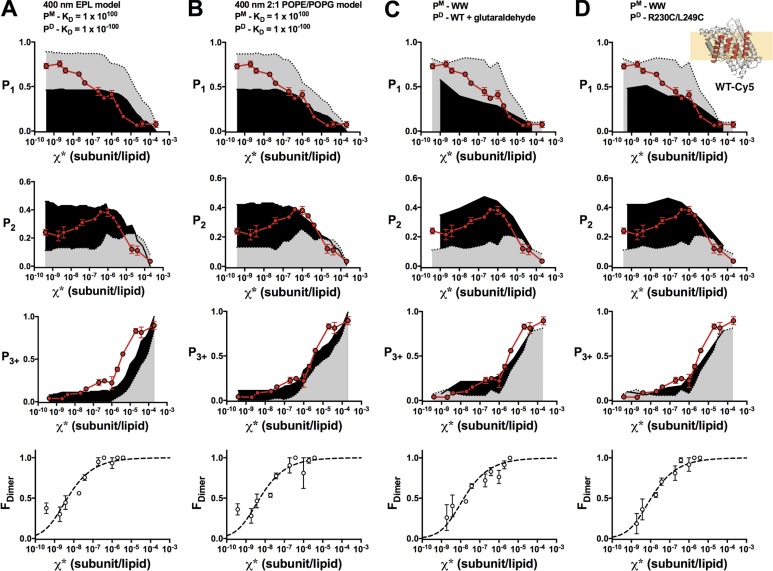
FDimer versus χ* analysis of WT-Cy5. Comparison of experimental WT-Cy5 photobleaching probabilities (top: P1, P2, P3+; red circles, mean ± SEM, n = 2–4; previously reported in Chadda et al., 2016) and FDimer versus χ* (bottom) against nonreactive monomer (gray) and dimer (black) models (PCy5 = 0.72, Pnon-specific = 0.14, bias = 4, and Alipid = 0.6) or experimental data. (A) The 400-nm EPL Walden liposome size distribution. (B) The 400-nm 2:1 POPE/POPG liposome size distribution. (C) WW-Cy5 for monomer and glutaraldehyde cross-linked WT-Cy5 for dimer. (D) WW-Cy5 for monomer and R230C/L249C-Cy5 for dimer.
Figure 6.
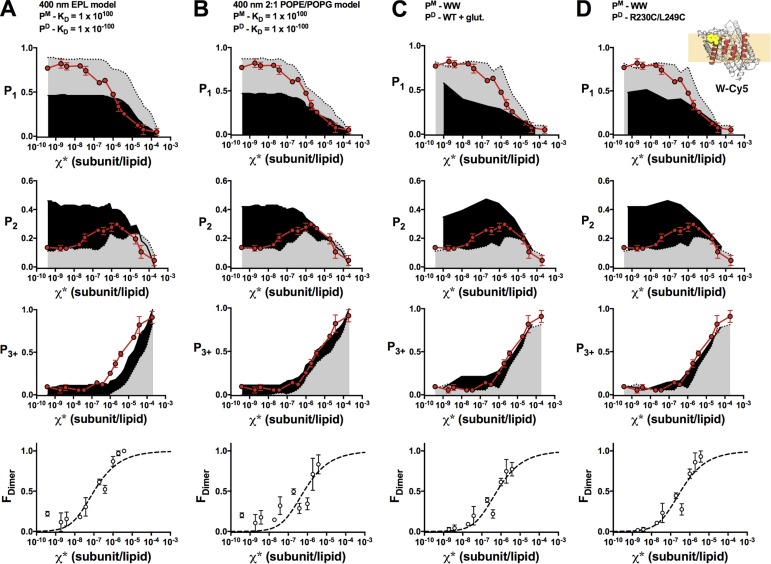
FDimer versus χ* analysis of W-Cy5. Comparison of experimental W-Cy5 photobleaching probabilities (top: P1, P2, P3+; red circles, mean ± SEM, n = 2–3; previously reported in Chadda et al., 2016) and FDimer versus χ* (bottom) against nonreactive monomer (gray) and dimer (black) models (PCy5 = 0.72, Pnon-specific = 0.14, bias = 4, and Alipid = 0.6) or experimental data. (A) The 400-nm EPL Walden liposome size distribution. (B) The 400-nm 2:1 POPE/POPG liposome size distribution. (C) WW-Cy5 for monomer and glutaraldehyde cross-linked WT-Cy5 for dimer. (D) WW-Cy5 for monomer and R230C/L249C-Cy5 for dimer.
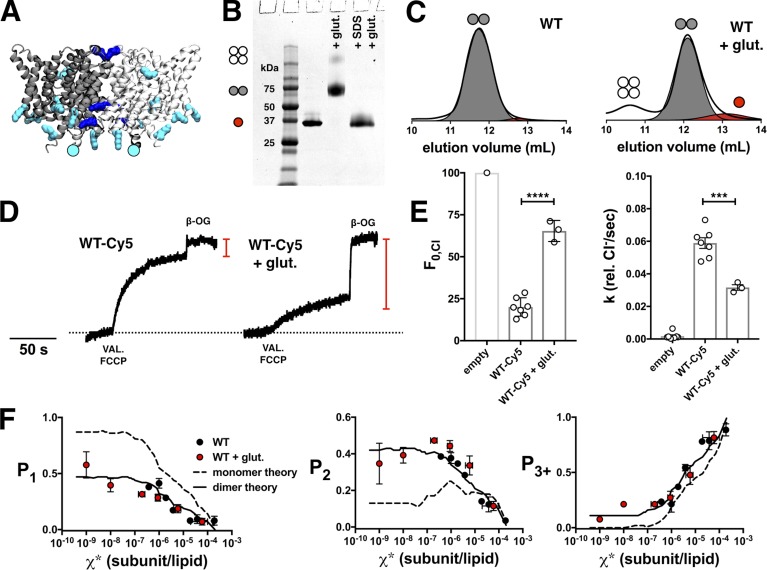
With a monomeric control in place, the next step was to identify a dimer control to establish an upper bound for the dimerization reaction. For this, we turned to covalent cross-linking methods that have already been well established for CLC-ec1. Glutaraldehyde has been shown to specifically cross-link the dimer state, as demonstrated by SDS-PAGE (Fig. 3 B; Maduke et al., 1999; Robertson et al., 2010). Glutaraldehyde is a short chain bis-reactive molecule that cross-links primary amine groups present on lysines and the N terminus. Although CLC-ec1 has 13 native lysine residues (Fig. 3 A), under our reaction conditions, glutaraldehyde captures the majority of the protein in a dimeric form, with only a small amount of protein cross-linked as a non-specific tetramer (Fig. 3, B and C). Measurement of the photobleaching probability distribution shows that WT + glutaraldehyde proteoliposomes follow the 2:1 POPE/POPG dimer model, as well as the saturating range of the WT data (Fig. 3 F). However, upon measurement of functional activity, it was found that a large fraction of the protein is nonfunctional (Fig. 3, D and E). Therefore, glutaraldehyde cross-linked WT serves as a structural dimer control in the membrane, but not one with a proper biological fold.
Figure 3.
Glutaraldehyde cross-linking of WT-Cy5. (A) Side view of CLC-ec1 homodimer, with subunits colored light and dark gray. Residues with primary amine groups that are potential glutaraldehyde cross-linking sites are highlighted as follows: lysines are turquoise, with those within 5 Å of another lysine colored dark blue; the N terminus is represented by a circle. (B) SDS-PAGE of WT (on the C85A/H234C background), WT + glutaraldehyde, and WT + 2% SDS followed by addition of glutaraldehyde. Red circle, monomer; gray circles, dimer; white circles, tetramer. (C) Size exclusion chromatography profiles of WT and glutaraldehyde cross-linked WT. (D) Functional Cl− transport of WT-Cy5 and WT-Cy5 + glutaraldehyde, reconstituted at χ* = 10−5 subunits/lipid (1 µg/mg). The red line indicates the fraction of chloride trapped in empty liposomes (F0,Cl). (E) F0,Cl and chloride transport rate (k) show a reduction of activity in the presence of glutaraldehyde (****, P ≤ 0.0001; and ***, P ≤ 0.001). Data are presented as mean ± SEM. (F) Photobleaching data of WT-Cy5 + glutaraldehyde (red, PCy5 = 0.70 ± 0.04) compared with the saturating range of WT-Cy5 (black) and monomer (dashed) versus dimer (solid) models using the 2:1 POPE/POPG liposome size distribution (PCy5 = 0.72, Pnon-specific = 0.14, bias = 4, and Alipid = 0.6). Data are presented as mean ± SEM; n = 4–6, incubated at room temperature for 7–31 d in MLVs before extrusion.
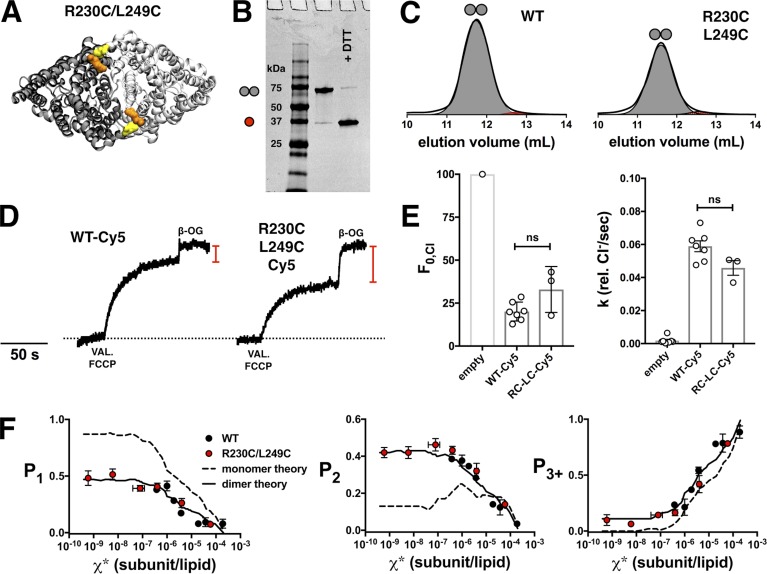
For an alternate approach, we investigated disulfide cross-linking across the dimerization interface. Previously, Nguitragool and Miller (2007) demonstrated that the CLC-ec1 dimer spontaneously cross-linked via a disulfide bond between R230C and L249C during expression and/or purification. R230C/L249C was introduced onto the C85A/H234C WT background (Fig. 4 A), purified as a dimer in detergent micelles, and ran as a dimer on nonreducing SDS-PAGE (Fig. 4, B and C). The disulfide bond was not modified by the reducing agent tris(2-carboxyethyl)phosphine (TCEP) included in the purification, which allows for the protein to remain reactive for Cy5 labeling comparable to the WT (PCy5 = 0.72 ± 0.02, n = 5). We interpret this as a disulfide bond formed between R230C and L249C, with H234C available for Cy5 labeling. However, it is possible that L249C may form the disulfide bond with H234C instead because they are positioned at a similar distance. Still, the comparable labeling yield suggests that the cysteine being modified is H234C, which is directly accessible to the surrounding solution, as opposed to R230C, which is visibly buried in the crystal structure. The photobleaching probability distribution shows that R230C/L249C corresponds to the ideal dimer simulation based on the updated 2:1 POPE/POPG liposome size distribution, as well as the saturating range of the WT data (Fig. 4 F). In addition, chloride transport function of the R230C/L249C proteoliposomes reconstituted at χ* = 10−5 subunits/lipid showed comparable function to WT (Fig. 4, D and E). Therefore, R230C/L249C provides a functionally competent dimer control for CLC-ec1 dimerization reactions, preserving the native functional fold.
Figure 4.
Disulfide cross-linking of CLC-ec1-Cy5 at R230C and L249C. (A) Top view of the CLC-ec1 homodimer showing R230C (orange) and L249C (yellow) positions. (B) SDS-PAGE of R230C/L249C (on the C85A/H234C background) and with the addition of DTT. Red circle, monomer; gray circles, dimer; white circles, tetramer. (C) Size exclusion chromatography profiles of WT and R230C/L249C. (D) Functional Cl− transport of WT-Cy5 and R230C/L249C-Cy5, reconstituted at χ* = 10−5 subunits/lipid (1 µg/mg); red line indicates F0,Cl. (E) F0,Cl and k of R230C/L249C-Cy5 (RC-LC-Cy5) show no significant difference compared with WT-Cy5. Data are presented as mean ± SEM. (F) Photobleaching data of R230C/L249C-Cy5 (red, PCy5 = 0.72 ± 0.02) compared with the saturating range of WT-Cy5 (black) and monomer (dashed) versus dimer (solid) models using the 2:1 POPE/POPG liposome size distribution (PCy5 = 0.72, Pnon-specific = 0.14, bias = 4 and Alipid = 0.6). Data are presented as mean ± SEM; n = 5, incubated at room temperature for 1–2 d in MLVs before extrusion.
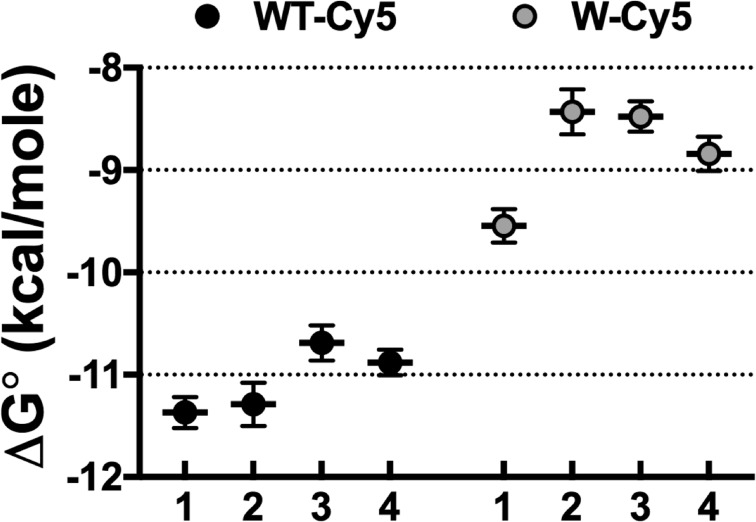
With these ideal monomer and dimer controls, we recalculated FDimer vs. χ* subunits/lipid for the WT (Fig. 5) and W (Fig. 6) constructs. The fits of the equilibrium dimerization isotherm are improved using either WT + glutaraldehyde or R230C/L249C for the dimer state and WW defining the monomeric state. However, there is no significant difference in the ΔG° values obtained using either the empirical controls or the Poisson simulation based on the 2:1 POPE/POPG distribution (Table 2 and Fig. 7). This agreement demonstrates the overall robustness of this method, whereas the development of empirical controls greatly simplifies the practical requirements of the subunit-capture approach.
Table 2. Summary of free energy values for CLC-ec1 dimerization in 2:1 POPE/POPG lipid bilayers.
| Monomer/dimer distributions | ΔG°WT | ΔG°W |
|---|---|---|
| kcal/mol | kcal/mol | |
| PM: 400-nm EPL Walden (KD = 1 × 10100) | −11.4 ± 0.2 (0.84) | −9.5 ± 0.2 (0.85) |
| PD: 400-nm EPL Walden (KD = 1 × 10−100) | ||
| PM: 400-nm 2:1 POPE/POPG (KD = 1 × 10100) | −11.3 ± 0.2 (0.70) | −8.4 ± 0.2 (0.45) |
| PD: 400-nm 2:1 POPE/POPG (KD = 1 × 10−100) | ||
| PM: WW | −10.7 ± 0.2 (0.75) | −8.5 ± 0.2 (0.80) |
| PD: WT + glutaraldehyde | ||
| PM: WW | −10.9 ± 0.1 (0.90) | −8.8 ± 0.2 (0.83) |
| PD: R230C/L249C |
Free energies are calculated as ΔG° = −RT ln(Keq χ°), where χ° is the mole fraction standard state of 1 subunit/lipid, R is the gas constant 1.99 × 10⁻³ kcal mole−1 K−1, and T is 298 K (25°C), where Keq (lipids/subunit) is determined by fitting to the equilibrium dimerization isotherm. Data represent best-fit ± error of fit (R2). KD, dissociation constant (subunit/lipid) equal to 1/Keq; PM, nonreactive monomer distribution; PD, nonreactive dimer distribution.
Figure 7.
ΔG° of CLC-ec1 dimerization in 2:1 POPE/POPG lipid bilayers: A comparison of monomer and dimer benchmarks. Comparison of ΔG° values determined using the different methods of correcting for the nonreactive monomeric and dimeric signals: (1) monomer/dimer models using the 400-nm EPL liposome distribution from Walden et al., (2) monomer/dimer models using the 400 nm 2:1 POPE/POPG liposome distribution, (3) monomer (WW-Cy5) and dimer (WT-Cy5 + glutaraldehyde), and (4) monomer (WW-Cy5) and dimer (R230C/L249C-Cy5). Reported as best-fit ± error. All values are provided in Table 2.
Discussion
The single-molecule subunit-capture method presents a way of measuring protein association reactions in membranes by passive dilution. It does not require actual knowledge of the protein structure, as the fluorophore could arbitrarily be attached to one of the termini, but it does require quantitative fluorescent labeling of the protein of interest. From there, the protein is reconstituted and introduced into the MLV state and incubated as a function of time and temperature, and then the equilibrium distribution is reported through the capture statistics of protein into liposomes. This approach follows the same principles of membrane–protein reconstitution for functional studies (Maduke et al., 1999; Walden et al., 2007; Stockbridge et al., 2013), which can be performed in parallel for rigorous interrogation of the protein fold. If the oligomeric distribution shows a reversible dependency on the density in the membrane, then this provides a way of studying the thermodynamics of membrane–protein association in lipid bilayers.
Although certain aspects of the subunit-capture approach may seem complex, the method addresses several long-standing roadblocks that have limited this area of study. First, equilibrium membrane–protein reactions depend on the membrane-like solvent and not the surrounding water. This has been outlined previously (White and Wimley, 1999) and explicitly shown for the equilibrium association of membrane proteins in detergent micelles (Fleming, 2002). Therefore, the most direct method to dilute membrane proteins is to increase the area of the bilayer. Unfortunately, spontaneous fusion of liposomes is slow, and mixing proteoliposomes with empty vesicles does not readily dilute the reaction. One solution is to drive fusion of liposomes together through repeated freeze–thaw cycles, resulting in the formation of large, 10-µm-diameter MLVs in the case of 2:1 POPE/POPG membranes (Pozo Navas et al., 2005). In this state, subunits may exchange with one another and sample the complete area of the lipid bilayer, resulting in a condition where the new equilibrium can be accessed. It is the protein distribution in this MLV state that reflects the reaction equilibrium, and this is why we measure the statistical distribution of subunit capture rather than the actual state of the protein that is trapped in the liposomes.
The second issue that arises is the limited protein signal when studying membrane proteins in membranes. Although MLVs allow dilutions as low as χ* = 10−9 subunits/lipid, at a working lipid concentration of 30 mM, this leads to a bulk protein concentration of 30 pM. This is lower than the biological limit of dilution in cell membranes, and it pushes the technical limits of bulk detection methods. Because of this, many studies have been limited to the examination of weaker complexes, where the reaction can be observed at saturating liposome densities (Yano et al., 2002, 2011; Yano and Matsuzaki, 2006; Mathiasen et al., 2014). Alternatively, equilibrium biasing methods, such as redox-driven disulfide exchange (Cristian et al., 2003; North et al., 2006) or steric trapping of the dissociated state by streptavidin binding (Hong et al., 2010), provide elegant approaches to study stronger membrane–protein complexes at high densities in liposomes. However, these methods require a sufficient knowledge of the protein structure for engineering of the protein complex. In contrast, single-molecule photobleaching analysis of subunit capture can be performed without prior knowledge of the protein structure (Stockbridge et al., 2013). Although the fluorophore labeling must be subunit specific, this is a minimal requirement for protein modification and thus presents a general method for investigating membrane–protein oligomerization in membranes. Most importantly, the single-molecule approach means that the protein signal is detected with equal quality at all densities within the membrane. At the lowest limits of dilution, observation of protein spots will become rare, but this problem is simply solved by imaging more fields or loading more liposomes onto the slide.
The development of empirical controls greatly simplifies the subunit-capture approach, adding it to the already existing arsenal of methods for studying membrane–protein oligomerization in lipid bilayers (Cristian et al., 2003; Hong et al., 2010; Yano et al., 2011, 2015; Mathiasen et al., 2014). It is important to note that the controls developed in this study can serve as monomer and dimer benchmarks in the study of other oligomerization reactions as well. For example, WT CLC-ec1 has been used as a dimeric control in the determination of the stoichiometry of the Fluc F− channel in liposomes by functional analysis of the Poisson distribution (Stockbridge et al., 2013). These controls should offer reasonable comparisons at low densities where liposomes are rarely occupied (χ* < 10−6). At higher densities, caution must be exercised, because the saturation of liposomes depends on the accessible liposome population, and this may be protein dependent. For example, colocalization microscopy indicates that CLC-ec1 dimers, with ∼10-nm end-to-end distance, are excluded from liposomes with radius smaller than 25 nm, presumably because of curvature effects (Chadda et al., 2016). In general, it is advisable to construct protein-specific controls, if possible, and this study validates methods of constructing monomeric controls by tryptophan mutagenesis (Robertson et al., 2010; Schmidt and Sturgis, 2017; Yu et al., 2017) and dimer controls by intersubunit cross-linking (Nguitragool and Miller, 2007). However, it is also possible to use the Poisson simulation approach if the liposome size distribution is known because our investigation demonstrates that these two methods converge in their quantification of the CLC-ec1 dimerization reaction. With that, we expect that these studies will simplify the methods to study other membrane–protein systems and build a path toward understanding the thermodynamic reasons why greasy membrane proteins form stable complexes in greasy lipid bilayers.
Supplementary Material
Acknowledgments
We acknowledge instrumentation support from Tom Moninger at the Microscopy Core Facility at the University of Iowa and Jonathan Remis at the Structural Biology Facility at Northwestern University.
The Structural Biology Facility is partially supported by the R.H. Lurie Comprehensive Cancer Center of Northwestern University. This research was supported by the National Institutes of Health/National Institute of General Medical Sciences (grants R00GM101016 and R01GM120260) and a Roy J. Carver Charitable Trust Foundation Early Investigator Award.
The authors declare no competing financial interests.
Author contributions: R. Chadda, L. Cliff, M. Brimberry, and J.L. Robertson designed experiments. R. Chadda, L. Cliff, and M. Brimberry carried out the experiments. R. Chadda, L. Cliff, M. Brimberry, and J.L. Robertson analyzed data and wrote the manuscript.
Merritt Maduke served as editor.
References
- Chadda R., and Robertson J.L.. 2016. Measuring Membrane Protein Dimerization Equilibrium in Lipid Bilayers by Single-Molecule Fluorescence Microscopy. Methods Enzymol. 581:53–82. 10.1016/bs.mie.2016.08.025 [DOI] [PMC free article] [PubMed] [Google Scholar]
- Chadda R., Krishnamani V., Mersch K., Wong J., Brimberry M., Chadda A., Kolmakova-Partensky L., Friedman L.J., Gelles J., and Robertson J.L.. 2016. The dimerization equilibrium of a ClC Cl(-)/H(+) antiporter in lipid bilayers. eLife. 5:e17438 10.7554/eLife.17438 [DOI] [PMC free article] [PubMed] [Google Scholar]
- Cristian L., Lear J.D., and DeGrado W.F.. 2003. Use of thiol-disulfide equilibria to measure the energetics of assembly of transmembrane helices in phospholipid bilayers. Proc. Natl. Acad. Sci. USA. 100:14772–14777. 10.1073/pnas.2536751100 [DOI] [PMC free article] [PubMed] [Google Scholar]
- Fang Y., Kolmakova-Partensky L., and Miller C.. 2007. A bacterial arginine-agmatine exchange transporter involved in extreme acid resistance. J. Biol. Chem. 282:176–182. 10.1074/jbc.M610075200 [DOI] [PubMed] [Google Scholar]
- Fleming K.G. 2002. Standardizing the free energy change of transmembrane helix-helix interactions. J. Mol. Biol. 323:563–571. 10.1016/S0022-2836(02)00920-8 [DOI] [PubMed] [Google Scholar]
- Garcia-Celma J., Szydelko A., and Dutzler R.. 2013. Functional characterization of a ClC transporter by solid-supported membrane electrophysiology. J. Gen. Physiol. 141:479–491. 10.1085/jgp.201210927 [DOI] [PMC free article] [PubMed] [Google Scholar]
- Hong H., Blois T.M., Cao Z., and Bowie J.U.. 2010. Method to measure strong protein-protein interactions in lipid bilayers using a steric trap. Proc. Natl. Acad. Sci. USA. 107:19802–19807. 10.1073/pnas.1010348107 [DOI] [PMC free article] [PubMed] [Google Scholar]
- Kobus F.J., and Fleming K.G.. 2005. The GxxxG-containing transmembrane domain of the CCK4 oncogene does not encode preferential self-interactions. Biochemistry. 44:1464–1470. 10.1021/bi048076l [DOI] [PubMed] [Google Scholar]
- Maduke M., Pheasant D.J., and Miller C.. 1999. High-level expression, functional reconstitution, and quaternary structure of a prokaryotic ClC-type chloride channel. J. Gen. Physiol. 114:713–722. 10.1085/jgp.114.5.713 [DOI] [PMC free article] [PubMed] [Google Scholar]
- Mathiasen S., Christensen S.M., Fung J.J., Rasmussen S.G.F., Fay J.F., Jorgensen S.K., Veshaguri S., Farrens D.L., Kiskowski M., Kobilka B., and Stamou D.. 2014. Nanoscale high-content analysis using compositional heterogeneities of single proteoliposomes. Nat. Methods. 11:931–934. 10.1038/nmeth.3062 [DOI] [PMC free article] [PubMed] [Google Scholar]
- Matulef K., and Maduke M.. 2005. Side-dependent inhibition of a prokaryotic ClC by DIDS. Biophys. J. 89:1721–1730. 10.1529/biophysj.105.066522 [DOI] [PMC free article] [PubMed] [Google Scholar]
- Nguitragool W., and Miller C.. 2007. CLC Cl-/H+ transporters constrained by covalent cross-linking. Proc. Natl. Acad. Sci. USA. 104:20659–20665. 10.1073/pnas.0708639104 [DOI] [PMC free article] [PubMed] [Google Scholar]
- North B., Cristian L., Fu Stowell X., Lear J.D., Saven J.G., and Degrado W.F.. 2006. Characterization of a membrane protein folding motif, the Ser zipper, using designed peptides. J. Mol. Biol. 359:930–939. 10.1016/j.jmb.2006.04.001 [DOI] [PubMed] [Google Scholar]
- Pozo Navas B., Lohner K., Deutsch G., Sevcsik E., Riske K.A., Dimova R., Garidel P., and Pabst G.. 2005. Composition dependence of vesicle morphology and mixing properties in a bacterial model membrane system. Biochim. Biophys. Acta. 1716:40–48. 10.1016/j.bbamem.2005.08.003 [DOI] [PubMed] [Google Scholar]
- Robertson J.L., Kolmakova-Partensky L., and Miller C.. 2010. Design, function and structure of a monomeric ClC transporter. Nature. 468:844–847. 10.1038/nature09556 [DOI] [PMC free article] [PubMed] [Google Scholar]
- Schindelin J., Arganda-Carreras I., Frise E., Kaynig V., Longair M., Pietzsch T., Preibisch S., Rueden C., Saalfeld S., Schmid B., et al. 2012. Fiji: an open-source platform for biological-image analysis. Nat. Methods. 9:676–682. 10.1038/nmeth.2019 [DOI] [PMC free article] [PubMed] [Google Scholar]
- Schmidt V., and Sturgis J.N.. 2017. Making Monomeric Aquaporin Z by Disrupting the Hydrophobic Tetramer Interface. ACS Omega. 2:3017–3027. 10.1021/acsomega.7b00261 [DOI] [PMC free article] [PubMed] [Google Scholar]
- Schneider C.A., Rasband W.S., and Eliceiri K.W.. 2012. NIH Image to ImageJ: 25 years of image analysis. Nat. Methods. 9:671–675. 10.1038/nmeth.2089 [DOI] [PMC free article] [PubMed] [Google Scholar]
- Stockbridge R.B., Robertson J.L., Kolmakova-Partensky L., and Miller C.. 2013. A family of fluoride-specific ion channels with dual-topology architecture. eLife. 2:e01084. [DOI] [PMC free article] [PubMed] [Google Scholar]
- Tanford C., and Reynolds J.A.. 1976. Characterization of membrane proteins in detergent solutions. Biochim. Biophys. Acta. 457:133–170. 10.1016/0304-4157(76)90009-5 [DOI] [PubMed] [Google Scholar]
- Walden M., Accardi A., Wu F., Xu C., Williams C., and Miller C.. 2007. Uncoupling and turnover in a Cl-/H+ exchange transporter. J. Gen. Physiol. 129:317–329. 10.1085/jgp.200709756 [DOI] [PMC free article] [PubMed] [Google Scholar]
- White S.H., and Wimley W.C.. 1999. Membrane protein folding and stability: physical principles. Annu. Rev. Biophys. Biomol. Struct. 28:319–365. 10.1146/annurev.biophys.28.1.319 [DOI] [PubMed] [Google Scholar]
- Yano Y., and Matsuzaki K.. 2006. Measurement of thermodynamic parameters for hydrophobic mismatch 1: self-association of a transmembrane helix. Biochemistry. 45:3370–3378. 10.1021/bi0522854 [DOI] [PubMed] [Google Scholar]
- Yano Y., Takemoto T., Kobayashi S., Yasui H., Sakurai H., Ohashi W., Niwa M., Futaki S., Sugiura Y., and Matsuzaki K.. 2002. Topological stability and self-association of a completely hydrophobic model transmembrane helix in lipid bilayers. Biochemistry. 41:3073–3080. 10.1021/bi011161y [DOI] [PubMed] [Google Scholar]
- Yano Y., Yamamoto A., Ogura M., and Matsuzaki K.. 2011. Thermodynamics of insertion and self-association of a transmembrane helix: a lipophobic interaction by phosphatidylethanolamine. Biochemistry. 50:6806–6814. 10.1021/bi200560c [DOI] [PubMed] [Google Scholar]
- Yano Y., Kondo K., Kitani R., Yamamoto A., and Matsuzaki K.. 2015. Cholesterol-induced lipophobic interaction between transmembrane helices using ensemble and single-molecule fluorescence resonance energy transfer. Biochemistry. 54:1371–1379. 10.1021/bi501528e [DOI] [PubMed] [Google Scholar]
- Yu X., Yang G., Yan C., Baylon J.L., Jiang J., Fan H., Lu G., Hasegawa K., Okumura H., Wang T., et al. 2017. Dimeric structure of the uracil:proton symporter UraA provides mechanistic insights into the SLC4/23/26 transporters. Cell Res. 27:1020–1033. 10.1038/cr.2017.83 [DOI] [PMC free article] [PubMed] [Google Scholar]
Associated Data
This section collects any data citations, data availability statements, or supplementary materials included in this article.


