

Franzini-Armstrong reviews the development of the excitation–contraction coupling field over time.
Abstract
The concept of excitation–contraction coupling is almost as old as Journal of General Physiology. It was understood as early as the 1940s that a series of stereotyped events is responsible for the rapid contraction response of muscle fibers to an initial electrical event at the surface. These early developments, now lost in what seems to be the far past for most young investigators, have provided an endless source of experimental approaches. In this Milestone in Physiology, I describe in detail the experiments and concepts that introduced and established the field of excitation–contraction coupling in skeletal muscle. More recent advances are presented in an abbreviated form, as readers are likely to be familiar with recent work in the field.
Introduction
The term excitation–contraction (e-c) coupling is commonly understood to cover the entire series of functional events that occur during the activation of muscle, starting from an initial depolarization of the surface membrane initiated by neuromuscular transmission and ending with the action of Ca2+ in disinhibiting the contractile system. My intention in starting this review was to present the history of e-c coupling from its inception. As the initial task expanded into more recent works, I found that I needed to restrict my enthusiasm, so the early history is covered more thoroughly than the recent literature. I made no attempt to establish priorities and to be comprehensive. I ask forgiveness to those whose work slipped through the mesh. A recent review covers in detail much that is only briefly sketched here (Meissner, 2017).
Although e-c coupling covers events in cardiac and smooth muscle, these two areas could not be included in the review for the sake of brevity. This is unfortunate because exchange of data and concepts between the cardiac, smooth, and skeletal fields has been very rewarding for all three areas. Comparative concepts are covered in the two reviews to be published in parallel with this one.
I am obviously strongly biased toward the role that structural considerations have played in elucidating the e-c coupling mechanisms, and this is strongly reflected in the text. I hope that my molecular and cellular physiologist friends will accept the final result.
Prehistory
Most high school students are aware of Luigi Galvani’s experiments (Galvani, 1791, 1794) demonstrating the presence of “animal electricity” as indicated by muscular contraction under the effect of either a lightning strike or the connection to two different metals via a nerve. Volta tried to assign the whole effect to outside-generated electricity, but Galvani persisted in showing that intrinsic electrical phenomena could be demonstrated. With the first methods for direct measuring of electrical events (in the brain in this case) came the discovery of uniform-size electrical signals, the action potentials in modern terminology, by E.D. Adrian (Nobel Prize in Physiology, 1932), in England. Electrical phenomena and their relationship to mechanical events were the first to be explored in the search for a clue to muscle activation, but they could not solve the mystery. The relationship between form and function needed to be revealed for a complete understanding. This is the story of how the contribution of three skeletal muscle fiber components—the transverse (T) tubules, the SR, and mitochondria—were defined.
Birth of the e-c coupling concept
The end of the 1940s and the early 1950s were periods of swift advance in all fields of biology, with the birth of cell biology. Experimental results by an extraordinary group of scientists who have been my idols were responsible for the swift advance in understanding of muscle contraction and activation in this period. “Excitation–contraction (e-c) coupling” came officially into being in 1952 with an initial identification of the steps in muscle activation and the naming of the process by Yale University physiologist Alexander Sandow. In an excellent review of the facts known at that time, which were very few, Sandow (1952) pointed out that some inward spread of events was required in order to bridge the gap between “excitation” at the surface of the fiber and contraction, initiated by the delivery of some “activator” to the internal myofibrils. This point had been explored more specifically by A.V. Hill (1949a), who revealed that the “active state,” indicated by resistance to stretch of the contracting myofibrils, developed very rapidly across the fiber cross section after the action potential at the fiber surface.
The initiating event in e-c coupling
In frog twitch fibers, e-c coupling is initiated by an action potential, and one question was whether longitudinal currents within the muscle fiber generated by the membrane ionic currents could be the triggering stimulus. Steve Kuffler (1947), using various forms of stimulation, and more fully and precisely Alan Hodgkin and Paul Horowicz (Hodgkin and Horowicz, 1960) using “potassium contractures,” indicated that a change in membrane potential is the necessary first step in e-c coupling. In fact, nature had already provided an experimental confirmation in the “tonic” muscle fibers, first discovered in frog muscle and later in some fish and avian muscles. These do not transmit an action potential, but rely on electrotonic spread from multiple nerve endings sites and respond with graded levels of tension to graded levels of depolarization. By a very rapid change of external potassium concentration, Hodgkin and Horowicz (1960) effectively clamped the membrane potential over the entire single muscle fiber to various levels that could be calculated on the basis of the external potassium concentration. These critical experiments established a threshold membrane potential for e-c coupling (−58 mV for frog twitch fibers) and showed a very steep relationship between potential and tension.
The structural and functional basis of e-c coupling
The calculation by Hill (1949b) that diffusion of an activator X from the periphery to the center would be too slow to account for the rapidity of activation that caught the attention of Andrew F. Huxley. Interestingly, Hill used Ca2+ as an example of a possible diffusing activator, a preview of things to come. Huxley missed obtaining a PhD because, like many other English scientists, he was recruited to work on radar development during World War II. So his followers used to call him Prof, or Sir Andrew later. He had been primed by his association with A.V. Hill’s son, David Hill, to think about muscle structure, and had a keen interest in the description of skeletal muscle cross-striation available in the literature in the second half of the 1800s. His experiments on e-c coupling were based on the clear visualization of the muscle striation in single dissected muscle fibers by using either polarizing or interference light microscopy. One of the very first interference microscopes was designed and built by A.F. Huxley (Huxley and Niedergerke, 1958). The legend is that the microscope was kept together by rubber bands borrowed, when needed, from the secretary’s office.
The 1967 Croonian Lecture by A.F. Huxley (1971) presented at the Royal Society London (an obligatory reading for muscle students) tells the story of the classical series of “local stimulation” experiments using muscle fibers from frog, lizard, and crab muscles. The experiments consisted of applying the small, polished tip of a pipette to the edge of the fiber, establishing a fairly high resistance contact, and then passing current to depolarize a small patch of membrane. In a frog fiber, this resulted in a local contraction that spread transversely inward only when the pipette was applied at the level of the Z line (Fig. 1, A–D). Other positions gave negative results. The initial interpretation was to assume that the Z line of the sarcomere was the element responsible for transverse conduction of some stimulus.
Figure 1.
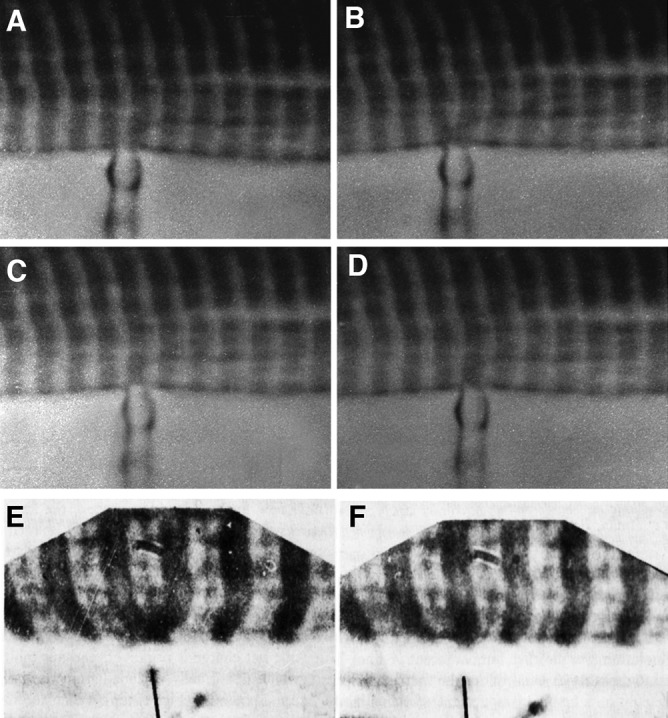
Local stimulation experiments. (A–D) Images at the edge of a single frog muscle fiber. A small fire-polished pipette establishes a fairly high resistance contact (A and C), and current is passed through the pipette (B and D). Positive spots, responding with a local contraction, are located at the center of the I band, where T tubules invaginate (B), but not opposite the A band (D). Reprinted from Huxley and Taylor (1958). (E and F) Images of a skinned fiber’s edge under oil. Application of calcium through a very small pipette activates contraction both at the I band (E) and the A band (F) level. Reprinted from Costantin and Podolsky (1965).
However, the electron microscopist J. David Robertson (1956) was present when these results were reported in 1954 and, taking a slide from his pocket, showed that some membrane-based structures between the myofibrils had a transverse orientation. The problem is that because the images were from a lizard muscle, these structures were located at the edges of the A band, not at the Z lines. The puzzle was soon solved by images of various muscle fibers by Keith Porter and George Palade (Porter and Palade, 1957) showing an extensive membrane limited structural network between the myofibrils, named sarcoplasmic reticulum, and a special group of three membrane profiles (the triad) located either at the Z line or at the A-I junctions depending on the muscle (Fig. 2, A and B). Subsequent local stimulation experiments showed that a positive effect occurred at the A-I junction in lizard muscle. Thus the triad, or some element within it, could be considered responsible for transverse transmission of the local depolarization effect. In contrast, direct application of Ca2+ to the myofibrils indicated that Ca2+ acts directly at many levels (Fig. 1, A and F; Costantin and Podolsky, 1965). Evidence that the ion acts as an intracellular transmitter through direct application of Ca2+ to the myofibrils is detailed in the section on Calcium ions, the SR, and relaxation.
Figure 2.
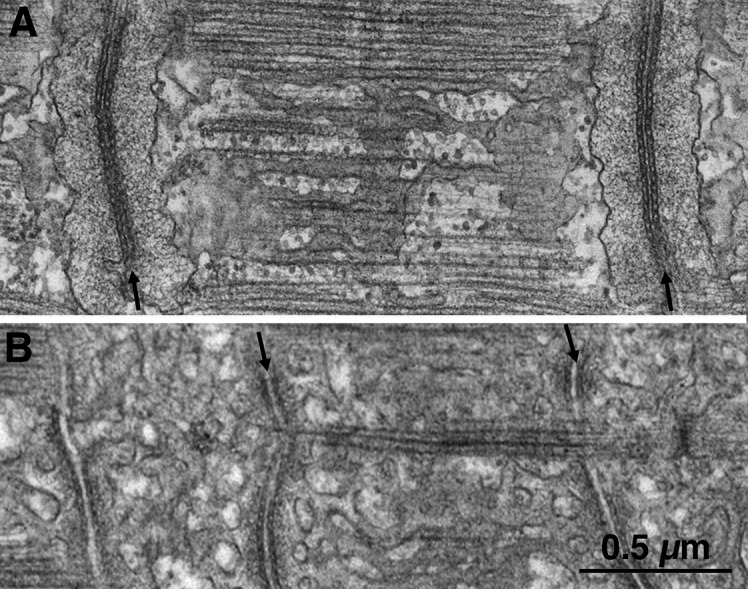
T tubules have different positions in frog and lizard muscles. (A and B) Thin sections of muscle fibers from frog (A) and lizard (B), covering the length of one sarcomere. These are the same type of muscle fibers that were used by A.F. Huxley and collaborators in the local stimulation experiments. The T tubules (arrows) run transversely at the level of the Z line in frog and at the edges of the A band in lizard, corresponding to the location of the “hot spots” through which activation can be initiated.
The T tubules and their nature
The nature of the element transmitting the electrical signal from surface to interior was soon established by Ebba Andersson-Cedergren, one of a group of worker bees dedicated to thin sectioning of tissues who occupied a large room in the laboratory of Fyodorf. S. Sjöstrand at the Karolinsa Institutet in Stockholm, Sweden. Andersson-Cedergren heroically serial-sectioned mouse muscle fibers (Andersson-Cedergren, 1959; Muscatello et al., 1961) and found that although the central element of the triad is continuous across the fiber, the SR cisternae that flank it on two sides are interrupted to various degrees. Hence, the name of T tubules that she applied to the central component of the triad, and the immediate suggestion that T tubules are the elements responsible for transmitting the electrical event to the fiber interior. A modern image of the structures in question is shown in Fig. 3. Indeed, the transverse continuity of the T tubules had already been illustrated, although not yet fully recognized, in the wonderful drawings of “Golgi-stained” muscle examined in the light microscope by Emilio Veratti in 1902, translated and republished in 1961 (Veratti, 1961).
Figure 3.

T tubules are continuous, but jSR is not. (A) A slow fiber from fish tail imaged by SEM after extraction of myofibrils. The transverse tubules (T) appear as continuous thin tubes running obliquely from lower left to upper right corners (arrows). Segmented SR cisternae face T tubules forming triads (SR/T/SR). Between triads, the SR forms extensive fenestrated collars (asterisks). Notice the abundance of SR membranes relative to those of T tubules. (B) Frog fiber infiltrated by the Golgi “stain.” The paired dark SR cisternae are the lateral sacs of the triad. The intervening T tubules between them are not visible because the electron dense contrasting agent did not infiltrate them. Note that the SR cisternae are divided into discontinuous segments. A and B are unpublished images from the collection of M. Lavorato (printed here with permission).
T tubules continuity with the extracellular space
A missing element in early e-c coupling considerations was direct evidence for continuity of the T tubule–limiting membrane with the plasmalemma and for opening of the T tubule lumen to the extracellular spaces. Both elements were detected in muscles of arthropods (Smith, 1961a,b; Fahrenbach, 1963) and in cardiac muscles (Simpson and Oertelis, 1962; Nelson and Benson, 1963; Forbes et al., 1984) where the T tubule openings are direct and wide-mouthed. In skeletal muscles and particularly in the classically used frog fibers, the demonstration was harder to obtain, mostly because of the tortuosity of peripheral T tubule segments. For muscles of vertebrates, initial evidence of T tubule openings came in 1964 from four sources: (1 and 2) independently obtained EM images of muscle fibers showing free diffusion of ferritin from the extracellular spaces into the T tubule lumen (Huxley, 1964; Page, 1964), (3) light microscope images of fibers exposed to a solution containing a fluorescent dye (Endo, 1964), and (4) EM images of muscles from a small fish in which T tubule openings were very wide and direct (Franzini-Armstrong and Porter, 1964).
The presence of T tubules solves a mystery regarding the passive electrical properties of muscle fibers: their apparent specific capacitance calculated on the basis of a simple cylindrical surface is much higher than in nerve fibers. After a careful consideration of the properties of frog versus crab muscle fibers (two classical subjects introduced into the e-c coupling field by A.F. Huxley), Gertrude Falk and Paul Fatt concluded that their data provided “evidence for the existence of two capacitances in the path between the inside and outside of the fiber, one of which has a resistance in series with it, such that the capacitance measured at low frequencies will differ from that at higher frequencies” (Falk and Fatt, 1964). The path that includes a series resistance involves, of course, the T tubules. The higher capacitance of crab versus frog fibers is entirely consistent with the convoluted surfaces of the former, which include folds as well as tubular invaginations at the Z lines and A-I junctions. A final refinement was added by Angela Dulhunty, who carefully considered the contribution of caveolae to the surface area of frog fibers, measured the fibers’ cross sections, and could then precisely calculate the plasmalemma’s specific capacitance (Dulhunty and Franzini-Armstrong, 1975).
An additional, direct demonstration of the critical role of T tubules in e-c coupling and their contribution to the fiber capacitance came early on with the “glycerol treatment,” devised by Fujino et al. (1961). The treatment interrupts the electrical and structural continuity of T tubules at the fiber’s surface (Eisenberg and Eisenberg, 1968; Eisenberg and Gage, 1969) through osmotic effects, so that extracellular tracers do not diffuse into the tubules, the membrane capacitance is greatly reduced, and e-c coupling is interrupted. Glycerol treatment for skeletal and cardiac muscles remains an effective experimental tool after more than 50 yr from the original observations.
The golden era of T tubules and “charge movement”
The local stimulation experiments focused attention on T tubules. Two clever sets of experiments, both involving close structural scrutiny of events in single muscle fibers, further clarified the specific roles of T tubules in the radial spread of activation. Applying controlled depolarization steps and observing that the thresholds for contraction at the fiber edge and at the center differ by very little, Leroy Costantin (Adrian et al., 1969) determined that active spread of depolarization through sodium current (Costantin, 1970) must occur along T tubules. Transmission along T tubules, although faster than diffusion, still involved a finite if small delay, which was defined for frog fibers in clever experiments by Hugo González-Serratos (1971) performed while in Prof. Huxley’s laboratory that provided specific information on the rapidity of the radial spread of activation.
The passive properties of T tubules could not be directly assessed, so they were the subject of intense modeling in part in the effort of deciding whether the apparent “input resistance” at the entrance to the T tubule network was a result of its geometry or some specific block to diffusion at the fiber periphery. The conclusions were not very clear, but certainly a finite delay for diffusion of ions along the T tubules can be measured (Almers, 1980), and that in turn affects the kinetics of detected charge movement (Simon and Beam, 1985). The theoretical calculations, based mostly on the geometry of the frog fibers, are not necessarily applicable to other species because internal and peripheral regions of T tubule networks display a considerable variety of shapes and dispositions in different skeletal muscle fibers. Relatively frequent longitudinal extensions of the transverse network (Veratti, 1961; Peachey and Schild, 1968) and a complex helicoidal arrangement (Peachey and Eisenberg, 1978) have been described. The openings are also quite variable, from a direct, straight opening in some fish (Franzini-Armstrong and Porter, 1964) and in many arthropods, to a short peripheral convoluted path associated with openings of caveolae in many vertebrates (Walker and Schrodt, 1965; Franzini-Armstrong et al., 1975; Forbes and Sperelakis, 1980), to a complex, convoluted, and indirect path (Franzini-Armstrong, 2002; in confirmation of the early observations by Veratti, 1961; Jayasinghe and Launikonis, 2013). Finally, it should be noted that the local stimulation experiments in frog (Huxley and Taylor, 1958) clearly indicated that T tubule openings are not present at every intermyofibrillar space, a detail which is also clearly demonstrated by images by Veratti (1961).
A giant step forward, based on a daring set of experiments, initiated a new era. By a precise disposition of voltage sensing and current delivering electrodes that established an appropriate feedback control and by the total block of ionic currents, Martin Schneider and Knox Chandler achieved voltage clamping of a muscle fiber segment to a level comparable to that up to then obtained only in squid giant axons (Schneider and Chandler, 1973). The records showed that an apparent shift in membrane capacitance requiring an extra amount of current flow occurred at membrane potentials critical for e-c coupling. On the basis of the equality of charge moved in the on and off voltage steps, it was deduced that the extra charge flowed within the membrane and that it was an indication of some rearrangement of a voltage-sensitive membrane component, most likely in the T tubules. With extraordinary insight, the authors proposed the now well-confirmed hypothesis that “charge movement” is the first step in e-c coupling and that a mechanical link with the SR is the mode of action. Independent evidence for the apparent change in membrane capacitance because of charge movement at potentials critical for e-c coupling was later obtained by Richard Adrian and Wolf Almers on the basis of the appropriate comparison of transient currents required to produce small and large steps of membrane potential (Adrian and Almers, 1976). Glycerol treatment confirmed that the charge movement was located in the T tubules (Chandler et al., 1976).
These new findings and their clear implications for e-c coupling unleashed a veritable cottage industry of “charge movement” work dependent on heroic voltage clamping experiments, such as the double vaseline gap, that became the teething rings for many developing muscle physiologists. Discussions centered on additional charge movements detected at different steps (Adrian and Almers, 1976), various shapes of the charge movement current traces and the question of which prominent hump (Qβ or Qγ) might be directly related to e-c coupling (Huang, 1982; Hui, 1983; Adrian and Huang, 1984; Lamb, 1986; Hui and Chandler, 1991), and how much the charge movement may be affected by SR Ca2+ levels: apparently very little (Jong et al., 1995a,b). The controversies that provided discussions at two successive Gordon conferences in the seventies and early eighties were recently revisited by Martin Schneider (Prosser et al., 2009) in a paper that explores the relationship between Qγ and the internal Ca2+ release. As usual, the precise experimentation and a deep knowledge of experimental details that characterize the work of Knox Chandler solved some of the questions.
Shorty after charge movement was established as the primary moving factor in e-c coupling, the complementary evidence for the total independence of skeletal muscle e-c coupling from extracellular Ca2+ entry was provided with the use of EGTA (Armstrong et al., 1972).
Calcium ions, the SR, and relaxation
In their classical electron microscopy-based description of striated muscles, Porter and Palade (1957) recognized not only the triads but also a continuous network of membrane-limited elements continuous with the triads, which was named the free or longitudinal SR. In his usual understated way, Keith Porter concluded that “the sarcoplasm of muscle fiber contains an equivalent of the endoplasmic reticulum which bears some unique and interesting structural relations to the myofibrils. This leads to the reasonable deduction that in its function the system may be an important factor in the contractile phenomena,” a very accurate prediction.
The sorting out of free SR function started with the work of two famous biochemists, Annemarie Weber (then in the USA) and Setsuro Ebashi (in Japan), both working with in vitro systems in which components of interest were obtained from a homogenate of rabbit psoas muscle. The two were convinced that calcium ions were the elements controlling the transition from rest to activity in muscle, as had been indicated by the effect of microinjecting small amounts of Ca2+ in muscle fibers (Heilbrunn and Wiercinski, 1947; Niedergerke, 1955). However, the final proof that Ca2+ was the unique key element and that its cytoplasmic concentration could be finely controlled was hard to obtain in the absence of agents (such as the modern EGTA) allowing removal of Ca2+ contaminations and discrimination between influences of calcium and magnesium. Weber conquered these difficulties, and her seminal 1959 paper (Weber, 1959) provided the ultimate demonstration that Ca2+ controls the state of contraction/relaxation of myofibrils in the presence of MgATP. Ebashi, after a meeting with Weber, demonstrated that a particulate fraction of muscle homogenate constituted of small SR-derived vesicles acts as a relaxing factor by sequestering Ca2+ (Ebashi and Lipmann, 1962), and Wilhelm Hasselbach (1966) demonstrated active Ca2+ pumping by SR vesicles. Evidence for the “calcium pump” trailed by a year or two behind that for the other main P-type pump, the K+, Na+-ATPase, responsible for maintaining the appropriate balance of K+ and Na+ in the cell. Weber et al. (1963) provided the ultimate evidence that the SR alone was sufficient to reduce the cytoplasmic Ca2+ concentration to levels sufficient for relaxation.
The final demonstration by Ebashi and Ebashi (1964) and Ebashi et al. (1967) that myofibrils contain a set of actin filaments–associated proteins, including the calcium-binding protein troponin, that confer Ca2+ sensitivity to the contractile system closed this initial chapter of the calcium story, in the 1960–1967 period.
Clever experiments demonstrate the SR pumping action in vivo
After learning how to calculate free Ca2+ concentrations from Weber, Richard Podolsky at the National Institutes of Health set out to prove that the SR functions as a Ca2+ sink in vivo with the help of Leroy Costantin, a clever young investigator (summarized in Podolsky and Costantin, 1964; Costantin and Podolsky, 1965). In a series of experiments, Costantin used the skinned frog fiber preparation developed by Reiji Natori (1954) in Japan in which the sarcolemmal components plasma membrane plus basal lamina and reticular lamina are mechanically pulled off, much like pulling up a sleeve, by gently rubbing a very sharply pointed fine wire over the fiber surface (Fig. 4 A). Usually the skinned fiber was immersed in paraffin oil, which protected it from drying. More recently, access of solutes to the fiber interior has been obtained by “chemical skinning,” although the mechanical approach still offers the best results.
Figure 4.

The SR as a calcium sink. Images from a series of experiments by Leroy Costantin and Richard Podolsky, 1965. (A) Mechanically skinned fiber a la Natori. (B) Sequential images from a brief movie showing a short fiber segment exposed to a droplet of calcium under oil. The segment contracts and then relaxes because of calcium uptake by the SR. (C) Images from a movie illustrating the effect of a drop of calcium solution applied to the edges of a skinned fiber under oil. A strong but very delimited contraction is followed by relaxation. (D) Calcium oxalate deposit in the SR of a skinned muscle fiber exposed to calcium and oxalate. Reprinted from Costantin and Podolsky (1965).
Once skinned, the fiber interior could be directly exposed to a solution containing Ca2+. The experiment shown in Fig. 1 (E and F) is a foil to the local stimulation experiments. The striation is imaged at the edge of the skinned fiber, and a Ca2+ solution is locally applied via a very narrow pipette by passing current through its tip. When the solution is applied at the level of the Z line, a symmetric contraction of the two adjacent I bands follows, in a manner similar to that elicited by the local stimulation experiments (compare Fig. 1 [A–D] with Fig. 1 [E and F]). When the pipette is applied close to one side of the A band, an asymmetric shortening occurs, showing that directly applied Ca2+ elicits contraction wherever thin and thick filaments overlap.
Two other experiments tested the Ca2+ accumulating ability of the SR in situ. In one experiment (Fig. 4 B) a short segment of skinned fiber was exposed to repeated applications of small droplets of known volume and Ca2+ content. Calculations showed that the segment was still capable of relaxation even after the Ca2+ applied was more than needed to saturate troponins in the actin filaments. In a second experiment (Fig. 4 C) a droplet was applied to the edge of a long skinned segment. The result was a contraction area, which subsequently relaxed, indicating that the SR acts as a very efficient Ca2+ sink keeping Ca2+ from freely diffusing. Interestingly, the boundaries of the contracted region were very sharply delimited, again because of the efficient uptake by the SR. Such sharp boundaries between contracted and stretched segments of muscle fibers tend to develop in pathological conditions where the SR uptake capacity is either saturated or weakened in limited areas of the fiber (e.g., Boncompagni et al., 2009). Finally, mimicking the initial observations by Hasselbach, calcium oxalate deposits, indicative of Ca2+ uptake by the SR, were demonstrated in the lumen of in situ SR of skinned segments exposed to oxalate in the presence of Ca2+ (Fig. 4 D).
A combination of Weber’s and Ebashi’s in vitro work and the in situ experiments demonstrate that in the intact fiber, the SR contains a store of calcium from which Ca2+ is released for activation.
Diversity of SR domains, the CaATPase
The SR is composed of two contiguous and continuous domains: the junctional SR (jSR), associated with plasmalemma/T tubules, and the free (often imprecisely called longitudinal) SR.
Taking advantage of density variations of the isolated organelles, the crude membrane fraction from muscle homogenate could be separated by differential centrifugation into three components. Cecilia Hidalgo took advantage of the lower density of T tubule vesicles, particularly after the SR was loaded with Ca2+, to isolate T tubule fractions from a variety of muscles in order to determine their components (Rosemblatt et al., 1981; Hidalgo et al., 1986). The “light” and “heavy” SR fractions contained membranes derived from the free SR and from the jSR with some mitochondrial contaminations, respectively (Meissner, 1975; Palade et al., 1983). Sidney Fleischer obtained a most successful triad fraction (Mitchell et al., 1988) that was preserved in a freezer and used for decades by many laboratories. The light free SR fraction is the most abundant because free SR constitutes the majority of the SR membranes (Fig. 3 A). MacLennan (1970) and Scales and Inesi (1976) used the light SR fraction for the first purification of the SR Ca2+ pump, or Ca2+ ATPase (also called SERCA, for sarcoendoplasmic reticulum Ca2+ ATPase), and demonstrated that it constitutes more than 90% of the free SR protein (Fig. 5 B), thus establishing the SR as an excellent source of pump protein. Indeed, in freeze-fracture images of skeletal muscle, the entire SR membrane, except for the junctional face membrane facing the T tubules, is occupied by a dense, uniformly distributed carpet of particles representing the Ca2+ ATPase (Fig. 5 A). Extensions of the protein over the SR surface were first detected by tannic acid mordating (Somlyo, 1979; Chu et al., 1988). The two heroes of the ATPase story are Giuseppe Inesi and Cikoshi Toyoshima. Inesi established the foundation of the pump action: the intermediate “occluded state” step (Inesi et al., 2004), identification of specific inhibitors (Inesi and Sagara, 1994; Inesi et al., 1998), establishment of the Ca/ATP stoichiometry (Yu and Inesi, 1995), and identification of H+ as the counter ion (Tadini-Buoninsegni et al., 2006). After the observation by Anthony Martonosi (Dux and Martonosi, 1983) that vanadate blocks the pumping cycle and results in tubular structures with a two-dimensional helical crystal of the ATPase on their surface (Fig. 5, C and D), an initial 3D structural reconstruction of the molecule (Taylor et al., 1986) was obtained. Paradigms developed for the 3D reconstructions of helical structures were further applied by Cikoshi Toyoshima et al. (1993) to cryo-EM images of the vanadate-treated SR, revealing the three-pronged extensions of the ATPase into the cytoplasm that are involved in the pump mechanism: the nucleotide binding, N; the phosphorylation, P; and the actuator, A, domains. After obtaining the first amino acid sequence of the ATPase (MacLennan et al., 1985), David MacLennan established that the high-affinity binding sites for two Ca2+ ions to be transported are located deep within the transmembrane region of the molecule (Clarke et al., 1989). Through a spectacular series of high-resolution x-ray diffraction images from nine states covering the entire reaction cycle and mostly in collaboration with Inesi, Toyoshima reconstructed the entire reaction cycle (Toyoshima, 2008). The detailed mechanism by which the phosphorylation site commands the opening and closing of pathways and all the conformational states that accompany the pumping are now directly visualized in stunning detail (Toyoshima, 2009).
Figure 5.

Calcium ATPase is a major component of longitudinal SR. All images are from rotary shadowed replicas. (A) Freeze fracture of a fish muscle showing the split SR membrane for an entire sarcomere, from one T tubule to the next (arrows). The cytoplasmic leaflet reveals a uniform distribution of tightly arranged particles, covering the whole free SR and the sides of the triadic SR. Each particle represents a small group of 2–3 ATPase molecules. (B) Cytoplasmic surfaces of freeze-dried SR vesicles from a crude SR fraction of rabbit muscle homogenate. Each dot indicates the position of an individual SR ATPase, at a density of ∼30,000/µm2. (C) Treatment with vanadate (Taylor et al., 1986) induces the formation of two-dimensional “crystals” that impose a tubular shape to the SR vesicles. (D) At higher magnification, the dimeric arrangement of molecules is clear. Such vanadate-treated SR tubes provided the first high-resolution images of the CaATPase.
Structural cues to events at T-SR junctions
Going back to e-c coupling, a collaboration between A.F. Huxley and Lee Peachey (Huxley, 1971) provided a clue to the step immediately after transmission along T tubules (Fig. 6). Fibers from crab leg muscles were selected for a third set of local stimulation experiment, because the longer sarcomere lengths offered better discrimination of the active sites. It turned out that they provided an additional interesting puzzle. Positive response spots were identified near the borders of the A band where T tubules were located, but Peachey, quoted in A.F. Huxley (1971), showed that other invaginations, present at the Z line level (Fig. 6 B), gave a negative response. Later images using the Golgi stain (Fig. 6, B–D) revealed that the invaginations at the edges of the A band formed close junctions with the SR equivalent to the triads, but those at the Z line did not. The conclusion is that activation required not only the spread of the depolarization along T tubules, but also some functional connection to the SR, via specialized T-SR junctions, in order to activate Ca2+ release from the SR.
Figure 6.

Couplons in e-c coupling. (A) Diagram of local stimulation experiments in crab fibers (reprinted from Peachey, 1965). Depolarization at the level of the Z line did not produce a response, but hot spots were found at the A-I junction level within deep clefts. (B) Phase contrast image of a crab fiber infiltrated with the “Golgi” stain. The orange structures are deep clefts. Two types of invagination arise from the clefts: ribbon like tubules at the Z line levels (double arrow) and tubules with a more complex shape at the edges of the A band (single arrows). (C and D) Electron micrographs of Golgi-stained crab fibers. In C, only tubules at the Z line (double arrow) and T tubules the A-I junction (single arrows) are “stained.” The latter have a convoluted shape. In D the SR is visible as an extensive lacy network and the T tubules are darker. Flat cisternae of T tubules (arrows) are located opposite equivalent cisternae of the SR (arrowhead) to form dyads. Activation of calcium release occurs at these sites. See Franzini-Armstrong et al. (1986).
Before proceeding, it is useful to introduce a terminology that was suggested by Eduardo Ríos (Stern et al., 1997). The term was proposed to indicate the structural and functional unit of SR/T tubule and SR/plasmalemma interactions. The classical triad is composed of two couplons, one on either side of the T tubule, that presumably act independently of each other. Many muscle fibers, particularly in the invertebrates, display dyads composed of a single SR element and a T tubule segment, hence a single couplon. In yet other fibers, the SR forms junctions, called peripheral couplings, between SR and the plasmalemma without intervention of a T tubule. Peripheral couplings are composed of a single couplon. All these e-c coupling units share common components, and thus it can be assumed that they share functional modes.
By the late sixties it was quite clear that the triads (and equivalent structures) warranted close observation. Initial structural information provided a false trail, but also encouraged useful discussion. Before the introduction of glutaraldehyde, primary fixation in osmium resulted in the false appearance that the jSR surface contacted the T tubules at small repetitive sites. By analogy with the known structure of gap junctions, it was proposed that a direct current path might exist between T tubules and SR, allowing the latter to be depolarized by the former during e-c coupling. An echo of similar ideas is found in several publications of the times. However, Peachey (1965) (see also Mobley and Eisenberg [1975]) had roughly estimated that the overall SR surface area is ∼10-fold larger than that of T tubules. This suggested a major “impedance mismatch” between T tubules and SR of the type that guided Bernard Katz into the concept of chemical synapses. The structural evidence quite clearly indicates that the triad cannot operate as an electrical synapse because the limited T tubule surface cannot draw enough current to effectively depolarize the entire SR. Essentially the same conclusion was derived by Mathias et al. (1980). Further, Gerhard Meissner’s demonstration that the SR membrane is highly permeable to potassium (Meissner and McKinley, 1982) and Avril and Andrew Somlyo’s evidence that potassium concentration in the SR lumen is equal to that in the cytoplasm (Somlyo et al., 1977) clearly indicated that the resting SR has no membrane potential and thus that SR depolarization does not come into play in e-c coupling.
Rather than being directly coupled by a membrane to membrane interaction, T tubule and SR membranes are connected via junctional feet, a set of large, regularly disposed macromolecules (Fig. 7, A and B; Franzini-Armstrong, 1970). Feet were identified as components of the jSR in heavy SR microsomal fraction by Kevin Campbell in 1974 (Fig. 7 C; Campbell et al., 1980). Several alternative descriptions and names—junctional processes, pillars and/or direct lipid connections—were subsequently applied to the same structures. Feet are present in all muscles of vertebrates including cardiac (Forbes et al., 1984) and smooth (Somlyo and Franzini-Armstrong, 1985) muscles and have by now been detected in all muscles through the animal kingdom, where they are constituted of the same molecular species, although in different isoforms. The importance of feet became obvious once feet were identified as the SR Ca2+ release channels. The molecule acquired the name of ryanodine receptor, based on its high affinity for the plant alkaloid ryanodine, an essential tool for the channel isolation. Identification of feet as RYR was directly supported by comparison of the structure of feet in situ and of the isolated RYR macromolecule (Fig. 7, D–I). This part of the e-c coupling story is covered in detail in a recent review (Meissner, 2017).
Figure 7.

Images of “feet” or RYR1 from skeletal muscle. (A) RYR were first visualized in thin sections of triads in skeletal muscle, where their cytoplasmic domains appeared as evenly spaced rows of feet spanning the junctional gap from SR to T tubules (Franzini-Armstrong, 1970). The content of the triad cisternae is calsequestrin. This image is from a fish muscle. (B) In a grazing view of the junction, feet are seen as small squares engaged in a two-dimensional array. From a tadpole. (C) The heavy SR fraction is composed of vesicles derived from triads (or couplons). They have a dense content (calsequestrin) and show a thin dark ring (extension of the CaATPase) and feet (arrows). This demonstrated that feet are part of the SR membrane (Campbell et al., 1980). (D) Rotary shadowed images of feet on a heavy SR vesicle show ordered arrangement and a 4-subunit structure. Reprinted from Ferguson et al. (1984). (E–I) Images of feet in situ (E and F) and after isolation of the RYR molecule (G–I). The in situ molecules show a central depression on the side facing the cytoplasm. The isolated proteins face the opposite way and show a central raised platform representing the channel domain. Compare Ferguson et al. (1984) and Block et al. (1988).
In couplons of skeletal muscle triads, where they were first described, the feet form two parallel rows (Fig. 7 B). However, in couplons that do not have a shape restricted by adjacent myofibrils, feet may occupy several rows within elongated plaques (Franzini-Armstrong, 1984; Paolini et al., 2007). An interesting example of convergent evolution is found in the fast adductor of the scallop (a bivalve mollusk) and in the tail of amphioxus (a low chordate). In both species, muscles are composed of cells with such a narrow diameter that T tubules are not needed. However, the SR forms numerous peripheral couplings with an appropriate complement of feet that occupy oval-shaped membrane regions (Di Biase and Franzini-Armstrong, 2005).
On the T tubule or plasmalemma side of couplons, the technique of freeze-fracture demonstrated a distribution of intramembrane particles grouped within the membrane facing the junctional feet and organized in arrays (Fig. 8, A–D). The particles form groups of four, or tetrads, and detailed analysis indicated that the tetrad positioning corresponded to that of alternate feet and that the four particles of tetrads fit on the four subunits of alternate feet (Franzini-Armstrong, 1984; Block et al., 1988). The importance of the feet/tetrad relationship was revealed by the identification of the tetrad particles as the T tubule calcium channels (CaV1.1) that are responsible for charge movement and act as voltage sensors in e-c coupling (Takekura et al., 1994). In skeletal muscle jargon, the channels are often referred to as dihydropyridine receptors (DHPRs) because of their pharmacological properties.
Figure 8.

The disposition of DHPR tetrads in T tubules is linked to that of feet. (A–D) The first images of DHPR tetrads were seen in T tubules of a small fish (A; Franzini-Armstrong and Nunzi, 1983) and in the plasmalemma of frog slow fibers (B–D; Franzini-Armstrong, 1984), where it was determined that the distance between tetrads is twice the distance between feet. (E–I) DHPR tetrads in T tubules of 4-d-old zebrafish larvae. E is from a wild type fish, F after the expression of DHPR cDNA. (G and H) From larvae of a zebrafish null for Stac3, but carrying small amounts of maternal DNA. (I) After silencing all DHPR RNA with a morpholino. See Linsley et al. (2017).
Comparative morphology and physiology of fiber types
Muscle fibers display an extreme variety of performance modes and are conveniently classified into “fiber types” based on their mode of activation, mechanical performance, and fatigability. In vertebrates, the two extremes are “slow tonic” fibers that develop a very slow graded contraction in the absence of an action potential as first shown by Steve Kuffler (Kuffler and Vaughan Williams, 1953), and “twitch” fibers that respond to an action potential with all-or-none contraction–relaxation cycles of different periodicities. The two types of fibers differ greatly in the size of myofibrils (Peachey and Huxley, 1962). A sufficiently broad survey of vertebrate muscles shows that all sorts of functionally and structurally intermediate “types” also exist.
The initial rate of tension development is quite strongly determined by the myosin isoform as directly demonstrated by Leroy Costantin et al. (1967) in frog tonic fibers and indirectly indicated by the gradual changes in twitch properties of cat’s hind leg muscles and the related switches in myosin isoforms during postnatal differentiation (Buller et al., 1960). The rate of relaxation is strongly dependent on the segregation of Ca2+ from the cytoplasm by passive elements, such as parvalbumin (a cytoplasmic calcium binding protein), where present (Heizmann et al., 1982), on the active reuptake by the SR and in a very minor way on mitochondria uptake.
The structure and distribution of membrane systems are well coordinated with the general fiber properties, creating a harmonious whole. Because the SR is a continuous compartment, the free [Ca2+] at equilibrium is uniform throughout the SR lumen. However, the total Ca2+ is higher at sites where the Ca2+ binding protein calsequestrin (CASQ) is present. In most muscles, this is the jSR (Somlyo et al., 1977). Sound-producing muscles capable of contraction/relaxation cycles at frequencies of ∼95–200 Hz, e.g., the bat cricothyroid (Revel, 1962), the swimbladders of toadfish (Fawcett and Revel, 1961) and midshipman (Brantley et al., 1993), and the rattle of snakes (Schaeffer et al., 1996), have attracted considerable attention. The common characteristics of these muscles are small dimensions of the myofibrils, high frequency of T tubules and triads, an extremely abundant free SR, and the presence of parvalbumin. These parameters enhance the distributed delivery of Ca2+ during activation and its relatively rapid reduction during relaxation. Two additional factors contribute to the astounding properties of the sound-producing muscles: (1) the activity cycles involve only reduced Ca2+ ion movements because the muscles are not required to develop full tension, and (2) special properties of the troponin system allow rapid return of Ca2+ to the free pool (Rome et al., 1996). The muscles of the midshipman swimbladder show an additional unique feature: the sarcomeres are separated from each other by wide Z lines that extend for a length almost equal to that of the A band (Lewis et al., 2003). This effectively reduces by almost one half the overall density of thin filaments and associated troponin and thus the amount of Ca2+ needed for activation. Interestingly, the overall content of Ca2+ release channels (feet/RYRs) is only slightly higher in the toadfish sound-producing muscles than in the fast twitch fibers of rat muscles, despite large differences in frequency of contractions. However, the surface area of Ca2+ pump bearing SR is ∼10-fold higher in the toadfish muscle (compare Ferguson and Franzini-Armstrong [1988] and Franzini-Armstrong et al. [1988] with Appelt et al. [1991]). This indicates that the ultimate return of Ca2+ to the SR lumen is a limiting factor in the superfast contraction/relaxation cycles, even with the help of parvalbumin. Other twitch muscles with fast activity, such as those of the small lizards, also show abundant SR and T systems (Forbes and Sperelakis, 1980).
At the other functional extreme are the “slow tonic” muscle fibers with slow development of tension and prolonged contractions. The common characteristics are large myofibrils, which reduce T tubule content and increase the distance between release sites; a paucity of SR/T tubule contacts, often in the form of dyads with resultant reduction of RYR content; and relatively reduced SR surface area (Page, 1965, 1969; Franzini-Armstrong, 1973). Tortoise muscles are mostly of the “twitch” type, but they move quite slowly, and so their sarcotubular system is appropriately reduced (Page, 1968).
The majority of skeletal muscles are composed of twitch fibers that cover a relatively small range of properties between “fast twitch” and “slow twitch” fibers in a single species, but also accommodate species differences (compare elephant and mouse!). Even small functional differences require precise structural coordination of the contractile system with T tubules, SR, and triads and in turn the content of CASQ (the low-affinity calcium binding protein in the SR lumen) in couplings and of sarcoendoplasmic reticulum Ca2+ ATPase in the SR membrane determine the storage levels of Ca2+ (Murphy et al., 2009). In fast twitch fibers of guinea pig leg muscles, for example, 80–90% of the T tubule length is involved in triad association with the SR, whereas in slow twitch fibers, the SR covers only ∼45% of the T tubule length (Franzini-Armstrong et al., 1988), a finding essentially confirmed recently by high-resolution light microscopy images (Jayasinghe et al., 2014). This is functionally significant because charge movement also scales with fiber types (Dulhunty and Gage, 1983). Probes of individual fiber compositions, as implemented using morphometry (Eisenberg, 1983; Franzini-Armstrong et al., 1988) and individual histochemical profiles (reviewed by Pette et al., 1999; Pette and Staron, 2000), give support to the concept that individual fibers even within a well-defined “type” are not identical in composition. This is consistent with the fact that motor units perform a graded set of functions (Burke, 1994). Ca2+ homeostasis is maintained by the opposite play of leak and uptake, and the two are balanced in a manner that is unique to fiber types and dependent on the muscle of origin (Lamboley et al., 2014).
Muscles from invertebrates also display a variety of functionally related structural variations that are well documented and often more obvious and spectacular than examples from vertebrates. For brevity, just two examples from the extremely rapid flight muscles of insects are presented here. Asynchronous or “fibrillar” flight muscles such as in the blow fly and fruit fly operate on the principles first established by Pringle (1949). Nerve impulses arrive at relatively long intervals, initiating rapid Ca2+ transients that decay very slowly. Between nerve impulses, cytoplasmic Ca2+ remains sufficiently high to allow rapid wing beat induced by the effect of two antagonistic sets of muscle, aided by an appropriate thorax anatomy and the intrinsic property of stretch activation. Thus Ca2+ release from the SR is rapid, but uptake is slow. Synchronous flight muscles, as in dragonflies, also control rapid wing beating, but nerve activation is synchronous with the beat, which depends on rapid Ca2+ release and reuptake at each wing beat. Not surprisingly, the pioneering work of David Smith (1961b) and Doreen Ashhurst (1967) showed that asynchronous flight muscles have frequent T-SR junctions, dyads, and triads but very scarce free SR. On the contrary, the synchronous flight muscles, as exemplified by the dragonfly muscles, have a high density of both triads and free SR (Smith, 1961a).
The use of Ca2+ indicators to measure Ca2+ transients
On the footsteps of charge movement detection, a concerted effort at obtaining direct detection and quantitation of the magnitude and time course of the Ca2+ release events was initiated. The myofibrils, themselves, are extremely sensitive Ca2+ indicators, but contraction is several steps removed from Ca2+ release, and thus contraction is an indirect measure of release. Intrinsic optical changes associated with release were sought, and a decrease in fiber birefringence that precedes contraction was detected in single twitch fibers (Baylor and Oetliker, 1977). This signal, however, was difficult to interpret in mechanistic terms. Chris Ashley and E.B. Ridgway in barnacle fibers (Ridgway and Ashley, 1967; Ashley and Ridgway, 1968) and John Blinks and colleagues in frog fibers (Jewell and Blinks, 1968; Blinks et al., 1978) were the first to introduce a Ca2+ indicator into the myoplasm to detect the “Ca2+ transient,” the brief increase in myoplasmic Ca2+ concentration generated during e-c coupling. They microinjected muscle fibers with aequorin, the protein isolated from a hydrozoan by Shimomura et al. (1962) that emits light in the presence of Ca2+. The aequorin responses preceded tension and were not distorted by fiber movement. Quantitation of the amplitude and time course of the Ca2+ transient from the aequorin signals was difficult, however, because of kinetic delays and the dependence of light emission on the 2.5 power of [Ca2+] (Blinks et al., 1976). Subsequent, still ongoing, research has been fueled by the availability of a large variety of inorganic Ca2+ indicators that respond with a change in optical properties in the presence of Ca2+. Initially, these were the metallochromic indicators such as Arsenazo III (Miledi et al., 1977; Baylor et al., 1983) and antipyrylazo III (Kovács et al., 1979) and more recently, the many indicators based on the compound BAPTA developed by Roger Tsien (Grynkiewicz et al., 1985).
Obtaining quantitative information on the Ca2+ release flux turned out to be a challenge. Accurate measurement of the transient was complicated by uncertainty in the indicator properties, largely associated with indicator binding in the myoplasm (e.g., Konishi et al., 1988), by kinetic delays in the indicator responses (Baylor and Hollingworth, 1988), and by local saturation of the indicator close to the release sites (Hirota et al., 1989). Furthermore, Ca2+ release flux analysis must take into account the fact that most of the released Ca2+ is bound to a variety of myoplasmic components (e.g., myofibrillar troponins, ATP, parvalbumin where present, and the SR Ca2+ pump) with variable affinity and/or diffusion distances from the source (Baylor et al., 1983; Cannell and Allen, 1984). The laboratories of Knox Chandler and Stephen Baylor carefully explored the requirement for the use of rapid, low-affinity indicators to detect the Ca2+ transient (Hirota et al., 1989; Konishi et al., 1991; Hollingworth et al., 2009) and used the data to obtain a fairly accurate understanding of the rapid Ca2+ release waveform during e-c coupling by taking into account the geometry and properties of release and binding sites (Baylor et al., 1983; Maylie et al., 1987; see also Cannell and Allen, 1984).
Interestingly, the calculated release flux in response to a voltage clamp depolarization indicates a rapid early phase of release followed by a decline to a sustained lower rate. Despite broad agreement on this time course for release, laboratories differed significantly on the functional interpretation. In one interpretation, the early peak was an inactivating CICR component superimposed on a noninactivating, voltage-dependent trigger (Rios and Pizarro, 1988; Jacquemond et al., 1991; Pizarro et al., 1992; Shirokova et al., 1996). Alternatively, the release time course was thought consistent with a single, inactivating, voltage-dependent component (Jong et al., 1995b), the decline arising from a Ca2+-dependent inhibition of the release channels (Baylor et al., 1983; Schneider and Simon, 1988). This second hypothesis fits better the case of mammalian muscles, where type 3 RyRs, responsive to CICR, are rare in the adult. One final note: the “mass” of a detected spark is strikingly influenced by the surroundings in which the event happens: frog sparks are larger in cut than in intact fibers, probably as a function of Ca2+ buffering, etc. (Hollingworth et al., 2001).
At a more descriptive level, detection of Ca2+ transients by indicators have directly facilitated qualitative understanding of intracellular Ca2+ movements under various conditions such as the obvious difference between the slow phase of Ca2+ transient decay relative to the fast initial phase of rise during release (Melzer et al., 1984; Carroll et al., 1997) and the differences in Ca2+ transients of fast and slow fibers. Studies of the superfast muscles of rattlesnake and toadfish swimbladder brought into evidence the importance of parvalbumin in allowing the slow Ca2+ uptake by the SR pump to catch up with release in repetitive events in the design of superfast muscles (Rome et al., 1996). Finally, absolute measure of resting free Ca2+ concentration in the cytoplasm could not be obtained by the use of indicators, but it required Ca2+-sensitive microelectrodes in a technique pioneered by Lopez and Allen. The advantage of the approach is that it is very sensitive to minor changes in Ca2+ homeostasis and thus it can identify changes in RYR leaks and disease-related alterations (López et al., 2000; Eltit et al., 2011; Altamirano et al., 2014).
Ca2+ sparks and the role of type 3 RYR
A fruitful step made possible by the new generation of BAPTA-based Ca2+ indicators was the detection of Ca2+ “sparks” first seen in cardiac myocytes by Peace Cheng and Mark Cannell in Jon Lederer’s laboratory (Cheng et al., 1993). Initially the term was limited to indicate spontaneously occurring small release events delimited in time and space. Later the term has also been used in conditions that encourage limited local release (such as addition of caffeine or very limited depolarization).
A direct bonus of sparks detection is a clarification of the roles of the three isoforms of RYR, particularly of RYR3’s role. RYR1 is the essential Ca2+ release channel (Takeshima et al., 1994; Buck et al., 1997), but many skeletal muscles also contain variable levels of a second isoform, RYR3, from basically none to 50% relative to RYR1. RYR3 cannot sustain e-c coupling (Ivanenko et al., 1995), and ablation of this isoform does not affect contractile function (Clancy et al., 1999). RYR3 are significantly different from RYR1 in that they spontaneously generate sparks, as demonstrated by expressing the protein in normally RYR3-deficient mouse muscle (Conklin et al., 2000; Legrand et al., 2008) and in a RYR1-null cell line, also lacking RYR3, developed by Paul Allen (Moore et al., 1998; Ward et al., 2000). Eduardo Ríos was the first to propose an explanation for the finding that although frog fibers produce sparks comparable to those detected in cardiac muscle, sparks in mouse fibers are normally below detection threshold (Shirokova et al., 1996, 1998). The possible cause for the difference was likely to be the spark amplification by the Ca2+-sensitive type 3 RYRs (see Fig. 9), which is present in frog fibers but virtually absent in adult mouse fibers. Ríos proved this directly by expressing RYR3 in mouse fibers (Pouvreau et al., 2007), and Perni et al. (2015) confirmed it by the reverse experiment in zebrafish (Fig. 9). So the two Ca2+-sensitive RYR isoforms, RYR2 in myocardium and RYR3 in some skeletal muscle, amplify spontaneous Ca2+ release by single couplons into a relatively large transient, whereas the tightly regulated RYR1 releases very poorly in the absence of an activating signal.
Figure 9.

RYR3 in a parajunctional position are necessary for the production of sparks in zebrafish muscle. (A) Triad in a 72 h postfertilization larva. Two sets of feet (RYR1) connect SR to the central T tubule profile. Additional feet profiles in a parajunctional position (arrowheads) have been proposed to be RYR3 (Felder and Franzini-Armstrong, 2002). (B) One-cell-stage embryos were injected with a morpholino designed to specifically silence RYR3 expression. In triads of larvae at 72 h postfertilization, RYR1 position was normal, but parajunctional feet were essentially missing. (C) The Ca2+ sparks frequency in WT and morpholino-injected (MO) embryos dropped in correspondence to the absence of parajunctional feet. Reprinted from Perni et al. (2015).
Perusal of spontaneously generated sparks have revealed a variety of modes (embers, etc.) and the interesting observation that “eager triads” tend to more frequently discharge. The mechanism is not known.
The form and function of the junctional supramolecular complex
Couplons are constituted of SR and plasmalemma/T tubule membranes that are associated with each other via large macromolecular complexes within sites of functional and structural junctions. The junctional complexes were initially revealed by treatment of T tubules/SR membranes with mild detergents. Whereas CaATPase and other membrane components of the free SR and T tubules were solubilized, a complex of triad proteins linked to each other remained behind in the junctional face membrane (Costello et al., 1986; Motoike et al., 1994). The first three proteins of the complex to be purified were calsequestrin contained in the jSR lumen; the feet, or SR Ca2+ release channels, or RYRs (Franzini-Armstrong and Protasi, 1997); and the L-type Ca2+ channels (CaV1.1), also called DHPRs, of the T tubules.
CASQ, a low-affinity but high-capacity Ca2+ buffer linked to RYR and to other junctional complex proteins, was first isolated by David MacLennan (MacLennan and Wong, 1971), identified as the visible content of triadic SR (Fig. 7 C; Meissner, 1975), and later confirmed by immunogold labeling (Campbell et al., 1983; Jorgensen et al., 1983). The low-molecular-weight CASQ protein constitutes complex oligomers (Park et al., 2003) that form a branched network in the SR lumen (Fig. 10, A and B; Sanchez et al., 2012; Perni et al., 2013). Skeletal and cardiac CASQ form very similar-looking networks if expressed at similar levels, and they are modified at the junctional face membrane by interaction with junctin and triadin (Tijskens et al., 2003; Franzini-Armstrong, 2009), minor junctional proteins. CASQ1 is the only isoform present in fast twitch fibers. Null mutation of CASQ1 results in a variety of structural and functional alterations of fast twitch fibers, but no immediate death of the mice. The jSR volume is reduced, as may be expected if the volume of triad cisternae depends on the presence of gelled CASQ polymer in their lumen (Paolini et al., 2007), but presence and periodic arrangement of feet is preserved. Triads shift to a longitudinal orientation, a common structural reaction of fast twitch fibers to a variety of challenges, e.g., lack of triadin and denervation, that may represent a return to a pattern specific of early differentiation. The effects are rescued by transfection with CASQ cDNA (Tomasi et al., 2012). Interestingly, lack of CASQ1 results in heat-induced sex-related death not unlike that seen in malignant hyperthermia (Dainese et al., 2009). Effect of the null mutation on Ca2+ release indirectly shows that CASQ normally affects RYR1 function (Royer et al., 2010; Olojo et al., 2011; Protasi et al., 2011; Sztretye et al., 2011).
Figure 10.

Triadin and calsequestrin. (A and B) Images of calsequestrin within the SR of a snake muscle, after freeze-fracture, deep etch, and rotary shadowing. The CASQ network is composed of a branching network of elongated elements that form a continuous CASQ polymer (Perni et al., 2013). (C and D) Triads in a mouse (C) and frog (D) muscle. The image in C is from a thicker section. Periodic densities (arrowheads) are located in alternate position relative to feet. The densities are not present in triadin-null muscle fibers, demonstrating that they are composed of triadin polymers (C; reprinted from Boncompagni et al. [2012]). In a thinner section (D), the triadin densities are less clearly visible, but the network nature of the CASQ gel that fills the SR is more obvious. Compare with A and B.
Purification and characterization of RYRs in 1987–1988 (Inui et al., 1987; Lai et al., 1987; Block et al., 1988) and identification of DHPRs as the voltage sensors of e-c coupling (Rios and Brum, 1987; Knudson et al., 1989; Adams et al., 1990) significantly altered approaches to e-c coupling research. Availability of sequencing, mutations, and expression in cultured cells, particularly the cell lines with important null mutations that were produced and generously shared by Paul D. Allen, directed research into questions of intermolecular interactions. RYRs are appropriately targeted to and arranged within couplons in the absence of DHPRs in dysgenic muscle (Franzini-Armstrong et al., 1991). DHPRs are also appropriately targeted to couplons in RYR-null dyspedic fibers, but they require the presence of the latter in order to be arranged into tetrads (Takekura et al., 1995). The Schneider-Chandler scheme of skeletal muscle e-c coupling proposed in 1973 was given a sound basis by the evidence of a reciprocal RYR1/DHPR interaction in skeletal muscle (Nakai et al., 1996; Bannister and Beam, 2009) and by the specific spatial relationship between DHPRs and RYR1s (Block et al., 1988; Paolini et al., 2004). Additionally, the proof that DHPRs in some fish muscle do not carry any Ca2+ current (Schredelseker et al., 2010) is an indication that voltage sensing and transmission to RYR are the essential functions of DHPRs, whereas gating and calcium currents are not. Unfortunately, the RYR/DHPR interaction involves large domains (Sheridan et al., 2006) as well as extra components and isolation of a RYR-DHPR complex has not yet been achieved. Complete detailed information on the structure and function of RYRs and DHPRs, including the function of various isoforms involved in cardiac versus skeletal e-c coupling and structural information up to the most recent high-resolution images, is presented in a new review in this journal (Meissner, 2017).
Several proteins have been added to the three originally identified components of the complex. Two small membrane proteins, triadin (95 kD) and junctin (26 kD), are both associated with CASQ, RYRs, and couplons (Flucher et al., 1993; Zhang et al., 1997; see also Ríos and Györke [2009] for a review). Triadin was first isolated from a heavy SR fraction by Anthony Caswell. It was shown to oligomerize by disulfide bonds (Caswell et al., 1991; Carl et al., 1995) and is also present in cardiac muscle (Brandt et al., 1993). Junctin was first isolated from cardiac muscle (Jones et al., 1995). Three triadin isoforms of different lengths have been identified (Peng et al., 1994; Marty et al., 2009; Marty, 2015). Trsk 95 is associated with the junctional complexes. Individual triadin molecules are not visible in electron micrographs, but periodic densities in the jSR lumen immediately adjacent to the feet are identified as triadin polymers because they are not present in muscles null for that isoform (Fig. 10 C; Boncompagni et al., 2012). A role for the longest of the triadin isoforms in the organization of triads in relation to other cytoplasmic components has been proposed in a collaboration between Isabel Marty and Vincenzo Sorrentino (Fourest-Lieuvin et al., 2012). Three regions of Trsk 95 needed for targeting and retention at couplons have been identified (Rossi et al., 2014). Trafficking of junctin, triadin, and CASQ follows a linked path from rough ER to jSR in cardiac muscle (Sleiman et al., 2015), where also it was shown that CASQ joins peripheral couplings before RYRs (Tijskens et al., 2003).
Hiroshi Takeshima has identified two essential components of couplons: the junctophilins, which induce the initial docking of SR to plasmalemma/T tubules, a necessary step in the assembly of couplons (Takeshima et al., 2000). T-SR junctions are formed in the absence of both DHPR and RYR (Felder et al., 2002) but do require junctophilins. Junctophilin 2, the isoform specific for cardiac muscle, occupies membrane patches closely adjacent to but not overlapping those of RYR2 within couplons (Jayasinghe et al., 2012).
The location of mitsugumin 29, another T tubule protein also initially identified by Takeshima, is more widespread than the junctional sites, and its function is not clear (Brandt and Caswell, 1999).
The latest, important addition to the list of junctional face membrane proteins is the adapter protein Stac3, first identified as essential to e-c coupling and associated with junctional T tubules in zebrafish by John Kuwada (Horstick et al., 2013). Levels of Stac3 expression are related to the frequency of DHPR tetrads in junctional T tubules of zebrafish larvae (Fig. 8, E–I; Linsley et al., 2017) The indication is that Stac3 regulates both trafficking of DHPRs and its functional connection to RYR1 (Polster et al., 2015). Perhaps Stac3 fulfills the role of a functional intermediary between DHPR and RYR that was initially proposed by Anthony Caswell for triadin (Brandt et al., 1990; Caswell et al., 1991).
Ca2+ cycling in skeletal muscle involves two events that are only indirectly related to e-c coupling, but are essential for replenishing Ca2+ loss to the extracellular space, even though the loss is minimal in skeletal muscle. In the late fifties, Ca2+ entry during activity was detected by Paul Bianchi (Bianchi and Shanes, 1959). Two mechanisms for such entry exist: excitation-coupled Ca2+ entry (ECCE) and store-operated Ca2+ entry (SOCE). ECCE, discovered by Isaac Pessah (Cherednichenko et al., 2004), may be unique to skeletal muscle. It is activated by depolarization in conjunction with e-c coupling, it is independent of SR Ca2+ depletion, and it requires the presence of both RYRs and DHPRs (Hurne et al., 2005). The nature of the ECCE Ca2+ entry channel has been debated, but recent evidence would indicate that it is actually the DHPR itself (Bannister et al., 2009). SOCE is common to many cells; it depends on the activation of the STIM1/Orai1 system initiated by a depletion of Ca2+ in ER/SR. Unexpectedly, SOCE is activated in skeletal muscle even during a single stimulus, under conditions that do not allow detection of SR Ca2+ depletion.
The role of mitochondria
Mitochondria are not active participants in e-c coupling, because they do not release Ca2+ to the cytoplasm under the control of the e-c coupling apparatus, and they take up Ca2+ only as a secondary event once it is released from the SR. However, by their presence and by the fact that they take up small amounts of Ca2+, they do influence the shape and time course of the Ca2+ transient, partly accelerating relaxation in the fibers that are rich in the organelles.
The initial history of the relationship between Ca2+ and mitochondria is interesting (see Franzini-Armstrong [2007] for a review). Britton Chance had shown uptake of Ca2+ by mitochondria, and Ernesto Carafoli, with Albert Lehninger, demonstrated a large respiration-linked accumulation of Ca2+ in isolated mitochondria. Under the influence of this work, Carafoli et al. (1969) proposed that mitochondria may have a major role in controlling cytoplasmic Ca2+ in muscle. Knowing that large amounts of Ca2+ are involved and that a large entry of Ca2+ into the mitochondrion would be energetically unfavorable in an organelle with a large negative potential, the concept generated a strong backlash not unlike that from the recent presidential election. Many years were spent demonstrating that mitochondria would take up Ca2+ only under dire circumstances (e.g., a breach of the cell membrane), but not under physiological conditions (e.g., Somlyo and Somlyo, 1986). Indeed we now know that excessive Ca2+ uptake results in mitochondria “death” and release of apoptotic factors. However, mitochondria-targeted aequorin demonstrated that mitochondria take up small amounts of Ca2+ under physiological conditions (Rizzuto et al., 1992) and that uptake depends on proximity of the mitochondria from the source (Rizzuto and Pozzan, 2006). Minor amounts of Ca2+ are taken up even during a single e-c coupling event, and the Ca2+ is important in activating respiration. The presence of active mitochondria shapes the time course of relaxation (Gillis, 1997). With that in mind, one comparative aspect that should be taken into consideration is the functional significance of the quite varied disposition of mitochondria relative to Ca2+ release sites (couplons) in a variety of muscles (Franzini-Armstrong, 2007). In some muscles (for example, in mouse fast fibers), mitochondria are closely apposed to Ca2+ release sites (triads) and even tethered to them (Boncompagni and Protasi., 2007), but in other muscles, most strikingly in fish, they are maintained at a distance from the triads.
Onward
Transformation of the generic ER of differentiating muscle cells into the highly dedicated SR and particularly the sorting of components into two distinct but continuous regions, the free SR and jSR, is quite complex, involving membrane rearrangements and independent as well as concerted migrations of specific components (Cusimano et al., 2009). The question has already been approached (Barone et al., 2015; Sleiman et al., 2015), and it is worth pursuing in view of the known interactions of many components.
Form and function are strictly intertwined in the history of e-c coupling. At the level of the organelles, relatively new high-resolution light microscopy findings have aided and complemented the foundation laid by electron microscopy. At the level of the individual components, we are now witnessing an explosion in availability of atomic-level resolution images (Meissner, 2017), but the critical relationship between DHPR and RYR that allow their reciprocal interaction has not yet been solved at the atomic level, so much still needs to be done. Translational work (e.g., in malignant hyperthermia) has revealed some interesting nuances of calcium imbalances under pathological conditions, revealing the intricacies of calcium metabolism. The hope is that translational enquiries will be pursued not only as a tool to understand disease but also as a path to a keener understanding of basic structure and function, without which, after all, disease cannot be elucidated.
Acknowledgments
I am grateful to Dr. Stephen Hollingworth for contributing the section on calcium indicators. As a major contributor to this field, his expertise is invaluable. I am especially indebted to Dr. Sally Page for her very thoughtful editing and excellent suggestions.
The author declares no competing financial interests.
Olaf S. Andersen served as editor.
References
- Adams B.A., Tanabe T., Mikami A., Numa S., and Beam K.G.. 1990. Intramembrane charge movement restored in dysgenic skeletal muscle by injection of dihydropyridine receptor cDNAs. Nature. 346:569–572. 10.1038/346569a0 [DOI] [PubMed] [Google Scholar]
- Adrian R.H., and Almers W.. 1976. Charge movement in the membrane of striated muscle. J. Physiol. 254:339–360. 10.1113/jphysiol.1976.sp011235 [DOI] [PMC free article] [PubMed] [Google Scholar]
- Adrian R.H., and Huang C.L.. 1984. Charge movements near the mechanical threshold in skeletal muscle of Rana temporaria. J. Physiol. 349:483–500. 10.1113/jphysiol.1984.sp015169 [DOI] [PMC free article] [PubMed] [Google Scholar]
- Adrian R.H., Costantin L.L., and Peachey L.D.. 1969. Radial spread of contraction in frog muscle fibres. J. Physiol. 204:231–257. 10.1113/jphysiol.1969.sp008910 [DOI] [PMC free article] [PubMed] [Google Scholar]
- Almers W. 1980. Potassium concentration changes in the transverse tubules of vertebrate skeletal muscle. Fed. Proc. 39:1527–1532. [PubMed] [Google Scholar]
- Altamirano F., Eltit J.M., Robin G., Linares N., Ding X., Pessah I.N., Allen P.D., and López J.R.. 2014. Ca2+ influx via the Na+/Ca2+ exchanger is enhanced in malignant hyperthermia skeletal muscle. J. Biol. Chem. 289:19180–19190. 10.1074/jbc.M114.550764 [DOI] [PMC free article] [PubMed] [Google Scholar]
- Andersson-Cedergren E. 1959. Ultrastructure of motor end plate and sarcoplasmic components of mouse skeletal muscle fiber as revealed by three-dimensional reconstructions from serial sections. J. Ultr. Res. 2(Suppl 1):5–191. 10.1016/S0889-1605(59)80002-1 [DOI] [Google Scholar]
- Appelt D., Shen V., and Franzini-Armstrong C.. 1991. Quantitation of Ca ATPase, feet and mitochondria in superfast muscle fibres from the toadfish, Opsanus tau. J. Muscle Res. Cell Motil. 12:543–552. 10.1007/BF01738442 [DOI] [PubMed] [Google Scholar]
- Armstrong C.M., Bezanilla F.M., and Horowicz P.. 1972. Twitches in the presence of ethylene glycol bis(β-aminoethyl ether)-N,N′-tetracetic acid. Biochim. Biophys. Acta. 267:605–608. 10.1016/0005-2728(72)90194-6 [DOI] [PubMed] [Google Scholar]
- Ashhurst D.E. 1967. The fibrillar flight muscles of giant water-bugs: an electron-microscope study. J. Cell Sci. 2:435–444. [DOI] [PubMed] [Google Scholar]
- Ashley C.C., and Ridgway E.B.. 1968. Simultaneous recording of membrane potential, calcium transient and tension in single muscle fibers. Nature. 219:1168–1169. 10.1038/2191168a0 [DOI] [PubMed] [Google Scholar]
- Bannister R.A., and Beam K.G.. 2009. Ryanodine modification of RyR1 retrogradely affects L-type Ca(2+) channel gating in skeletal muscle. J. Muscle Res. Cell Motil. 30:217–223. 10.1007/s10974-009-9190-0 [DOI] [PMC free article] [PubMed] [Google Scholar]
- Bannister R.A., Pessah I.N., and Beam K.G.. 2009. The skeletal L-type Ca(2+) current is a major contributor to excitation-coupled Ca(2+) entry. J. Gen. Physiol. 133:79–91. 10.1085/jgp.200810105 [DOI] [PMC free article] [PubMed] [Google Scholar]
- Barone V., Randazzo D., Del Re V., Sorrentino V., and Rossi D.. 2015. Organization of junctional sarcoplasmic reticulum proteins in skeletal muscle fibers. J. Muscle Res. Cell Motil. 36:501–515. 10.1007/s10974-015-9421-5 [DOI] [PubMed] [Google Scholar]
- Baylor S.M., and Hollingworth S.. 1988. Fura-2 calcium transients in frog skeletal muscle fibres. J. Physiol. 403:151–192. 10.1113/jphysiol.1988.sp017244 [DOI] [PMC free article] [PubMed] [Google Scholar]
- Baylor S.M., and Oetliker H.. 1977. A large birefringence signal preceding contraction in single twitch fibres of the frog. J. Physiol. 264:141–162. 10.1113/jphysiol.1977.sp011661 [DOI] [PMC free article] [PubMed] [Google Scholar]
- Baylor S.M., Chandler W.K., and Marshall M.W.. 1983. Sarcoplasmic reticulum calcium release in frog skeletal muscle fibres estimated from Arsenazo III calcium transients. J. Physiol. 344:625–666. 10.1113/jphysiol.1983.sp014959 [DOI] [PMC free article] [PubMed] [Google Scholar]
- Bianchi C.P., and Shanes A.M.. 1959. Calcium influx in skeletal muscle at rest, during activity, and during potassium contracture. J. Gen. Physiol. 42:803–815. 10.1085/jgp.42.4.803 [DOI] [PMC free article] [PubMed] [Google Scholar]
- Blinks J.R., Prendergast F.G., and Allen D.G.. 1976. Photoproteins as biological calcium indicators. Pharmacol. Rev. 28:1–93. [PubMed] [Google Scholar]
- Blinks J.R., Rüdel R., and Taylor S.R.. 1978. Calcium transients in isolated amphibian skeletal muscle fibres: detection with aequorin. J. Physiol. 277:291–323. 10.1113/jphysiol.1978.sp012273 [DOI] [PMC free article] [PubMed] [Google Scholar]
- Block B.A., Imagawa T., Campbell K.P., and Franzini-Armstrong C.. 1988. Structural evidence for direct interaction between the molecular components of the transverse tubule/sarcoplasmic reticulum junction in skeletal muscle. J. Cell Biol. 107:2587–2600. 10.1083/jcb.107.6.2587 [DOI] [PMC free article] [PubMed] [Google Scholar]
- Boncompagni S., and Protasi. F.. 2007. Tethers: structural connections between SR and the outer mitochondria membrane. Biophys. J. 92:A313. [Google Scholar]
- Boncompagni S., Rossi A.E., Micaroni M., Hamilton S.L., Dirksen R.T., Franzini-Armstrong C., and Protasi F.. 2009. Characterization and temporal development of cores in a mouse model of malignant hyperthermia. Proc. Natl. Acad. Sci. USA. 106:21996–22001. 10.1073/pnas.0911496106 [DOI] [PMC free article] [PubMed] [Google Scholar]
- Boncompagni S., Thomas M., Lopez J.R., Allen P.D., Yuan Q., Kranias E.G., Franzini-Armstrong C., and Perez C.F.. 2012. Triadin/Junctin double null mouse reveals a differential role for Triadin and Junctin in anchoring CASQ to the jSR and regulating Ca2+ homeostasis. PLoS One. 7:e39962 10.1371/journal.pone.0039962 [DOI] [PMC free article] [PubMed] [Google Scholar]
- Brandt N.R., and Caswell A.H.. 1999. Localization of mitsugumin 29 to transverse tubules in rabbit skeletal muscle. Arch. Biochem. Biophys. 371:348–350. 10.1006/abbi.1999.1444 [DOI] [PubMed] [Google Scholar]
- Brandt N.R., Caswell A.H., Wen S.R., and Talvenheimo J.A.. 1990. Molecular interactions of the junctional foot protein and dihydropyridine receptor in skeletal muscle triads. J. Membr. Biol. 113:237–251. 10.1007/BF01870075 [DOI] [PubMed] [Google Scholar]
- Brandt N.R., Caswell A.H., Carl S.A., Ferguson D.G., Brandt T., Brunschwig J.P., and Bassett A.L.. 1993. Detection and localization of triadin in rat ventricular muscle. J. Membr. Biol. 131:219–228. 10.1007/BF02260110 [DOI] [PubMed] [Google Scholar]
- Brantley R.K., Marchaterre M.A., and Bass A.H.. 1993. Androgen effects on vocal muscle structure in a teleost fish with inter- and intra-sexual dimorphism. J. Morphol. 216:305–318. 10.1002/jmor.1052160306 [DOI] [PubMed] [Google Scholar]
- Buck E.D., Nguyen H.T., Pessah I.N., and Allen P.D.. 1997. Dyspedic mouse skeletal muscle expresses major elements of the triadic junction but lacks detectable ryanodine receptor protein and function. J. Biol. Chem. 272:7360–7367. 10.1074/jbc.272.11.7360 [DOI] [PubMed] [Google Scholar]
- Buller A.J., Eccles J.C., and Eccles R.M.. 1960. Differentiation of fast and slow muscles in the cat hind limb. J. Physiol. 150:399–416. 10.1113/jphysiol.1960.sp006394 [DOI] [PMC free article] [PubMed] [Google Scholar]
- Burke R.E. 1994. The structure and function of motor units. In Myology. Engel A.G. and Franzini-Armstrong C., editors. Second edition Mc Graw-Hill, New York: 104–118. [Google Scholar]
- Campbell K.P., Franzini-Armstrong C., and Shamoo A.E.. 1980. Further characterization of light and heavy sarcoplasmic reticulum vesicles. Identification of the ‘sarcoplasmic reticulum feet’ associated with heavy sarcoplasmic reticulum vesicles. Biochim. Biophys. Acta. 602:97–116. 10.1016/0005-2736(80)90293-X [DOI] [PubMed] [Google Scholar]
- Campbell K.P., MacLennan D.H., Jorgensen A.O., and Mintzer M.C.. 1983. Purification and characterization of calsequestrin from canine cardiac sarcoplasmic reticulum and identification of the 53,000 dalton glycoprotein. J. Biol. Chem. 258:1197–1204. [PubMed] [Google Scholar]
- Cannell M.B., and Allen D.G.. 1984. Model of calcium movements during activation in the sarcomere of frog skeletal muscle. Biophys. J. 45:913–925. 10.1016/S0006-3495(84)84238-1 [DOI] [PMC free article] [PubMed] [Google Scholar]
- Carafoli E., Patriarca P., and Rossi C.S.. 1969. A comparative study of the role of mitochondria and the sarcoplasmic reticulum in the uptake and release of Ca++ by the rat diaphragm. J. Cell. Physiol. 74:17–29. 10.1002/jcp.1040740104 [DOI] [PubMed] [Google Scholar]
- Carl S.L., Felix K., Caswell A.H., Brandt N.R., Brunschwig J.P., Meissner G., and Ferguson D.G.. 1995. Immunolocalization of triadin, DHP receptors, and ryanodine receptors in adult and developing skeletal muscle of rats. Muscle Nerve. 18:1232–1243. 10.1002/mus.880181104 [DOI] [PubMed] [Google Scholar]
- Carroll S.L., Klein M.G., and Schneider M.F.. 1997. Decay of calcium transients after electrical stimulation in rat fast- and slow-twitch skeletal muscle fibres. J. Physiol. 501:573–588. 10.1111/j.1469-7793.1997.573bm.x [DOI] [PMC free article] [PubMed] [Google Scholar]
- Caswell A.H., Brandt N.R., Brunschwig J.P., and Purkerson S.. 1991. Localization and partial characterization of the oligomeric disulfide-linked molecular weight 95,000 protein (triadin) which binds the ryanodine and dihydropyridine receptors in skeletal muscle triadic vesicles. Biochemistry. 30:7507–7513. 10.1021/bi00244a020 [DOI] [PubMed] [Google Scholar]
- Chandler W.K., Rakowski R.F., and Schneider M.F.. 1976. Effects of glycerol treatment and maintained depolarization on charge movement in skeletal muscle. J. Physiol. 254:285–316. 10.1113/jphysiol.1976.sp011233 [DOI] [PMC free article] [PubMed] [Google Scholar]
- Cheng H., Lederer W.J., and Cannell M.B.. 1993. Calcium sparks: elementary events underlying excitation-contraction coupling in heart muscle. Science. 262:740–744. 10.1126/science.8235594 [DOI] [PubMed] [Google Scholar]
- Cherednichenko G., Hurne A.M., Fessenden J.D., Lee E.H., Allen P.D., Beam K.G., and Pessah I.N.. 2004. Conformational activation of Ca2+ entry by depolarization of skeletal myotubes. Proc. Natl. Acad. Sci. USA. 101:15793–15798. 10.1073/pnas.0403485101 [DOI] [PMC free article] [PubMed] [Google Scholar]
- Chu A., Dixon M.C., Saito A., Seiler S., and Fleischer S.. 1988. Isolation of sarcoplasmic reticulum fractions referable to longitudinal tubules and junctional terminal cisternae from rabbit skeletal muscle. Methods Enzymol. 157:36–46. 10.1016/0076-6879(88)57066-0 [DOI] [PubMed] [Google Scholar]
- Clancy J.S., Takeshima H., Hamilton S.L., and Reid M.B.. 1999. Contractile function is unaltered in diaphragm from mice lacking calcium release channel isoform 3. Am. J. Physiol. 277:R1205–R1209. [DOI] [PubMed] [Google Scholar]
- Clarke D.M., Loo T.W., Inesi G., and MacLennan D.H.. 1989. Location of high affinity Ca2+-binding sites within the predicted transmembrane domain of the sarcoplasmic reticulum Ca2+-ATPase. Nature. 339:476–478. 10.1038/339476a0 [DOI] [PubMed] [Google Scholar]
- Conklin M.W., Ahern C.A., Vallejo P., Sorrentino V., Takeshima H., and Coronado R.. 2000. Comparison of Ca2+ sparks produced independently by two ryanodine receptor isoforms (type 1 or type 3). Biophys. J. 78:1777–1785. 10.1016/S0006-3495(00)76728-2 [DOI] [PMC free article] [PubMed] [Google Scholar]
- Costantin L.L. 1970. The role of sodium current in the radial spread of contraction in frog muscle fibers. J. Gen. Physiol. 55:703–715. 10.1085/jgp.55.6.703 [DOI] [PMC free article] [PubMed] [Google Scholar]
- Costantin L.L., and Podolsky R.J.. 1965. Calcium localization and the activation of striated muscle fibers. Fed. Proc. 24:1141–1145. [PubMed] [Google Scholar]
- Costantin L.L., Podolsky R.J., and Tice L.W.. 1967. Calcium activation of frog slow muscle fibres. J. Physiol. 188:261–271. 10.1113/jphysiol.1967.sp008137 [DOI] [PMC free article] [PubMed] [Google Scholar]
- Costello B., Chadwick C., Saito A., Chu A., Maurer A., and Fleischer S.. 1986. Characterization of the junctional face membrane from terminal cisternae of sarcoplasmic reticulum. J. Cell Biol. 103:741–753. 10.1083/jcb.103.3.741 [DOI] [PMC free article] [PubMed] [Google Scholar]
- Cusimano V., Pampinella F., Giacomello E., and Sorrentino V.. 2009. Assembly and dynamics of proteins of the longitudinal and junctional sarcoplasmic reticulum in skeletal muscle cells. Proc. Natl. Acad. Sci. USA. 106:4695–4700. 10.1073/pnas.0810243106 [DOI] [PMC free article] [PubMed] [Google Scholar]
- Dainese M., Quarta M., Lyfenko A.D., Paolini C., Canato M., Reggiani C., Dirksen R.T., and Protasi F.. 2009. Anesthetic- and heat-induced sudden death in calsequestrin-1-knockout mice. FASEB J. 23:1710–1720. 10.1096/fj.08-121335 [DOI] [PMC free article] [PubMed] [Google Scholar]
- Di Biase V., and Franzini-Armstrong C.. 2005. Evolution of skeletal type e-c coupling: A novel means of controlling calcium delivery. J. Cell Biol. 171:695–704. 10.1083/jcb.200503077 [DOI] [PMC free article] [PubMed] [Google Scholar]
- Dulhunty A.F., and Franzini-Armstrong C.. 1975. The relative contributions of the folds and caveolae to the surface membrane of frog skeletal muscle fibres at different sarcomere lengths. J. Physiol. 250:513–539. 10.1113/jphysiol.1975.sp011068 [DOI] [PMC free article] [PubMed] [Google Scholar]
- Dulhunty A.F., and Gage P.W.. 1983. Asymmetrical charge movement in slow- and fast-twitch mammalian muscle fibres in normal and paraplegic rats. J. Physiol. 341:213–231. 10.1113/jphysiol.1983.sp014802 [DOI] [PMC free article] [PubMed] [Google Scholar]
- Dux L., and Martonosi A.. 1983. Two-dimensional array of proteins in sarcoplasmic reticulum and purified Ca ATPase vesicles treated with vanadate. J. Biol. Chem. 258:2599–2603. [PubMed] [Google Scholar]
- Ebashi S., and Ebashi F.. 1964. A new protein component participating in the superprecipitation of actomytosin B. J. Biochem. 55:604–613. 10.1093/oxfordjournals.jbchem.a127933 [DOI] [PubMed] [Google Scholar]
- Ebashi S., and Lipmann F.. 1962. Adenosine triphosphate-linked concentration of calcium ions in a particulate fraction of rabbit muscle. J. Cell Biol. 14:389–400. 10.1083/jcb.14.3.389 [DOI] [PMC free article] [PubMed] [Google Scholar]
- Ebashi S., Ebashi F., and Kodama A.. 1967. Troponin as the Ca++-receptive protein in the contractile system. J. Biochem. 62:137–138. 10.1093/oxfordjournals.jbchem.a128628 [DOI] [PubMed] [Google Scholar]
- Eisenberg B.R. 1983. Quantitative ultrastructure of mammalian skeletal muscle. In Handbook of Physiology. Peachey L.D., Adrian R.H., and Geiger S.R., editors. American Physiological Society, Washington, DC: 73–112. [Google Scholar]
- Eisenberg B., and Eisenberg R.S.. 1968. Selective disruption of the sarcotubular system in frog sartorius muscle. A quantitative study with exogenous peroxidase as a marker. J. Cell Biol. 39:451–467. 10.1083/jcb.39.2.451 [DOI] [PMC free article] [PubMed] [Google Scholar]
- Eisenberg R.S., and Gage P.W.. 1969. Ionic conductances of the surface and transverse tubular membranes of frog sartorius fibers. J. Gen. Physiol. 53:279–297. 10.1085/jgp.53.3.279 [DOI] [PMC free article] [PubMed] [Google Scholar]
- Eltit J.M., Li H., Ward C.W., Molinski T., Pessah I.N., Allen P.D., and Lopez J.R.. 2011. Orthograde dihydropyridine receptor signal regulates ryanodine receptor passive leak. Proc. Natl. Acad. Sci. USA. 108:7046–7051. 10.1073/pnas.1018380108 [DOI] [PMC free article] [PubMed] [Google Scholar]
- Endo M. 1964. Entry of a dye into the sarcotubular system of muscle. Nature. 202:1115–1116. 10.1038/2021115b0 [DOI] [PubMed] [Google Scholar]
- Fahrenbach W.H. 1963. The sarcoplasmic reticulum of striated muscle of a cyclopoid copepod. J. Cell Biol. 17:629–640. 10.1083/jcb.17.3.629 [DOI] [PMC free article] [PubMed] [Google Scholar]
- Falk G., and Fatt P.. 1964. Linear electrical properties of striated muscle fibers observed with intracellular electrodes. Proc. R. Soc. Lond. B Biol. Sci. 160:69–123. 10.1098/rspb.1964.0030 [DOI] [PubMed] [Google Scholar]
- Fawcett D.W., and Revel J.P.. 1961. The sarcoplasmic reticulum of a fast-acting fish muscle. J. Biophys. Biochem. Cytol. 10:89–109. 10.1083/jcb.10.4.89 [DOI] [PMC free article] [PubMed] [Google Scholar]
- Felder E., and Franzini-Armstrong C.. 2002. Type 3 ryanodine receptors of skeletal muscle are segregated in a parajunctional position. Proc. Natl. Acad. Sci. USA. 99:1695–1700. 10.1073/pnas.032657599 [DOI] [PMC free article] [PubMed] [Google Scholar]
- Felder E., Protasi F., Hirsch R., Franzini-Armstrong C., and Allen P.D.. 2002. Morphology and molecular composition of sarcoplasmic reticulum surface junctions in the absence of DHPR and RyR in mouse skeletal muscle. Biophys. J. 82:3144–3149. 10.1016/S0006-3495(02)75656-7 [DOI] [PMC free article] [PubMed] [Google Scholar]
- Ferguson D.G., and Franzini-Armstrong C.. 1988. The Ca2+ ATPase content of slow and fast twitch fibers of guinea pig. Muscle Nerve. 11:561–570. 10.1002/mus.880110607 [DOI] [PubMed] [Google Scholar]
- Ferguson D.G., Schwartz H.W., and Franzini-Armstrong C.. 1984. Subunit structure of junctional feet in triads of skeletal muscle: A freeze-drying, rotary-shadowing study. J. Cell Biol. 99:1735–1742. 10.1083/jcb.99.5.1735 [DOI] [PMC free article] [PubMed] [Google Scholar]
- Flucher B.E., Andrews S.B., Fleischer S., Marks A.R., Caswell A., and Powell J.A.. 1993. Triad formation: Organization and function of the sarcoplasmic reticulum calcium release channel and triadin in normal and dysgenic muscle in vitro. J. Cell Biol. 123:1161–1174. 10.1083/jcb.123.5.1161 [DOI] [PMC free article] [PubMed] [Google Scholar]
- Forbes M.S., and Sperelakis N.. 1980. Membrane systems in skeletal muscle of the lizard Anolis carolinensis. J. Ultrastruct. Res. 73:245–261. 10.1016/S0022-5320(80)90127-6 [DOI] [PubMed] [Google Scholar]
- Forbes M.S., Hawkey L.A., and Sperelakis N.. 1984. The transverse-axial tubular system (TATS) of mouse myocardium: its morphology in the developing and adult animal. Am. J. Anat. 170:143–162. 10.1002/aja.1001700203 [DOI] [PubMed] [Google Scholar]
- Fourest-Lieuvin A., Rendu J., Osseni A., Pernet-Gallay K., Rossi D., Oddoux S., Brocard J., Sorrentino V., Marty I., and Fauré J.. 2012. Role of triadin in the organization of reticulum membrane at the muscle triad. J. Cell Sci. 125:3443–3453. 10.1242/jcs.100958 [DOI] [PubMed] [Google Scholar]
- Franzini-Armstrong C. 1970. Studies of the triad: I. Structure of the junction in frog twitch fibers. J. Cell Biol. 47:488–499. 10.1083/jcb.47.2.488 [DOI] [PMC free article] [PubMed] [Google Scholar]
- Franzini-Armstrong C. 1973. Studies of the triad: IV. Structure of the junction in frog slow fibers. J. Cell Biol. 56:120–128. 10.1083/jcb.56.1.120 [DOI] [PMC free article] [PubMed] [Google Scholar]
- Franzini-Armstrong C. 1984. Freeze-fracture of frog slow tonic fibers. Structure of surface and internal membranes. Tissue Cell. 16:647–664. 10.1016/0040-8166(84)90038-7 [DOI] [PubMed] [Google Scholar]
- Franzini-Armstrong C. 2002. Veratti and beyond: structural contributions to the study of muscle activation. Rend. Fis. Acc. Lincei. 13:289–323. 10.1007/BF02904357 [DOI] [Google Scholar]
- Franzini-Armstrong C. 2007. ER-mitochondria communication. How privileged? Physiology (Bethesda). 22:261–268. 10.1152/physiol.00017.2007 [DOI] [PubMed] [Google Scholar]
- Franzini-Armstrong C. 2009. Architecture and regulation of the Ca2+ delivery system in muscle cells. Appl. Physiol. Nutr. Metab. 34:323–327. 10.1139/H09-017 [DOI] [PubMed] [Google Scholar]
- Franzini-Armstrong C., and Nunzi G.. 1983. Junctional feet and particles in the triads of a fast-twitch muscle fibre. J. Muscle Res. Cell Motil. 4:233–252. 10.1007/BF00712033 [DOI] [PubMed] [Google Scholar]
- Franzini-Armstrong C., and Porter K.R.. 1964. Sarcolemmal invaginations constituting the T-system in fish muscle fibers. J. Cell Biol. 22:675–696. 10.1083/jcb.22.3.675 [DOI] [PMC free article] [PubMed] [Google Scholar]
- Franzini-Armstrong C., and Protasi F.. 1997. Ryanodine receptors of striated muscles: a complex channel capable of multiple interactions. Physiol. Rev. 77:699–729. [DOI] [PubMed] [Google Scholar]
- Franzini-Armstrong C., Landmesser L., and Pilar G.. 1975. Size and shape of transverse tubule openings in frog twitch muscle fibers. J. Cell Biol. 64:493–497. 10.1083/jcb.64.2.493 [DOI] [PMC free article] [PubMed] [Google Scholar]
- Franzini-Armstrong C., Eastwood A.B., and Peachey L.D.. 1986. Shape and disposition of clefts, tubules, and sarcoplasmic reticulum in long and short sarcomere fibers of crab and crayfish. Cell Tissue Res. 244:9–19. 10.1007/BF00218376 [DOI] [PubMed] [Google Scholar]
- Franzini-Armstrong C., Ferguson D.G., and Champ C.. 1988. Discrimination between fast- and slow-twitch fibres of guinea pig skeletal muscle using the relative surface density of junctional transverse tubule membrane. J. Muscle Res. Cell Motil. 9:403–414. 10.1007/BF01774067 [DOI] [PubMed] [Google Scholar]
- Franzini-Armstrong C., Pincon-Raymond M., and Rieger F.. 1991. Muscle fibers from dysgenic mouse in vivo lack a surface component of peripheral couplings. Dev. Biol. 146:364–376. 10.1016/0012-1606(91)90238-X [DOI] [PubMed] [Google Scholar]
- Fujino M., Yamaguchi T., and Suzuki K.. 1961. ‘Glycerol effect’ and the mechanism linking excitation of the plasma membrane with contraction. Nature. 192:1159–1161. 10.1038/1921159a0 [DOI] [PubMed] [Google Scholar]
- Galvani L. A.1791. De Viribus- Electricitatis in Motu Musculari Commentarius. Bolonia: Ex typographia Instituti Scientiarum. [Google Scholar]
- Galvani L.A.1794. Del’uso e dell’attivita dell’arco conduttore nella contrazione dei muscoli. Bolonia: Accademia delle Scienze. [Google Scholar]
- Gillis J.M. 1997. Inhibition of mitochondrial calcium uptake slows down relaxation in mitochondria-rich skeletal muscles. J. Muscle Res. Cell Motil. 18:473–483. 10.1023/A:1018603032590 [DOI] [PubMed] [Google Scholar]
- González-Serratos H. 1971. Inward spread of activation in vertebrate muscle fibres. J. Physiol. 212:777–799. 10.1113/jphysiol.1971.sp009356 [DOI] [PMC free article] [PubMed] [Google Scholar]
- Grynkiewicz G., Poenie M., and Tsien R.Y.. 1985. A new generation of Ca2+ indicators with greatly improved fluorescence properties. J. Biol. Chem. 260:3440–3450. [PubMed] [Google Scholar]
- Hasselbach W. 1966. Structural and enzymatic properties of the calcium transporting membranes of the sarcoplasmic reticulum. Ann. N. Y. Acad. Sci. 137(2 Biological Me):1041–1048. 10.1111/j.1749-6632.1966.tb50216.x [DOI] [PubMed] [Google Scholar]
- Heilbrunn L.V., and Wiercinski F.J.. 1947. The action of various cations on muscle protoplasm. J. Cell. Comp. Physiol. 29:15–32. 10.1002/jcp.1030290103 [DOI] [PubMed] [Google Scholar]
- Heizmann C.W., Berchtold M.W., and Rowlerson A.M.. 1982. Correlation of parvalbumin concentration with relaxation speed in mammalian muscles. Proc. Natl. Acad. Sci. USA. 79:7243–7247. 10.1073/pnas.79.23.7243 [DOI] [PMC free article] [PubMed] [Google Scholar]
- Hidalgo C., González M.E., and García A.M.. 1986. Calcium transport in transverse tubules isolated from rabbit skeletal muscle. Biochim. Biophys. Acta. 854:279–286. 10.1016/0005-2736(86)90121-5 [DOI] [PubMed] [Google Scholar]
- Hill A.V. 1949a The abrupt transition from rest to activity in muscle. Proc. R. Soc. Lond. B Biol. Sci. 136:399–420. 10.1098/rspb.1949.0033 [DOI] [PubMed] [Google Scholar]
- Hill A.V. 1949b The onset of contraction. Proc. R. Soc. Lond. B Biol. Sci. 136:242–254. 10.1098/rspb.1949.0023 [DOI] [PubMed] [Google Scholar]
- Hirota A., Chandler W.K., Southwick P.L., and Waggoner A.S.. 1989. Calcium signals recorded from two new purpurate indicators inside frog cut twitch fibers. J. Gen. Physiol. 94:597–631. 10.1085/jgp.94.4.597 [DOI] [PMC free article] [PubMed] [Google Scholar]
- Hodgkin A.L., and Horowicz P.. 1960. Potassium contractures in single muscle fibres. J. Physiol. 153:386–403. 10.1113/jphysiol.1960.sp006541 [DOI] [PMC free article] [PubMed] [Google Scholar]
- Hollingworth S., Peet J., Chandler W.K., and Baylor S.M.. 2001. Calcium sparks in intact skeletal muscle fibers of the frog. J. Gen. Physiol. 118:653–678. 10.1085/jgp.118.6.653 [DOI] [PMC free article] [PubMed] [Google Scholar]
- Hollingworth S., Gee K.R., and Baylor S.M.. 2009. Low-affinity Ca2+ indicators compared in measurements of skeletal muscle Ca2+ transients. Biophys. J. 97:1864–1872. 10.1016/j.bpj.2009.07.021 [DOI] [PMC free article] [PubMed] [Google Scholar]
- Horstick E.J., Linsley J.W., Dowling J.J., Hauser M.A., McDonald K.K., Ashley-Koch A., Saint-Amant L., Satish A., Cui W.W., Zhou W., et al. 2013. Stac3 is a component of the excitation-contraction coupling machinery and mutated in Native American myopathy. Nat. Commun. 4:1952 10.1038/ncomms2952 [DOI] [PMC free article] [PubMed] [Google Scholar]
- Huang C.L. 1982. Pharmacological separation of charge movement components in frog skeletal muscle. J. Physiol. 324:375–387. 10.1113/jphysiol.1982.sp014118 [DOI] [PMC free article] [PubMed] [Google Scholar]
- Hui C.S. 1983. Pharmacological studies of charge movement in frog skeletal muscle. J. Physiol. 337:509–529. 10.1113/jphysiol.1983.sp014639 [DOI] [PMC free article] [PubMed] [Google Scholar]
- Hui C.S., and Chandler W.K.. 1991. Q βand Q γ components of intramembranous charge movement in frog cut twitch fibers. J. Gen. Physiol. 98:429–464. 10.1085/jgp.98.3.429 [DOI] [PMC free article] [PubMed] [Google Scholar]
- Hurne A.M., O’Brien J.J., Wingrove D., Cherednichenko G., Allen P.D., Beam K.G., and Pessah I.N.. 2005. Ryanodine receptor type 1 (RyR1) mutations C4958S and C4961S reveal excitation-coupled calcium entry (ECCE) is independent of sarcoplasmic reticulum store depletion. J. Biol. Chem. 280:36994–37004. 10.1074/jbc.M506441200 [DOI] [PubMed] [Google Scholar]
- Huxley A.F. 1971. The Croonian Lecture 1967. The activation of striated muscle and its mechanical response. Proc. R. Soc. Lond. B Biol. Sci. 178:1–27. 10.1098/rspb.1971.0049 [DOI] [PubMed] [Google Scholar]
- Huxley H.E. 1964. Evidence for continuity between the central elements of the triads and the extracellular space in frog sartorius muscle. Nature. 202:1067–1071. 10.1038/2021067b0 [DOI] [PubMed] [Google Scholar]
- Huxley A.F., and Niedergerke R.. 1958. Measurement of the striations of isolated muscle fibres with the interference microscope. J. Physiol. 144:403–425. 10.1113/jphysiol.1958.sp006110 [DOI] [PMC free article] [PubMed] [Google Scholar]
- Huxley A.F., and Taylor R.E.. 1958. Local activation of striated muscle fibres. J. Physiol. 144:426–441. 10.1113/jphysiol.1958.sp006111 [DOI] [PMC free article] [PubMed] [Google Scholar]
- Inesi G., and Sagara Y.. 1994. Specific inhibitors of intracellular Ca2+ transport ATPases. J. Membr. Biol. 141:1–6. 10.1007/BF00232868 [DOI] [PubMed] [Google Scholar]
- Inesi G., Wade R., and Rogers T.. 1998. The sarcoplasmic reticulum Ca2+ pump: inhibition by thapsigargin and enhancement by adenovirus-mediated gene transfer. Ann. N. Y. Acad. Sci. 853(1 CARDIAC SARCO):195–206. 10.1111/j.1749-6632.1998.tb08267.x [DOI] [PubMed] [Google Scholar]
- Inesi G., Ma H., Lewis D., and Xu C.. 2004. Ca2+ occlusion and gating function of Glu309 in the ADP-fluoroaluminate analog of the Ca2+-ATPase phosphoenzyme intermediate. J. Biol. Chem. 279:31629–31637. 10.1074/jbc.M403211200 [DOI] [PubMed] [Google Scholar]
- Inui M., Saito A., and Fleischer S.. 1987. Isolation of the ryanodine receptor from cardiac sarcoplasmic reticulum and identity with the feet structures. J. Biol. Chem. 262:15637–15642. [PubMed] [Google Scholar]
- Ivanenko A., McKemy D.D., Kenyon J.L., Airey J.A., and Sutko J.L.. 1995. Embryonic chicken skeletal muscle cells fail to develop normal excitation-contraction coupling in the absence of the alpha ryanodine receptor. Implications for a two-ryanodine receptor system. J. Biol. Chem. 270:4220–4223. 10.1074/jbc.270.9.4220 [DOI] [PubMed] [Google Scholar]
- Jacquemond V., Csernoch L., Klein M.G., and Schneider M.F.. 1991. Voltage-gated and calcium-gated calcium release during depolarization of skeletal muscle fibers. Biophys. J. 60:867–873. 10.1016/S0006-3495(91)82120-8 [DOI] [PMC free article] [PubMed] [Google Scholar]
- Jayasinghe I.D., and Launikonis B.S.. 2013. Three-dimensional reconstruction and analysis of the tubular system of vertebrate skeletal muscle. J. Cell Sci. 126:4048–4058. 10.1242/jcs.131565 [DOI] [PubMed] [Google Scholar]
- Jayasinghe I.D., Baddeley D., Kong C.H., Wehrens X.H., Cannell M.B., and Soeller C.. 2012. Nanoscale organization of junctophilin-2 and ryanodine receptors within peripheral couplings of rat ventricular cardiomyocytes. Biophys. J. 102:L19–L21. 10.1016/j.bpj.2012.01.034 [DOI] [PMC free article] [PubMed] [Google Scholar]
- Jayasinghe I.D., Munro M., Baddeley D., Launikonis B.S., and Soeller C.. 2014. Observation of the molecular organization of calcium release sites in fast- and slow-twitch skeletal muscle with nanoscale imaging. J. R. Soc. Interface. 11:20140570 10.1098/rsif.2014.0570 [DOI] [PMC free article] [PubMed] [Google Scholar]
- Jewell B.R., and Blinks J.R.. 1968. Drugs and the mechanical properties of heart muscle. Annu. Rev. Pharmacol. 8:113–130. 10.1146/annurev.pa.08.040168.000553 [DOI] [PubMed] [Google Scholar]
- Jones L.R., Zhang L., Sanborn K., Jorgensen A.O., and Kelley J.. 1995. Purification, primary structure, and immunological characterization of the 26-kDa calsequestrin binding protein (junctin) from cardiac junctional sarcoplasmic reticulum. J. Biol. Chem. 270:30787–30796. 10.1074/jbc.270.51.30787 [DOI] [PubMed] [Google Scholar]
- Jong D.S., Pape P.C., Baylor S.M., and Chandler W.K.. 1995a Calcium inactivation of calcium release in frog cut muscle fibers that contain millimolar EGTA or Fura-2. J. Gen. Physiol. 106:337–388. 10.1085/jgp.106.2.337 [DOI] [PMC free article] [PubMed] [Google Scholar]
- Jong D.S., Pape P.C., and Chandler W.K.. 1995b Effect of sarcoplasmic reticulum calcium depletion on intramembranous charge movement in frog cut muscle fibers. J. Gen. Physiol. 106:659–704. 10.1085/jgp.106.4.659 [DOI] [PMC free article] [PubMed] [Google Scholar]
- Jorgensen A.O., Shen A.C., Campbell K.P., and MacLennan D.H.. 1983. Ultrastructural localization of calsequestrin in rat skeletal muscle by immunoferritin labeling of ultrathin frozen sections. J. Cell Biol. 97:1573–1581. 10.1083/jcb.97.5.1573 [DOI] [PMC free article] [PubMed] [Google Scholar]
- Knudson C.M., Chaudhari N., Sharp A.H., Powell J.A., Beam K.G., and Campbell K.P.. 1989. Specific absence of the alpha 1 subunit of the dihydropyridine receptor in mice with muscular dysgenesis. J. Biol. Chem. 264:1345–1348. [PubMed] [Google Scholar]
- Konishi M., Olson A., Hollingworth S., and Baylor S.M.. 1988. Myoplasmic binding of fura-2 investigated by steady-state fluorescence and absorbance measurements. Biophys. J. 54:1089–1104. 10.1016/S0006-3495(88)83045-5 [DOI] [PMC free article] [PubMed] [Google Scholar]
- Konishi M., Hollingworth S., Harkins A.B., and Baylor S.M.. 1991. Myoplasmic calcium transients in intact frog skeletal muscle fibers monitored with the fluorescent indicator furaptra. J. Gen. Physiol. 97:271–301. 10.1085/jgp.97.2.271 [DOI] [PMC free article] [PubMed] [Google Scholar]
- Kovács L., Ríos E., and Schneider M.F.. 1979. Calcium transients and intramembrane charge movement in skeletal muscle fibres. Nature. 279:391–396. 10.1038/279391a0 [DOI] [PubMed] [Google Scholar]
- Kuffler S.W. 1947. Membrane changes during excitation and inhibition of the contractile mechanism. Ann. N. Y. Acad. Sci. 47:767–782. 10.1111/j.1749-6632.1947.tb31735.x [DOI] [PubMed] [Google Scholar]
- Kuffler S.W., and Vaughan Williams E.M.. 1953. Properties of the ‘slow’ skeletal muscles fibres of the frog. J. Physiol. 121:318–340. 10.1113/jphysiol.1953.sp004949 [DOI] [PMC free article] [PubMed] [Google Scholar]
- Lai F.A., Erickson H., Block B.A., and Meissner G.. 1987. Evidence for a junctional feet-ryanodine receptor complex from sarcoplasmic reticulum. Biochem. Biophys. Res. Commun. 143:704–709. 10.1016/0006-291X(87)91411-2 [DOI] [PubMed] [Google Scholar]
- Lamb G.D. 1986. Components of charge movement in rabbit skeletal muscle: the effect of tetracaine and nifedipine. J. Physiol. 376:85–100. 10.1113/jphysiol.1986.sp016143 [DOI] [PMC free article] [PubMed] [Google Scholar]
- Lamboley C.R., Murphy R.M., McKenna M.J., and Lamb G.D.. 2014. Sarcoplasmic reticulum Ca2+ uptake and leak properties, and SERCA isoform expression, in type I and type II fibres of human skeletal muscle. J. Physiol. 592:1381–1395. 10.1113/jphysiol.2013.269373 [DOI] [PMC free article] [PubMed] [Google Scholar]
- Legrand C., Giacomello E., Berthier C., Allard B., Sorrentino V., and Jacquemond V.. 2008. Spontaneous and voltage-activated Ca2+ release in adult mouse skeletal muscle fibres expressing the type 3 ryanodine receptor. J. Physiol. 586:441–457. 10.1113/jphysiol.2007.145862 [DOI] [PMC free article] [PubMed] [Google Scholar]
- Lewis M.K., Nahirney P.C., Chen V., Adhikari B.B., Wright J., Reedy M.K., Bass A.H., and Wang K.. 2003. Concentric intermediate filament lattice links to specialized Z–band junctional complexes in sonic muscle fibers of the type I male midshipman fish. J. Struct. Biol. 143:56–71. 10.1016/S1047-8477(03)00121-7 [DOI] [PubMed] [Google Scholar]
- Linsley J.W., Hsu I.-U., Groom L., Yarotskyy V., Lavorato M., Horstick E.J., Linsley D., Wang W., Franzini-Armstrong C., Dirksen R.T., and Kuwada J.Y.. 2017. Congenital myopathy results from misregulation of a muscle Ca2+ channel by mutant Stac3. Proc. Natl. Acad. Sci. USA. 114:E228–E236. 10.1073/pnas.1619238114 [DOI] [PMC free article] [PubMed] [Google Scholar]
- López J.R., Contreras J., Linares N., and Allen P.D.. 2000. Hypersensitivity of malignant hyperthermia-susceptible swine skeletal muscle to caffeine is mediated by high resting myoplasmic [Ca2+]. Anesthesiology. 92:1799–1806. 10.1097/00000542-200006000-00040 [DOI] [PubMed] [Google Scholar]
- MacLennan D.H. 1970. Purification and properties of an adenosine triphosphatase from sarcoplasmic reticulum. J. Biol. Chem. 245:4508–4518. [PubMed] [Google Scholar]
- MacLennan D.H., and Wong P.T.. 1971. Isolation of a calcium-sequestering protein from sarcoplasmic reticulum. Proc. Natl. Acad. Sci. USA. 68:1231–1235. 10.1073/pnas.68.6.1231 [DOI] [PMC free article] [PubMed] [Google Scholar]
- MacLennan D.H., Brandl C.J., Korczak B., and Green N.M.. 1985. Amino-acid sequence of a Ca2+ + Mg2+-dependent ATPase from rabbit muscle sarcoplasmic reticulum, deduced from its complementary DNA sequence. Nature. 316:696–700. 10.1038/316696a0 [DOI] [PubMed] [Google Scholar]
- Marty I. 2015. Triadin regulation of the ryanodine receptor complex. J. Physiol. 593:3261–3266. 10.1113/jphysiol.2014.281147 [DOI] [PMC free article] [PubMed] [Google Scholar]
- Marty I., Fauré J., Fourest-Lieuvin A., Vassilopoulos S., Oddoux S., and Brocard J.. 2009. Triadin: what possible function 20 years later? J. Physiol. 587:3117–3121. 10.1113/jphysiol.2009.171892 [DOI] [PMC free article] [PubMed] [Google Scholar]
- Mathias R.T., Levis R.A., and Eisenberg R.S.. 1980. Electrical models of excitation-contraction coupling and charge movement in skeletal muscle. J. Gen. Physiol. 76:1–31. 10.1085/jgp.76.1.1 [DOI] [PMC free article] [PubMed] [Google Scholar]
- Maylie J., Irving M., Sizto N.L., and Chandler W.K.. 1987. Calcium signals recorded from cut frog twitch fibers containing antipyrylazo III. J. Gen. Physiol. 89:83–143. 10.1085/jgp.89.1.83 [DOI] [PMC free article] [PubMed] [Google Scholar]
- Meissner G. 1975. Isolation and characterization of two types of sarcoplasmic reticulum vesicles. Biochim. Biophys. Acta. 389:51–68. 10.1016/0005-2736(75)90385-5 [DOI] [PubMed] [Google Scholar]
- Meissner G. 2017. The structural basis of ryanodine receptor ion channel function. J. Gen. Physiol. 149:1065–1089. 10.1085/jgp.201711878 [DOI] [PMC free article] [PubMed] [Google Scholar]
- Meissner G., and McKinley D.. 1982. Permeability of canine cardiac sarcoplasmic reticulum vesicles to K+, Na+, H+, and Cl-. J. Biol. Chem. 257:7704–7711. [PubMed] [Google Scholar]
- Melzer W., Rios E., and Schneider M.F.. 1984. Time course of calcium release and removal in skeletal muscle fibers. Biophys. J. 45:637–641. 10.1016/S0006-3495(84)84203-4 [DOI] [PMC free article] [PubMed] [Google Scholar]
- Miledi R., Parker I., and Schalow G.. 1977. Measurement of calcium transients in frog muscle by the use of arsenazo III. Proc. R. Soc. Lond. B Biol. Sci. 198:201–210. 10.1098/rspb.1977.0094 [DOI] [PubMed] [Google Scholar]
- Mitchell R.D., Palade P., Saito A., and Fleischer S.. 1988. Isolation of triads from skeletal muscle. Methods Enzymol. 157:51–68. 10.1016/0076-6879(88)57068-4 [DOI] [PubMed] [Google Scholar]
- Mobley B.A., and Eisenberg B.R.. 1975. Sizes of components in frog skeletal muscle measured by methods of stereology. J. Gen. Physiol. 66:31–45. 10.1085/jgp.66.1.31 [DOI] [PMC free article] [PubMed] [Google Scholar]
- Moore R.A., Nguyen H., Galceran J., Pessah I.N., and Allen P.D.. 1998. A transgenic myogenic cell line lacking ryanodine receptor protein for homologous expression studies: reconstitution of Ry1R protein and function. J. Cell Biol. 140:843–851. 10.1083/jcb.140.4.843 [DOI] [PMC free article] [PubMed] [Google Scholar]
- Motoike H.K., Caswell A.H., Smilowitz H.M., and Brandt N.R.. 1994. Extraction of junctional complexes from triad junctions of rabbit skeletal muscle. J. Muscle Res. Cell Motil. 15:493–504. 10.1007/BF00121156 [DOI] [PubMed] [Google Scholar]
- Murphy R.M., Larkins N.T., Mollica J.P., Beard N.A., and Lamb G.D.. 2009. Calsequestrin content and SERCA determine normal and maximal Ca2+ storage levels in sarcoplasmic reticulum of fast- and slow-twitch fibres of rat. J. Physiol. 587:443–460. 10.1113/jphysiol.2008.163162 [DOI] [PMC free article] [PubMed] [Google Scholar]
- Muscatello U., Andersson-Cedergren E., and Azzone G.F.. 1961. The sarcotubular system of frog skeletal muscle. A morphological and biochemical study. J. Biophys. Biochem. Cytol. 10:201–218. 10.1083/jcb.10.4.201 [DOI] [PMC free article] [PubMed] [Google Scholar]
- Nakai J., Dirksen R.T., Nguyen H.T., Pessah I.N., Beam K.G., and Allen P.D.. 1996. Enhanced dihydropyridine receptor channel activity in the presence of ryanodine receptor. Nature. 380:72–75. 10.1038/380072a0 [DOI] [PubMed] [Google Scholar]
- Natori R. 1954. The property and contraction process of isolated myofibrils. Jikeikai Med. J. 1:119–126. [Google Scholar]
- Nelson D.A., and Benson E.S.. 1963. On the structural continuities of the transverse tubular system of rabbit and human myocardial cells. J. Cell Biol. 16:297–313. 10.1083/jcb.16.2.297 [DOI] [PMC free article] [PubMed] [Google Scholar]
- Niedergerke R. 1955. Local muscular shortening by intracellular applied calcium. J. Physiol. 128:12P–13P. [Google Scholar]
- Olojo R.O., Ziman A.P., Hernández-Ochoa E.O., Allen P.D., Schneider M.F., and Ward C.W.. 2011. Mice null for calsequestrin 1 exhibit deficits in functional performance and sarcoplasmic reticulum calcium handling. PLoS One. 6:e27036 10.1371/journal.pone.0027036 [DOI] [PMC free article] [PubMed] [Google Scholar]
- Page S. 1964. The organization of the sarcoplasmic reticulum in frog muscle. J. Physiol. 175:10P–11P. [Google Scholar]
- Page S.G. 1965. A comparison of the fine structures of frog slow and twitch muscle fibers. J. Cell Biol. 26:477–497. 10.1083/jcb.26.2.477 [DOI] [PMC free article] [PubMed] [Google Scholar]
- Page S.G. 1968. Fine structure of tortoise skeletal muscle. J. Physiol. 197:709–715. 10.1113/jphysiol.1968.sp008583 [DOI] [PMC free article] [PubMed] [Google Scholar]
- Page S.G. 1969. Structure and some contractile properties of fast and slow muscles of the chicken. J. Physiol. 205:131–145. 10.1113/jphysiol.1969.sp008956 [DOI] [PMC free article] [PubMed] [Google Scholar]
- Palade P., Saito A., Mitchell R.D., and Fleischer S.. 1983. Preparation of representative samples of subcellular fractions for electron microscopy by filtration with dextran. J. Histochem. Cytochem. 31:971–974. 10.1177/31.7.6189886 [DOI] [PubMed] [Google Scholar]
- Paolini C., Fessenden J.D., Pessah I.N., and Franzini-Armstrong C.. 2004. Evidence for conformational coupling between two calcium channels. Proc. Natl. Acad. Sci. USA. 101:12748–12752. 10.1073/pnas.0404836101 [DOI] [PMC free article] [PubMed] [Google Scholar]
- Paolini C., Quarta M., Nori A., Boncompagni S., Canato M., Volpe P., Allen P.D., Reggiani C., and Protasi F.. 2007. Reorganized stores and impaired calcium handling in skeletal muscle of mice lacking calsequestrin-1. J. Physiol. 583:767–784. 10.1113/jphysiol.2007.138024 [DOI] [PMC free article] [PubMed] [Google Scholar]
- Park H., Wu S., Dunker A.K., and Kang C.. 2003. Polymerization of calsequestrin. Implications for Ca2+ regulation. J. Biol. Chem. 278:16176–16182. 10.1074/jbc.M300120200 [DOI] [PubMed] [Google Scholar]
- Peachey L.D. 1965. The sarcoplasmic reticulum and transverse tubules of the frog’s sartorius. J. Cell Biol. 25:209–231. 10.1083/jcb.25.3.209 [DOI] [PubMed] [Google Scholar]
- Peachey L.D., and Eisenberg B.R.. 1978. Helicoids in the T system and striations of frog skeletal muscle fibers seen by high voltage electron microscopy. Biophys. J. 22:145–154. 10.1016/S0006-3495(78)85480-0 [DOI] [PMC free article] [PubMed] [Google Scholar]
- Peachey L.D., and Huxley A.F.. 1962. Structural identification of twitch and slow striated muscle fibers of the frog. J. Cell Biol. 13:177–180. 10.1083/jcb.13.1.177 [DOI] [PMC free article] [PubMed] [Google Scholar]
- Peachey L.D., and Schild R.F.. 1968. The distribution of the T-system along the sarcomeres of frog and toad sartorius muscles. J. Physiol. 194:249–258. 10.1113/jphysiol.1968.sp008405 [DOI] [PMC free article] [PubMed] [Google Scholar]
- Peng M., Fan H., Kirley T.L., Caswell A.H., and Schwartz A.. 1994. Structural diversity of triadin in skeletal muscle and evidence of its existence in heart. FEBS Lett. 348:17–20. 10.1016/0014-5793(94)00556-7 [DOI] [PubMed] [Google Scholar]
- Perni S., Close M., and Franzini-Armstrong C.. 2013. Novel details of calsequestrin gel conformation in situ. J. Biol. Chem. 288:31358–31362. 10.1074/jbc.M113.507749 [DOI] [PMC free article] [PubMed] [Google Scholar]
- Perni S., Marsden K.C., Escobar M., Hollingworth S., Baylor S.M., and Franzini-Armstrong C.. 2015. Structural and functional properties of ryanodine receptor type 3 in zebrafish tail muscle. J. Gen. Physiol. 145:173–184. 10.1085/jgp.201411303 [DOI] [PMC free article] [PubMed] [Google Scholar]
- Pette D., and Staron R.S.. 2000. Myosin isoforms, muscle fiber types, and transitions. Microsc. Res. Tech. 50:500–509. [DOI] [PubMed] [Google Scholar]
- Pette D., Peuker H., and Staron R.S.. 1999. The impact of biochemical methods for single muscle fibre analysis. Acta Physiol. Scand. 166:261–277. 10.1046/j.1365-201x.1999.00573.x [DOI] [PubMed] [Google Scholar]
- Pizarro G., Csernoch L., Uribe I., and Ríos E.. 1992. Differential effects of tetracaine on two kinetic components of calcium release in frog skeletal muscle fibres. J. Physiol. 457:525–538. 10.1113/jphysiol.1992.sp019392 [DOI] [PMC free article] [PubMed] [Google Scholar]
- Podolsky R.J., and Costantin L.L.. 1964. Regulation by calcium of the contraction and relaxation of muscle fibers. Fed. Proc. 23:933–939. [PubMed] [Google Scholar]
- Polster A., Perni S., Bichraoui H., and Beam K.G.. 2015. Stac adaptor proteins regulate trafficking and function of muscle and neuronal L-type Ca2+ channels. Proc. Natl. Acad. Sci. USA. 112:602–606. 10.1073/pnas.1423113112 [DOI] [PMC free article] [PubMed] [Google Scholar]
- Porter K.R., and Palade G.E.. 1957. Studies on the endoplasmic reticulum. III. Its form and distribution in striated muscle cells. J. Biophys. Biochem. Cytol. 3:269–300. 10.1083/jcb.3.2.269 [DOI] [PMC free article] [PubMed] [Google Scholar]
- Pouvreau S., Royer L., Yi J., Brum G., Meissner G., Ríos E., and Zhou J.. 2007. Ca(2+) sparks operated by membrane depolarization require isoform 3 ryanodine receptor channels in skeletal muscle. Proc. Natl. Acad. Sci. USA. 104:5235–5240. 10.1073/pnas.0700748104 [DOI] [PMC free article] [PubMed] [Google Scholar]
- Pringle J.W. 1949. The excitation and contraction of the flight muscles of insects. J. Physiol. 108:226–232. 10.1113/jphysiol.1949.sp004326 [DOI] [PMC free article] [PubMed] [Google Scholar]
- Prosser B.L., Hernández-Ochoa E.O., Zimmer D.B., and Schneider M.F.. 2009. The Qgamma component of intra-membrane charge movement is present in mammalian muscle fibres, but suppressed in the absence of S100A1. J. Physiol. 587:4523–4541. 10.1113/jphysiol.2009.177238 [DOI] [PMC free article] [PubMed] [Google Scholar]
- Protasi F., Paolini C., Canato M., Reggiani C., and Quarta M.. 2011. Lessons from calsequestrin-1 ablation in vivo: much more than a Ca(2+) buffer after all. J. Muscle Res. Cell Motil. 32:257–270. 10.1007/s10974-011-9277-2 [DOI] [PubMed] [Google Scholar]
- Revel J.P. 1962. The sarcoplasmic reticulum of the bat cricothroid muscle. J. Cell Biol. 12:571–588. 10.1083/jcb.12.3.571 [DOI] [PMC free article] [PubMed] [Google Scholar]
- Ridgway E.B., and Ashley C.C.. 1967. Calcium transients in single muscle fibers. Biochem. Biophys. Res. Commun. 29:229–234. 10.1016/0006-291X(67)90592-X [DOI] [PubMed] [Google Scholar]
- Rios E., and Brum G.. 1987. Involvement of dihydropyridine receptors in excitation-contraction coupling in skeletal muscle. Nature. 325:717–720. 10.1038/325717a0 [DOI] [PubMed] [Google Scholar]
- Rios E., and Pizarro G.. 1988. Sensors and calcium channels of excitation-contraction coupling. Physiology (Bethesda). 3:223–224. [Google Scholar]
- Ríos E., and Györke S.. 2009. Calsequestrin, triadin and more: the molecules that modulate calcium release in cardiac and skeletal muscle. J. Physiol. 587:3069–3070. 10.1113/jphysiol.2009.175083 [DOI] [PMC free article] [PubMed] [Google Scholar]
- Rizzuto R., and Pozzan T.. 2006. Microdomains of intracellular Ca2+: molecular determinants and functional consequences. Physiol. Rev. 86:369–408. 10.1152/physrev.00004.2005 [DOI] [PubMed] [Google Scholar]
- Rizzuto R., Simpson A.W., Brini M., and Pozzan T.. 1992. Rapid changes of mitochondrial Ca2+ revealed by specifically targeted recombinant aequorin. Nature. 358:325–327. 10.1038/358325a0 [DOI] [PubMed] [Google Scholar]
- Robertson J.D. 1956. Some features of the ultrastructure of reptilian skeletal muscle. J. Biophys. Biochem. Cytol. 2:369–380. 10.1083/jcb.2.4.369 [DOI] [PubMed] [Google Scholar]
- Rome L.C., Syme D.A., Hollingworth S., Lindstedt S.L., and Baylor S.M.. 1996. The whistle and the rattle: the design of sound producing muscles. Proc. Natl. Acad. Sci. USA. 93:8095–8100. 10.1073/pnas.93.15.8095 [DOI] [PMC free article] [PubMed] [Google Scholar]
- Rosemblatt M., Hidalgo C., Vergara C., and Ikemoto N.. 1981. Immunological and biochemical properties of transverse tubule membranes isolated from rabbit skeletal muscle. J. Biol. Chem. 256:8140–8148. [PubMed] [Google Scholar]
- Rossi D., Bencini C., Maritati M., Benini F., Lorenzini S., Pierantozzi E., Scarcella A.M., Paolini C., Protasi F., and Sorrentino V.. 2014. Distinct regions of triadin are required for targeting and retention at the junctional domain of the sarcoplasmic reticulum. Biochem. J. 458:407–417. 10.1042/BJ20130719 [DOI] [PubMed] [Google Scholar]
- Royer L., Sztretye M., Manno C., Pouvreau S., Zhou J., Knollmann B.C., Protasi F., Allen P.D., and Ríos E.. 2010. Paradoxical buffering of calcium by calsequestrin demonstrated for the calcium store of skeletal muscle. J. Gen. Physiol. 136:325–338. 10.1085/jgp.201010454 [DOI] [PMC free article] [PubMed] [Google Scholar]
- Sanchez E.J., Lewis K.M., Danna B.R., and Kang C.. 2012. High-capacity Ca2+ binding of human skeletal calsequestrin. J. Biol. Chem. 287:11592–11601. 10.1074/jbc.M111.335075 [DOI] [PMC free article] [PubMed] [Google Scholar]
- Sandow A. 1952. Excitation-contraction coupling in muscular response. Yale J. Biol. Med. 25:176–201. [PMC free article] [PubMed] [Google Scholar]
- Scales D., and Inesi G.. 1976. Assembly of ATPase protein in sarcoplasmic reticulum membranes. Biophys. J. 16:735–751. 10.1016/S0006-3495(76)85725-6 [DOI] [PMC free article] [PubMed] [Google Scholar]
- Schaeffer P., Conley K., and Lindstedt S.. 1996. Structural correlates of speed and endurance in skeletal muscle: the rattlesnake tailshaker muscle. J. Exp. Biol. 199:351–358. [DOI] [PubMed] [Google Scholar]
- Schneider M.F., and Chandler W.K.. 1973. Voltage dependent charge movement of skeletal muscle: a possible step in excitation-contraction coupling. Nature. 242:244–246. 10.1038/242244a0 [DOI] [PubMed] [Google Scholar]
- Schneider M.F., and Simon B.J.. 1988. Inactivation of calcium release from the sarcoplasmic reticulum in frog skeletal muscle. J. Physiol. 405:727–745. 10.1113/jphysiol.1988.sp017358 [DOI] [PMC free article] [PubMed] [Google Scholar]
- Schredelseker J., Shrivastav M., Dayal A., and Grabner M.. 2010. Non-Ca2+-conducting Ca2+ channels in fish skeletal muscle excitation-contraction coupling. Proc. Natl. Acad. Sci. USA. 107:5658–5663. 10.1073/pnas.0912153107 [DOI] [PMC free article] [PubMed] [Google Scholar]
- Sheridan D.C., Takekura H., Franzini-Armstrong C., Beam K.G., Allen P.D., and Perez C.F.. 2006. Bidirectional signaling between calcium channels of skeletal muscle requires multiple direct and indirect interactions. Proc. Natl. Acad. Sci. USA. 103:19760–19765. 10.1073/pnas.0609473103 [DOI] [PMC free article] [PubMed] [Google Scholar]
- Shimomura O., Johnson F.H., and Saiga Y.. 1962. Extraction, purification and properties of aequorin, a bioluminescent protein from the luminous hydromedusan, Aequorea. J. Cell. Comp. Physiol. 59:223–239. 10.1002/jcp.1030590302 [DOI] [PubMed] [Google Scholar]
- Shirokova N., García J., Pizarro G., and Ríos E.. 1996. Ca2+ release from the sarcoplasmic reticulum compared in amphibian and mammalian skeletal muscle. J. Gen. Physiol. 107:1–18. 10.1085/jgp.107.1.1 [DOI] [PMC free article] [PubMed] [Google Scholar]
- Shirokova N., García J., and Ríos E.. 1998. Local calcium release in mammalian skeletal muscle. J. Physiol. 512:377–384. 10.1111/j.1469-7793.1998.377be.x [DOI] [PMC free article] [PubMed] [Google Scholar]
- Simon B.J., and Beam K.G.. 1985. The influence of transverse tubular delays on the kinetics of charge movement in mammalian skeletal muscle. J. Gen. Physiol. 85:21–42. 10.1085/jgp.85.1.21 [DOI] [PMC free article] [PubMed] [Google Scholar]
- Simpson F.O., and Oertelis S.J.. 1962. The fine structure of sheep myocardial cells; sarcolemmal invaginations and the transverse tubular system. J. Cell Biol. 12:91–100. 10.1083/jcb.12.1.91 [DOI] [PMC free article] [PubMed] [Google Scholar]
- Sleiman N.H., McFarland T.P., Jones L.R., and Cala S.E.. 2015. Transitions of protein traffic from cardiac ER to junctional SR. J. Mol. Cell. Cardiol. 81:34–45. 10.1016/j.yjmcc.2014.12.025 [DOI] [PMC free article] [PubMed] [Google Scholar]
- Smith D.S. 1961a The organization of the flight muscle in a dragonfly, Aeshna sp. (Odonata). J. Biophys. Biochem. Cytol. 11:119–145. 10.1083/jcb.11.1.119 [DOI] [PMC free article] [PubMed] [Google Scholar]
- Smith D.S. 1961b The structure of insect fibrillar fight muscle. A study made with special references to the membrane systems of the fiber. J. Biophys. Biochem. Cytol. 10:123–158. 10.1083/jcb.10.4.123 [DOI] [PMC free article] [PubMed] [Google Scholar]
- Somlyo A.V. 1979. Bridging structures spanning the junctioning gap at the triad of skeletal muscle. J. Cell Biol. 80:743–750. 10.1083/jcb.80.3.743 [DOI] [PMC free article] [PubMed] [Google Scholar]
- Somlyo A.V., and Franzini-Armstrong C.. 1985. New views of smooth muscle structure using freezing, deep-etching and rotary shadowing. Experientia. 41:841–856. 10.1007/BF01970000 [DOI] [PubMed] [Google Scholar]
- Somlyo A.P., and Somlyo A.V.. 1986. Electron probe analysis of calcium content and movements in sarcoplasmic reticulum, endoplasmic reticulum, mitochondria, and cytoplasm. J. Cardiovasc. Pharmacol. 8(Suppl 8):S42–S47. 10.1097/00005344-198600088-00009 [DOI] [PubMed] [Google Scholar]
- Somlyo A.V., Shuman H., and Somlyo A.P.. 1977. Composition of sarcoplasmic reticulum in situ by electron probe X-ray microanalysis. Nature. 268:556–558. 10.1038/268556a0 [DOI] [PubMed] [Google Scholar]
- Stern M.D., Pizarro G., and Ríos E.. 1997. Local control model of excitation-contraction coupling in skeletal muscle. J. Gen. Physiol. 110:415–440. 10.1085/jgp.110.4.415 [DOI] [PMC free article] [PubMed] [Google Scholar]
- Sztretye M., Yi J., Figueroa L., Zhou J., Royer L., Allen P., Brum G., and Ríos E.. 2011. Measurement of RyR permeability reveals a role of calsequestrin in termination of SR Ca2+ release in skeletal muscle. J. Gen. Physiol. 138:231–247. 10.1085/jgp.201010592 [DOI] [PMC free article] [PubMed] [Google Scholar]
- Tadini-Buoninsegni F., Bartolommei G., Moncelli M.R., Guidelli R., and Inesi G.. 2006. Pre-steady state electrogenic events of Ca2+/H+ exchange and transport by the Ca2+-ATPase. J. Biol. Chem. 281:37720–37727. 10.1074/jbc.M606040200 [DOI] [PubMed] [Google Scholar]
- Takekura H., Bennett L., Tanabe T., Beam K.G., and Franzini-Armstrong C.. 1994. Restoration of junctional tetrads in dysgenic myotubes by dihydropyridine receptor cDNA. Biophys. J. 67:793–803. 10.1016/S0006-3495(94)80539-9 [DOI] [PMC free article] [PubMed] [Google Scholar]
- Takekura H., Nishi M., Noda T., Takeshima H., and Franzini-Armstrong C.. 1995. Abnormal junctions between surface membrane and sarcoplasmic reticulum in skeletal muscle with a mutation targeted to the ryanodine receptor. Proc. Natl. Acad. Sci. USA. 92:3381–3385. 10.1073/pnas.92.8.3381 [DOI] [PMC free article] [PubMed] [Google Scholar]
- Takeshima H., Iino M., Takekura H., Nishi M., Kuno J., Minowa O., Takano H., and Noda T.. 1994. Excitation-contraction uncoupling and muscular degeneration in mice lacking functional skeletal muscle ryanodine-receptor gene. Nature. 369:556–559. 10.1038/369556a0 [DOI] [PubMed] [Google Scholar]
- Takeshima H., Komazaki S., Nishi M., Iino M., and Kangawa K.. 2000. Junctophilins: a novel family of junctional membrane complex proteins. Mol. Cell. 6:11–22. [DOI] [PubMed] [Google Scholar]
- Taylor K.A., Dux L., and Martonosi A.. 1986. Three-dimensional reconstruction of negatively stained crystals of the Ca2+-ATPase from muscle sarcoplasmic reticulum. J. Mol. Biol. 187:417–427. 10.1016/0022-2836(86)90442-0 [DOI] [PubMed] [Google Scholar]
- Tijskens P., Jones L.R., and Franzini-Armstrong C.. 2003. Junctin and calsequestrin overexpression in cardiac muscle: the role of junctin and the synthetic and delivery pathways for the two proteins. J. Mol. Cell. Cardiol. 35:961–974. 10.1016/S0022-2828(03)00181-0 [DOI] [PubMed] [Google Scholar]
- Tomasi M., Canato M., Paolini C., Dainese M., Reggiani C., Volpe P., Protasi F., and Nori A.. 2012. Calsequestrin (CASQ1) rescues function and structure of calcium release units in skeletal muscles of CASQ1-null mice. Am. J. Physiol. Cell Physiol. 302:C575–C586. 10.1152/ajpcell.00119.2011 [DOI] [PubMed] [Google Scholar]
- Toyoshima C. 2008. Structural aspects of ion pumping by Ca2+-ATPase of sarcoplasmic reticulum. Arch. Biochem. Biophys. 476:3–11. 10.1016/j.abb.2008.04.017 [DOI] [PubMed] [Google Scholar]
- Toyoshima C. 2009. Veratti, E., 1902. Investigazioni sulla fine struttura della fibra muscolare striata. Mem. R. Inst. Lomb. Scienze Lett. 19:87–131. [Google Scholar]
- Toyoshima C., Sasabe H., and Stokes D.L.. 1993. Three-dimensional cryo-electron microscopy of the calcium ion pump in the sarcoplasmic reticulum membrane. Nature. 362:469–471. 10.1038/362469a0 [DOI] [PubMed] [Google Scholar]
- Veratti E. 1961. Investigations on the fine structure of striated muscle fiber read before the Reale Istituto Lombardo, 13 March 1902. J. Biophys. Biochem. Cytol. 10(Suppl 4):1–59. 10.1083/jcb.10.4.1 [DOI] [PMC free article] [PubMed] [Google Scholar]
- Walker S.M., and Schrodt G.R.. 1965. Continuity of the T system with the sarcolemma in rat skeletal muscle fibers. J. Cell Biol. 27:671–677. 10.1083/jcb.27.3.671 [DOI] [PMC free article] [PubMed] [Google Scholar]
- Ward C.W., Schneider M.F., Castillo D., Protasi F., Wang Y., Chen S.R., and Allen P.D.. 2000. Expression of ryanodine receptor RyR3 produces Ca2+ sparks in dyspedic myotubes. J. Physiol. 525:91–103. 10.1111/j.1469-7793.2000.t01-2-00091.x [DOI] [PMC free article] [PubMed] [Google Scholar]
- Weber A. 1959. On the role of calcium in the activity of adenosine 5′-triphosphate hydrolysis by actomyosin. J. Biol. Chem. 234:2764–2769. [PubMed] [Google Scholar]
- Weber A., Herz R., and Reiss I.. 1963. On the mechanism of the relaxing effect of fragmented sarcoplasmic reticulum. J. Gen. Physiol. 46:679–702. 10.1085/jgp.46.4.679 [DOI] [PMC free article] [PubMed] [Google Scholar]
- Yu X., and Inesi G.. 1995. Variable stoichiometric efficiency of Ca2+ and Sr2+ transport by the sarcoplasmic reticulum ATPase. J. Biol. Chem. 270:4361–4367. 10.1074/jbc.270.9.4361 [DOI] [PubMed] [Google Scholar]
- Zhang L., Kelley J., Schmeisser G., Kobayashi Y.M., and Jones L.R.. 1997. Complex formation between junctin, triadin, calsequestrin, and the ryanodine receptor. Proteins of the cardiac junctional sarcoplasmic reticulum membrane. J. Biol. Chem. 272:23389–23397. 10.1074/jbc.272.37.23389 [DOI] [PubMed] [Google Scholar]