Voltage-dependent gating in ion channels is achieved by the movement of voltage-sensing arginine residues across an electric field. Carvalho-de-Souza and Bezanilla reveal that the size and hydrophobicity of two non–voltage-sensing residues (L358 and L361) affect voltage dependence in Shaker K+ channels.
Abstract
Voltage sensitivity in ion channels is a function of highly conserved arginine residues in their voltage-sensing domains (VSDs), but this conservation does not explain the diversity in voltage dependence among different K+ channels. Here we study the non–voltage-sensing residues 353 to 361 in Shaker K+ channels and find that residues 358 and 361 strongly modulate the voltage dependence of the channel. We mutate these two residues into all possible remaining amino acids (AAs) and obtain Q-V and G-V curves. We introduced the nonconducting W434F mutation to record sensing currents in all mutants except L361R, which requires K+ depletion because it is affected by W434F. By fitting Q-Vs with a sequential three-state model for two voltage dependence–related parameters (V0, the voltage-dependent transition from the resting to intermediate state and V1, from the latter to the active state) and G-Vs with a two-state model for the voltage dependence of the pore domain parameter (V1/2), Spearman’s coefficients denoting variable relationships with hydrophobicity, available area, length, width, and volume of the AAs in 358 and 361 positions could be calculated. We find that mutations in residue 358 shift Q-Vs and G-Vs along the voltage axis by affecting V0, V1, and V1/2 according to the hydrophobicity of the AA. Mutations in residue 361 also shift both curves, but V0 is affected by the hydrophobicity of the AA in position 361, whereas V1 and V1/2 are affected by size-related AA indices. Small-to-tiny AAs have opposite effects on V1 and V1/2 in position 358 compared with 361. We hypothesize possible coordination points in the protein that residues 358 and 361 would temporarily and differently interact with in an intermediate state of VSD activation. Our data contribute to the accumulating knowledge of voltage-dependent ion channel activation by adding functional information about the effects of so-called non–voltage-sensing residues on VSD dynamics.
Introduction
Voltage-gated ion channels are the molecular entities responsible for voltage-activated ion-selective conductances in cell membranes. Electrophysiological, biochemical, and structural analysis indicate that voltage-gated K+ channels are tetramers of proteins containing six helical transmembrane (TM) segments. The first four TM segments (S1–S4) constitute a voltage-sensing domain (VSD) and the last two (S5–S6), the pore domain (PD). In a functional channel, four peripheral VSDs confer voltage sensitivity to the open probability of the channels’ pore, formed by a radially symmetric ensemble of four PDs.
The basic mechanism whereby VSDs confer voltage sensitivity to ion channels involves the movement of S4 inside the core of the protein. When the cell membrane is hyperpolarized relative to the extracellular compartment, S4 is pushed inward by the electric field acting on the positively charged conserved residues of arginine in S4 (sensing charges), and this conformation of the VSD corresponds to a very low probability of an open channel. Membrane depolarizations cause S4 to be released and thus to this segment to move outward, which increases the probability of the channel’s PD to be found in the open state. During activation, the sensing charges are temporarily stabilized by negative residues of glutamate and aspartate in S2 and S3 segments that are also conserved.
The S4 movement by itself allows intuitive physical models sufficient to explain the VSD-to-PD mechanical coupling. Upon depolarization, an outward movement of S4 causes a parallel-to-the-membrane movement of the S4-S5 linker that in turn releases S5 and lately S6, the activation gate, to move and open the inner mouth of the channel, allowing K+ to flow down its electrochemical gradient. Nonetheless, the voltage dependence of the channels, defined as the voltage range where S4 movement occurs, cannot be fully explained by the composition and relative position of S4. Virtually all S4-based VSDs display an S4 with conserved arginine residues every third position, and despite that, one can find K+ channels with their PD voltage dependencies, a parameter defined here as the membrane voltage that corresponds to the half-maximal macroscopic K+ conductance, varying from negative values as low as −50 mV in KV4 (Shahidullah and Covarrubias, 2003) to values as positive as +12 mV in KV2 (Shi et al., 1994; Fig. 1 A). Because VSDs are the actual voltage sensors, it is reasonable to expect the disparity between those voltage values are due to amino acids (AAs) in the VSDs but not the ones in S4, given that this region is strongly conserved among K+ channels. In the VSD, the extracellular loop that connects S3 and S4 (S3–S4 linker) has been studied as one of those motifs in the protein that modulates the VSD’s voltage dependence, defined here as the voltage that relates to the movement of half of the sensing charges, in Shaker K+ channels (Shaker). Previous studies, however, were focused mostly on the length of the S3–S4 linker or in its modification as a block but not on its AA primary sequence (Mathur et al., 1997; Gonzalez et al., 2000, 2001; Priest et al., 2013; Elinder et al., 2016). Other studies have investigated single-AA mutations in the S3–S4 linker in Shaker but only in a few residues, leading to limited conclusions (Li-Smerin et al., 2000; Yang et al., 2007). Therefore, a detailed understanding of the contribution of each individual AA in the S3–S4 linker to the voltage dependence of Shaker, as a prototype channel, is needed.
Figure 1.
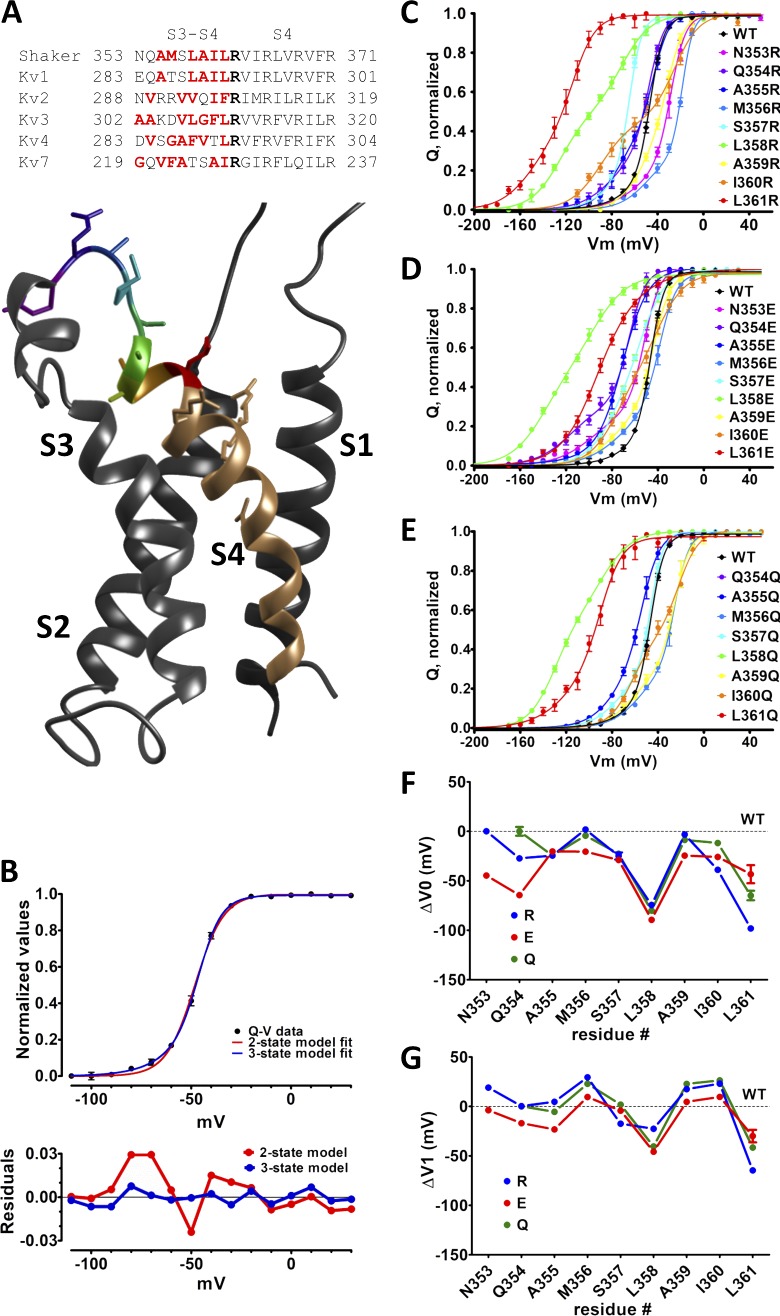
Residues L358 and L361 in nonconducting Shaker modulates the voltage dependence of its VSD. (A) S3–S4 linker and S4 sequences from Shaker and other voltage-dependent K+ channels, aligned by the putative first sensing charge (bold). For better distinction, hydrophilic residues are in red. A side view of KV1.2 (PDB code 3LUT) is shown with the residues 353 to 361 colored individually. (B) WT Shaker Q-V curve fittings with a two- and a three-state model (see Materials and methods for details) for comparison (top) and the respective residuals (bottom) are shown. (C–E) Q-V curves displaying average (symbols) and SEMs (vertical bars) from Shaker mutated with R (in C), E (in D) or Q (in E), separately in each of the nine residues 353–361 in the S3–S4 linker. All continuous lines are the best fit of three-state model (see Materials and methods). The color code in all Q-V curves matches the one used in the structure shown in A. In all plots, vertical bars from the colored symbols representing each data point denote the SEM. (F and G) The fitted parameters V0 and V1 are shown in F and G, respectively.
In this work we studied the nine AAs in the S3–S4 linker’s C terminus, closest to S4, in Shaker (AA residues 353 to 361). We recorded sensing charge movements as sensing (or gating) currents at several voltages to build charge-voltage (Q-V) curves and also K+ conductance activation by several voltages for conductance-voltage (G-V) curves in all mutants, as readouts of VSD and PD voltage dependences, respectively. Our results show that single AA substitutions in residues L358 or L361 can change, sometimes drastically, the VSD voltage dependence (seen in Q-V curve) and consequently the PD voltage dependence (seen in G-V curve). The direction of the change depends on the type of AA used as replacement for the WT leucine in those positions. Impressively, none of those mutations showed any hint of a charge induced effect as found before with a phosphatase-bound S4-based VSD (Villalba-Galea et al., 2013). However, when the voltage dependences measured here in Shaker are correlated to indices of various AA scales, it is clear that mutations in residue 358 change voltage dependences of the channel according to the hydrophobicity of the new AA. On the other hand, changes in the voltage dependence of the channel when residue 361 is mutated correlate mostly with a parameter that denotes the size of the new AA side chain: the available surface area length, width, and volume. Finally, we hypothesize that these mutations are useful tools for studying other S4-based voltage sensors, which show different voltage dependences.
Materials and methods
Mutagenesis and expression in Xenopus oocytes
Shaker zH4 K+ channels were cloned into a pBSTA expression vector, optimized for expression in Xenopus oocytes by β-globin sequences flanking the Shaker-encoding region, proper Kozac sequence, and a poly-A at the 3′ end, just before the linearizing unique restriction site. Shaker cDNA was modified to eliminate fast inactivation of the expressed channel, by a deletion of codons for 41 residues in the N terminus, Δ4–46 (Hoshi et al., 1990). When needed, the channel also carried a background mutation, W434F, intended to accelerate C-type inactivation and thus avoid the K+ current, enabling easy recording of sensing currents (Perozo et al., 1993). Additional mutations were made by PCR (QuikChange; Agilent Technologies) by using mismatch mutagenesis primers (Integrated DNA Technologies). PCR products were used to transform XL-gold cells (Agilent Technologies) and therefore produce a sufficient amount of plasmid containing desired cDNA after purification. All mutant plasmids were sequenced to confirm the presence of intended mutations. Plasmids were linearized by a unique restriction site in the sequence, NotI, and cRNA was then transcribed in vitro from a T7 promoter that enhances Shaker encoding region’s transcription in this expression vector (T7 RNA expression kit; Ambion Invitrogen). Usually 12–24 h after oocyte surgical extraction from adult frogs, in accordance with animal usage protocol 71475 of the University of Chicago Institutional Animal Care and Use Committee, 10–50 ng cRNA was injected into defolliculated oocytes in 50 nl RNase-free water. Before and after being injected, oocytes were sitting in glass Petri dishes containing standard oocyte solution with the following composition: 100 mM NaCl, 5 mM KCl, 2 mM CaCl2, and 10 mM HEPES, pH 7.5, supplemented with 50 µg/ml gentamycin. Injected oocytes were kept for 1–3 d from injection, at 18°C.
Electrophysiology
Sensing and K+ currents were recorded from oocytes by using the cut-open voltage-clamp method (Stefani and Bezanilla, 1998) at room temperature (22°C). The resistance of a voltage-measuring micropipette placed inside the oocyte for the virtual ground feedback was 0.3–0.8 MΩ. Capacitive transient currents were supplied by a dedicated circuit, and the remaining, uncompensated currents plus the linear leak were subtracted online by using the P/N method when possible (Bezanilla and Armstrong, 1977). Current data were filtered online at 10–20 kHz by using a low-pass Bessel filter in the voltage-clamp amplifier (Dagan), digitized at 16-bits and sampled at 50–100 kHz (Innovative integration). Data were stored and analyzed by using in-house software. All sensing current recordings were made with the background mutation W434F, except when indicated. The internal gating current recording solution was 120 mM N-methyl-d-glucamine (NMG) methylsulfonate (MES), 2 mM EGTA, and 10 mM HEPES, pH 7.5, and the external solution contained 120 mM NMG-MES, 2 mM Ca-MES, and 10 mM HEPES, pH 7.5. All Q-V analysis included four to six independent experiments. Q-V curves were fitted with a three-state model as described previously, yielding two VSD voltage-dependent parameters, V0 and V1, and their apparent charges Z0 and Z1, respectively (Lacroix et al., 2012). For ionic current recordings, the internal solution contained 120 mM K-MES, 2 mM EGTA, and 10 mM HEPES, pH 7.5, and the external solution contained 12 mM K-MES, 108 mM NMG-MES, 2 mM Ca-MES, and 10 mM HEPES, pH 7.5. All ionic currents analysis also included four to six independent experiments. G-V curves were obtained by plotting the maximal K+ conductance at each depolarizing voltage step. G-V curves were fitted to a single two-state function, yielding a PD voltage-dependent parameter V1/2, a value that denotes the voltage for half-maximal macroscopic K+ conductance activation. For all experiments a standard holding potential of −80 mV was used, and a conditioning period of time at hyperpolarized voltage (value varied according to the mutant) was used to ensure channels were closed before a depolarizing voltage was applied.
Data analysis and statistics
In-house software was used to analyze the data, and GraphPad Prism (GraphPad Software, Inc.) was used to fit the data with adequate equations and to calculate Spearman’s rank correlation coefficients (rS). Gating currents activated by a depolarizing voltage step were integrated in time for its total charge. Q-V curves were built by plotting the total charge against voltage. Q-V curves from WT Shaker cannot be fitted with a two-state model. Instead, a three-state model was necessary to fit the data, with at least one intermediate state between resting and active states (Fig. 1 B). It is important to note that the equation is derived from a model that includes three VSD states in sequence. Therefore, the fitted Q-V curves gave two voltage dependence–related fitted parameters from VSD: V0 and V1, respectively, from the voltage-dependent transition from resting state to the intermediate state and from the latter to active state. Normalized Q-V curves from at least four independent experiments were averaged and fitted with a three-state model equation previously developed (Lacroix et al., 2012):
where Q(Vm) is the charge moved at a given membrane voltage Vm, N is the number of sensors, Z0 and V0 are, respectively, the charge and the voltage of the first transition, from resting to an intermediate state, Z1 and V1 are the charge and voltage involved in the second transition, from the intermediate to active state, R is the gas constant, F is the faraday constant, and T is the absolute temperature.
In some cases presented here, a split Q-V curve is obvious by simple inspection where there is a clear presence of an intermediate state of the mutant VSD in question. However, in most of the VSD mutants and in the WT VSD, the intermediate state is not obvious.
K+ conductance was computed from K+ current peaks following Hodgkin and Huxley (1952):
where is the K+ conductance, is the K+ current peak, and Vm is the membrane voltage. [K+]out and [K+]in are the potassium ion concentrations outside and inside, respectively.
Normalized K+ conductances at same voltage from at least four independent experiments were averaged, plotted against the membrane voltage, and fitted with a two-state model (“single Boltzmann”) to obtain the voltage dependence of the PD fitted parameter V1/2.
where G(Vm) is the K+ conductance at a given membrane voltage Vm, V1/2 is the membrane voltage corresponding to half-maximal K+ conductance, and k is a voltage sensitivity factor.
The energies involved in the VSD transitions, E0 and E1 were calculated as follows:
The factor S, defined as the energy difference between the two sequential voltage-dependent transitions of the VSD during activation and proportional to the stabilization of the intermediate state of the VSD, was calculated by the following equation (Lacroix et al., 2012):
Results
Scan of the nine residue regions in the S3–S4 linker’s C terminus reveal two positions that strongly modulate the voltage dependence of the VSD
Shaker channels, WT and mutants, were heterologously expressed in Xenopus oocytes and studied by using cut-open voltage-clamp technique (Stefani and Bezanilla, 1998). A nonconducting version of Shaker, which includes the W434F mutation (Shaker W434F; Perozo et al., 1993), was used to facilitate the recordings of sensing currents. We proceeded with arginine (R), glutamate (E) or glutamine (Q) scanning in the region of nine residues in the end of S3–S4 linker (353-NQAMSLAIL-361 in Shaker), except N353 and Q354, which were not mutated by Q. R, E, and Q were chosen in order to introduce highly hydrophilic residues, positive, negative, or neutral, respectively, in a mostly hydrophobic region. It was possible to record sensing currents in all these Shaker W434F mutants. Gating charge data were fitted to a sequential three-state model because a two-state model is not representative of the data, as shown for the Q-V curve fits and residuals for data of the WT Shaker (Fig. 1 B). The three-state model fitting gives the voltages for equal charge distributions V0 and V1 and apparent charges Z0 and Z1 for the resting to intermediate and intermediate to active state transitions, respectively (see Materials and methods for details). Scaled integrated sensing currents—moved charges—were plotted against the membrane voltage, yielding a Q-V curve for each mutant (Fig. 1, C–E).
In all mutants, V0 was always shifted to more negative voltages, except in only two mutants: N353R, not shifted at all, and M356R, shifted positively by less than 2 mV (Fig. 1 F). In contrast, V1 was shifted according to the mutated residue and the type of mutation (Fig. 1 G). For instance, when mutated, the residues N353 and A355 both seem to have a charge-dependent effect on V1, which is shifted positively with R and negatively with E. All these hydrophilic substitutions, to R, Q, and E, when performed in residues M356, A359, and I360 shift V1 to positive values relative to WT. The same substitutions in residues S357, L358, or L361, all shift V1 to more negative values.
All-AA scans in residues L358 and L361 reveal different mechanisms of VSD voltage dependence modulation
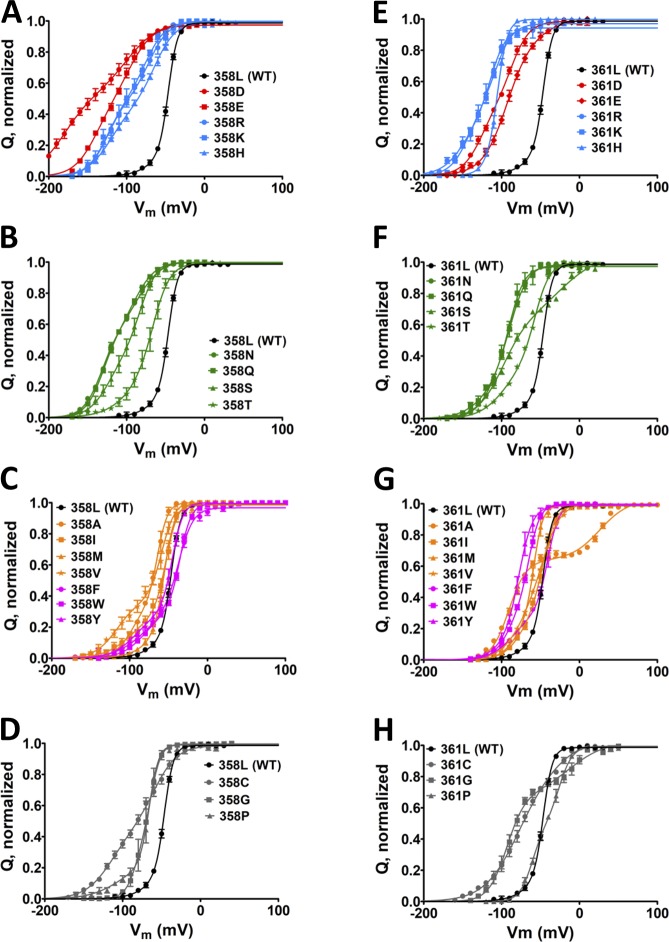
We chose to investigate in further detail the changes in V0, V1, and V1/2 of Shaker with substitutions in L358 or L361 because they were the ones that showed consistent left shifts in both V0 and V1 when mutated into the highly hydrophilic R, E, and Q. To that end, we performed an all-AA scanning, one substitution at a time at residue L358 (L358X) or L361 (L361X). Sensing currents were recorded in all 38 mutants (19 per position), and the integrals of those currents were plotted as moved charges with respect to voltage (Fig. 2, A–F). With the parameters V0, Z0, V1, and Z1 given by the three-states model fittings, we derived other parameters, such as the energy involved in the first and second transitions of the VSD movement, E0 and E1, respectively.
Figure 2.
Q-V curves from both AA scans, L358 and L361, in nonconducting Shaker. (A–H) Averaged Q-V curves from L358X (A–D) and L361X (E–H). For a better visual, in each of the scans, charged AAs (D, E, R, H, and K) mutants are shown in A and E, polar AAs (N, Q, S, and T) mutants are shown in B and F, hydrophobic including aromatic AAs (A, I, L, M, V, F, W, and Y) mutants are shown in C and G, and special case AAs (C, G, and P) mutants are shown in D and H. For reference, the Q-V curves for WT channels are shown in black in all graphs. In all plots, vertical bars from the colored symbols representing each data point denote the SEM. Continuous lines are the best fit of the three-state model (see Materials and methods).
Resting state of Shaker VSD is destabilized by mutations in residues L358 and L361
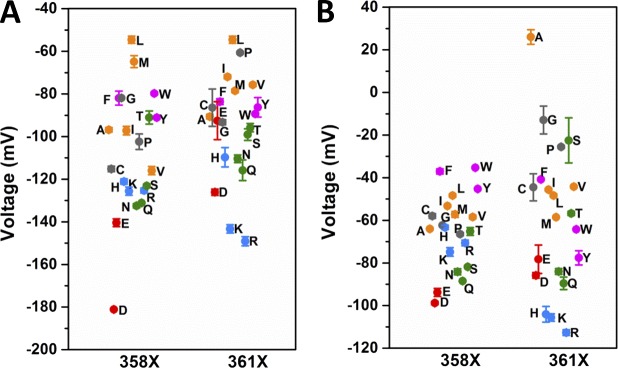
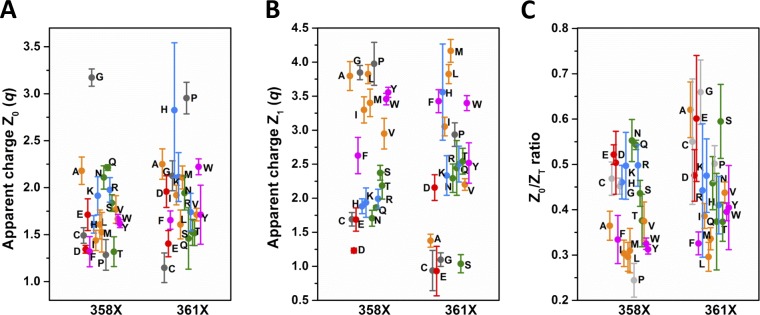
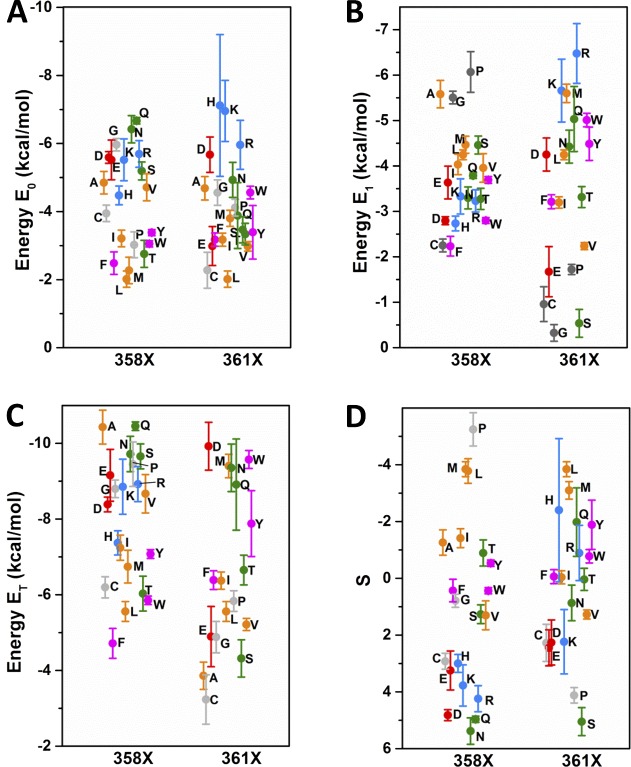
As found by the three-state model fits, V0 is shifted to more negative voltages, relative to the WT value of −51 mV, in L358X and L361X, with an overall relationship with the hydrophobicity of the AA in each position (Fig. 3 A). Hydrophilic substitutions are the ones that produce the stronger negative shifts in V0 in both scans, with maxima at −180 mV with L358D and −149 mV with L361R. Following that, AA with aromatic and aliphatic hydrophobic side chains, roughly in this order, shift V0 to more negative voltages relative to WT. Our data also show a charge-related component in V0 negative shift, induced by charged AA, which is different in L358X and L361X. In L358X, negatively charged AAs (D and E) exert a stronger negative shift compared with positively charged AAs (R and K) and, conversely in L361X, positively charged AAs, compared with negatively charged, are the ones that more strongly shift V0 to more negative voltages. The distributions of V1 from L358X and L361X are more complex when compared with V0 distribution (Fig. 3 B). Basically, the only similarities between the distributions of V0 and V1 from both scans are the charge-related effect and the overall tendency of a negative shift when less hydrophilic AAs are used to replace L358 and L361, but the differences are many. Differently from V0, V1 can also be shifted positively, relative to WT, according to the AA replacing the leucine in L358X and L361X. V1 values from L358X spans from −98 mV in L358D to −35 mV in L358W. In 361X, V1 spans from −112 mV in L361R to +26 mV in L361A, a much broader range of values compared with V1 values from L358X. Furthermore, the residues that shift V1 positively are very different between the two positions: aromatic in L358X and small side chains in L361X. The apparent charge transferred during the two sequential voltage-dependent transitions, Z0 and Z1, are distributed in a relatively wide range of values, but no obvious correlation can be seen (see Fig. 9, A and B). Nevertheless, in both L358X and L361X scans, Z0 is mostly increased in its values, and Z1 mostly decreased. The computation of the total charge ZT is also shown (see Fig. 9 C). Attempts to constrain the sum Z0 + Z1 to be equal to the WT value or to the measured total charge per sensor from Sigg et al. (1994) did not yield converging fits. We attributed this failure to the fact that the fitted Z values do not necessarily denote the actual amount of gating charges per VSD sensor when there are intermediate states, because as the number of states increase the apparent Z values decrease, as demonstrated earlier (Bezanilla and Villalba-Galea, 2013). When Z0 and Z1, together with V0 and V1, respectively, are used to compute the energy of each transition (E0 and E1) and to calculate the factor S (Lacroix et al., 2012), some patterns can be found. E0, the energy involved in the transition between the resting state of the VSD and its main intermediate state, can be increased by about threefold relative to the WT value, and in both positions more hydrophilic residues are more effective in increasing E0 (Fig. 4 A). Conversely, in both positions E1, the energy involved in the transition between the main intermediate state and active state of the VSD, can be increased or decreased, according to nature of the AA (Fig. 4 B). More specifically, in L358X, E1 goes from an increase of 60% to a decrease of 42% relative to the WT value. In L361X, E1 ranges from an increase of 74% to a decrease of 120% (negative energy). Because the same residue, in L358X and L361X scans, has different effects in E0 and E1, the total energy (ET = E0 + E1) comes as a good overall readout of the energy of the system (Fig. 4 C). It turns out that, relative to WT, the total energy involved in the full activation of the VSD changes from an increase of 87% to a decrease of 15% in L358X. In L361X, the change goes from a 150% increase to a 120% decrease (negative energy). The factor S, a dimensionless number that quantifies the existence of an intermediate state in the VSD, between resting and active states, is always increased with respect to WT, with the exception of L358P mutant (Fig. 4 D).
Figure 3.
Set of voltages V0 and V1 from L358X and L361X taken from fits with three-state model for VSD activation. (A and B) V0 (A) and V1 (B) distributions from each mutant, from both scans as indicated in the graphs. The color code in the plot is the same as that used in Fig. 2. The SEM is plotted from each respective data point represented by the colored symbols.
Figure 9.
Apparent charges Z0 and Z1 and the ratio Z0/ZT, (ZT = Z0+ Z1) from mutant voltage sensors in L358X and L361X scans. (A and B) In A and B, respectively, Z0 and Z1 for all mutant voltage sensors, color coded as in Fig. 2, are shown along with SEMs. (C) All mutations in both 358 and 361 positions increase Z0/ZT ratio, except for L358P. The SEM is plotted from each respective data point represented by the colored symbols.
Figure 4.
Sets of energies E0, E1, and ET and factor S values from L358X and L361X. See Materials and methods for details. (A–D) Distribution from both scans as indicated in the graphs of the energy values involved in the first step of the three-state model for VSD activation, E0 (A); in the second step, E1 (B); the sum E0 + E1, ET (C); and the factor S, proportional to the stability of the intermediate state of the VSD (D). The color code in the plot is the same as that used in Fig. 2. The SEM is plotted from each respective data point represented by the colored symbols.
Mutations in the VSD causes changes in pore activation accordingly
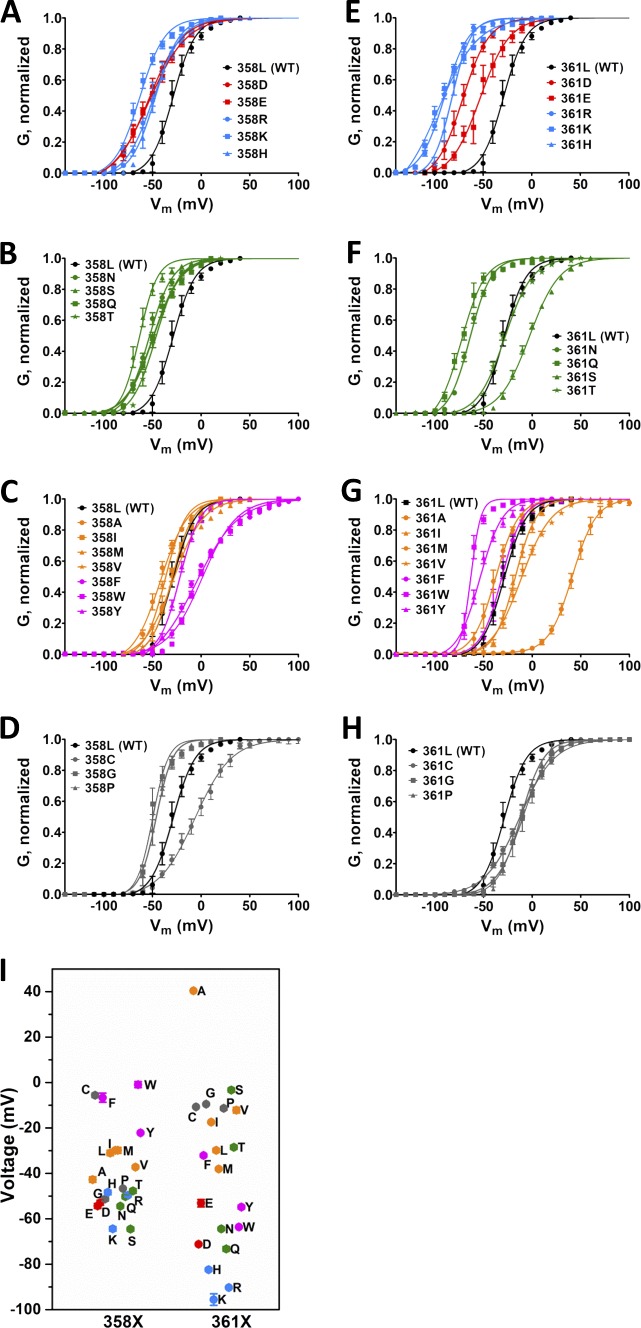
We next made the same all-AA scanning in conductive Shaker. All mutants of the channel were functional, and well resolved voltage-activated K+ conductance was measured. K+ conductance at several voltages was scaled by the maximal conductance of each experiment and plotted against the voltage to produce a G-V curve for each mutant (Fig. 5, A–F). By fitting each curve with a two-state model, we determined the parameter V1/2, being the voltage for half-maximal K+ conductance activation, represented the voltage dependence for the pore activation in each mutant. Our data show that in general hydrophilic residues at L358 and L361 shift the G-V curves to more negative voltages, although the range that V1/2 is changed by mutations in L358 (−64 mV in L358S to −0.9 mV in L358W) is much smaller than changes produced by mutations in L361 (−95 mV in L361K to +40 mV in L361A; Fig. 5 G). In addition to hydrophobicity, the aromaticity in residue 358 seems to play a role on V1/2, and in L361X, besides hydrophobicity, changes in V1/2 were also influenced by the size of the residue 361. As expected, V1/2 correlates strongly and positively with V1, but not with V0, in L358X (rS-V0 = 0.70 and rS-V1 = 0.91) and L361X (rS-V0 = 0.580 and rS-V1 = 0.96) showing that the mutants at L358 and L361 tend to keep the VSD-to-PD coupling (Fig. 6, A and B).
Figure 5.
G-V curves from all AA scans of L358 and L361. (A–H) Averaged G-V curves from L358X (A–D) and L361X (E–H). For a better view, in each of the scans, mutations into charged AAs (D, E, R, H, and K) are shown in A and E, polar AAs (N, Q, S, and T) in B and F, hydrophobic AAs including aromatic amino acids (A, I, L, M, V, F, W, and Y) in C and G, and special cases AAs (C, G, and P) in D and H. For comparison, the G-V curves from WT channels is shown in all graphs. Continuous lines are the best fit of a two-state model to the data (see Materials and methods). (I) The fitted voltage V1/2 from both scans are shown with the color code in the plot is the same as that used in Fig. 2. In all plots, vertical bars from the colored symbols representing each data point denote the SEM.
Figure 6.
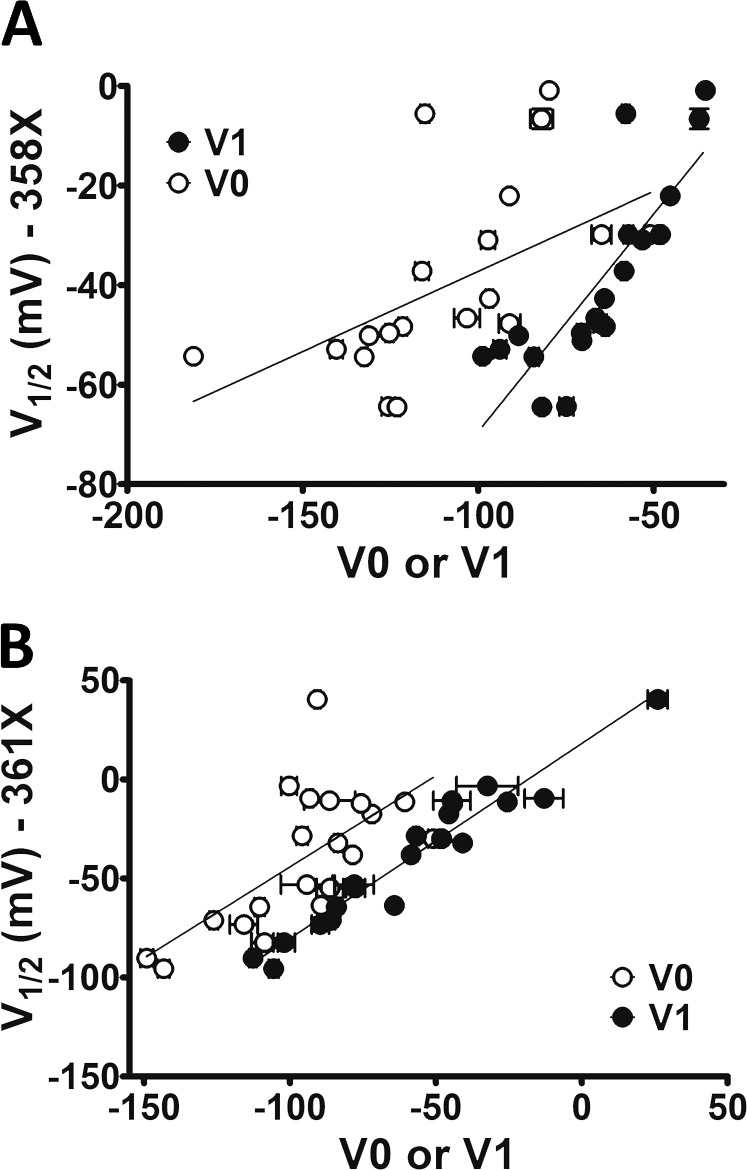
V1/2from G-Vs correlates with V1 from respective Q-Vs as expected for a VSD-to-PD coupling preservation. (A) V1/2 values from L358X scan were plotted with their respective V0 and V1. rS coefficients were 0.70 and 0.91 for V0 and V1, respectively. (B) V1/2 values from L361X plotted with their respective V0 and V1, with rS of 0.58 and 0.96, respectively. Vertical and horizontal bars represent the SEM of the parameter V1/2 and V0 or V1, according to the legend, respectively.
W434F mutation causes major change in VSD movements containing L361R mutation
Because VSD is required to move several steps until the final step that activates the conductance in the PD, it is reasonable to expect that the Q-V curve must be positioned at the left-hand side relative to the respective G-V curve in the voltage axis. However, in one VSD mutant, L361R, this rule was broken as shown in Fig. 7 A. We suspected the cause was the mutation W434F, used to record sensing currents to obtain the Q-V curve and not present in conductive Shaker.
Figure 7.
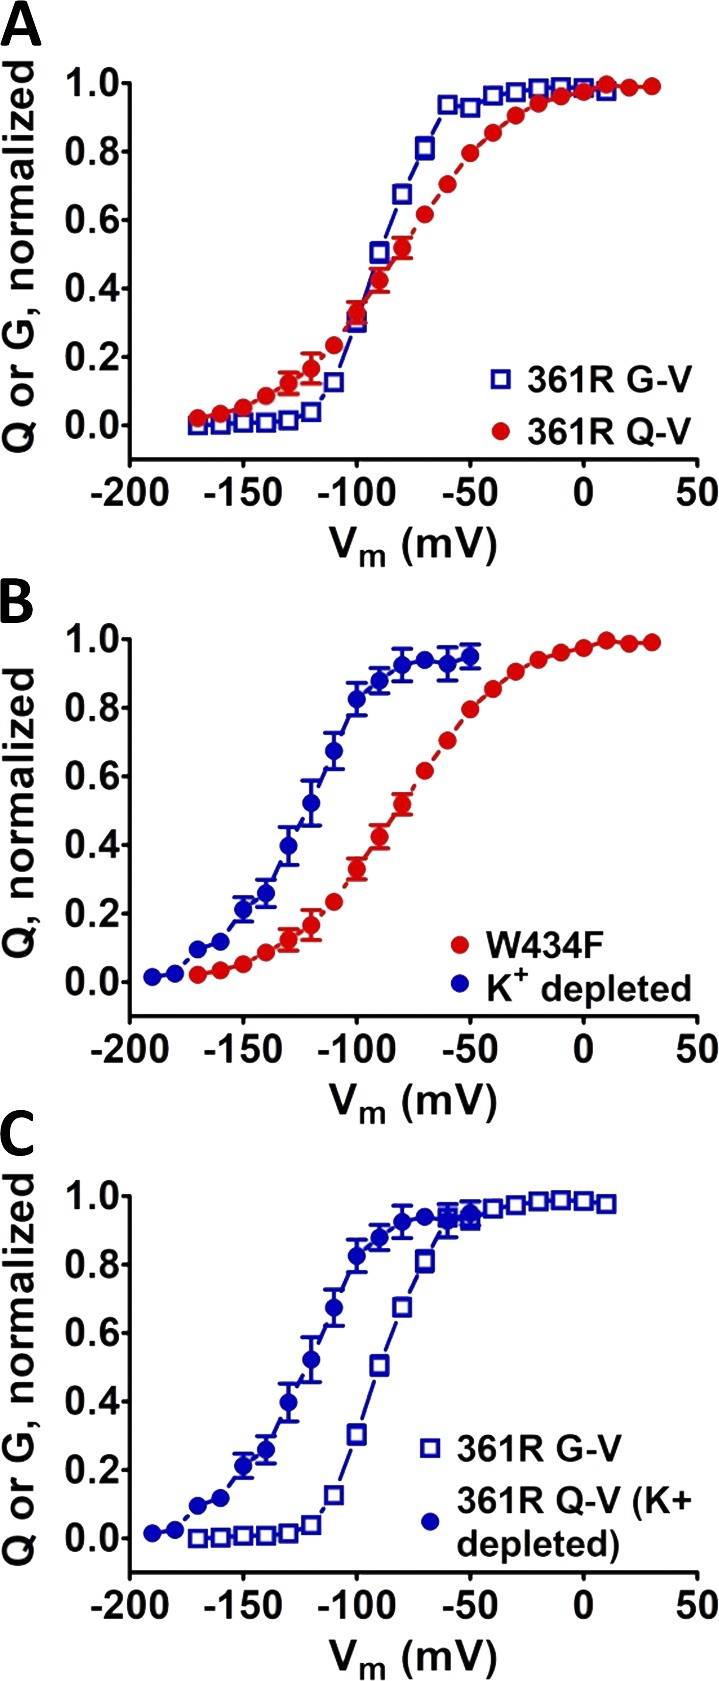
Mutation W434F in PD affects VSD voltage sensitivity in L361R. The voltage dependence of the 361R mutant VSD is affected W434F mutation in the PD. (A) Q-V and G-V curves in channels containing the L361R mutation in the VSD, unusually crossing each other. Q-V curves were calculated from integrated sensing currents recorded by blocking K+ conductance with the W434F mutation. (B) Q-V curves recorded with W434F mutations and by depleting K+ from inside the cells evidencing the effect of the W434F mutation on 361R mutant VSD. (C) Comparison between Q-V and G-V curves, in both cases without the W434F mutation showing the expected relative voltage dependence. Vertical bars from the data points denote the SEM of each respective data point.
To address this problem, we conducted an experiment consisting of depleting K+ ions from inside the oocytes expressing conductive Shaker, until K+ conductance became negligible and sensing currents could be measured. The Q-V curve recorded without the W434F mutation was then positioned entirely at the left-hand side, preceding the G-V (Fig. 7 B) curve. This observation strongly suggested that, at least when VSD contains the L361R substitution, the W434F mutation affects the VSD dynamics. We closely checked a possible crossing of Q-V and G-V curves in the rest of our data. None of the mutations in L358 or L361, except for L361R, showed curve crossing. Therefore, we assumed that, even though it is possible that the VSD dynamics could still be affected by that mutation in the PD, that influence was not extensive enough to jeopardize our voltage dependence analysis. Consequently, except for the L361R case, all Q-V curves in this work were recorded by using the W434F mutation.
Voltage dependencies of the VSD correlate with physicochemical properties of residues 358 and 361
We characterized more quantitatively the changes in the voltage dependence of Shaker’s VSDs by calculating the Spearman correlation rho number (rS) between each series of experimental parameters (V0, V1, E0, E1, and factor S) and a set of indices from AA scales for several physicochemical aspects of the AAs, such as several hydrophobicity scales, accessible surface areas (ASAs) in folded proteins, length and maximal width of the side chain, and volume (Table 1; see Materials and methods).
Table 1. Correlation coefficients between VSD and PD voltage dependence–related fitted and calculated parameters and AA scales.
| Scale type and code | L358X | L361X | |||||||||||
|---|---|---|---|---|---|---|---|---|---|---|---|---|---|
| V0 | V1 | V1/2 | E0 | E1 | S | V0 | V1 | V1/2 | E0 | E1 | S | ||
| Hydrophobicity scales | |||||||||||||
| GESa | 0.78 | 0.78 | 0.72 | 0.80 | -0.19 | -0.69 | 0.81 | 0.66 | 0.59 | 0.63 | 0.34 | -0.22 | |
| HHb | 0.73 | 0.81 | 0.74 | 0.71 | -0.14 | -0.63 | 0.78 | 0.59 | 0.56 | 0.66 | 0.32 | -0.28 | |
| KDc | 0.69 | 0.69 | 0.63 | 0.70 | -0.25 | -0.67 | 0.81 | 0.72 | 0.70 | 0.70 | 0.49 | -0.07 | |
| MCd | 0.73 | 0.81 | 0.74 | 0.74 | -0.10 | -0.63 | 0.77 | 0.57 | 0.53 | 0.54 | 0.27 | -0.21 | |
| MFe | 0.66 | 0.71 | 0.76 | 0.75 | -0.27 | -0.76 | 0.94 | 0.63 | 0.53 | 0.70 | 0.41 | -0.23 | |
| WHPf | 0.73 | 0.54 | 0.44 | 0.63 | -0.48 | -0.75 | 0.79 | 0.85 | 0.80 | 0.62 | 0.62 | 0.04 | |
| WWg | 0.81 | 0.92 | 0.78 | 0.75 | 0.08 | -0.55 | 0.63 | 0.41 | 0.34 | 0.45 | 0.09 | -0.38 | |
| Size scales | |||||||||||||
| ASAh | -0.7 | -0.67 | -0.66 | -0.70 | 0.29 | 0.71 | -0.88 | -0.76 | -0.74 | -0.65 | -0.5 | 0.03 | |
| Lengthi | -0.17 | 0.05 | 0.09 | -0.10 | 0.36 | 0.32 | -0.27 | -0.80 | -0.82 | -0.25 | -0.82 | -0.65 | |
| Widthj | 0.07 | 0.38 | 0.31 | 0.16 | 0.45 | 0.10 | -0.05 | -0.58 | -0.71 | -0.28 | -0.78 | -0.65 | |
| Volumek | 0.15 | 0.46 | 0.37 | 0.20 | 0.36 | 0.05 | 0.02 | -0.57 | -0.67 | -0.06 | -0.75 | -0.79 | |
Spearman correlation coefficients (rS) were calculated between each set of 20 voltage-dependent parameters and the indicated AA scale. Values of rS ≥0.7 or ≤−0.7, denoting very strong correlation, are shown in bold.
Goldman-Engelman-Steitz transfer free energies water–oil for AA side chains in ahelical polypeptides (Engelman et al., 1986).
Hessa-Hejne ΔG scale derived from H-segments with the indicated AA placed in the middle of the 19-residue hydrophobic stretch (Hessa et al., 2005).
Kyte and Doolittle hydropathy index derived from water-vapor transfer ΔG and interior–exterior distribution of AA side chains previously determined (Kyte and Doolittle, 1982).
Miller-Chothya transfer ΔG between the protein surface and interior (Miller et al., 1987).
Moon-Fleming water-to-bilayer transfer ΔG for the AA side chain (Moon and Fleming, 2011).
Wolfenden hydration potential: transfer ΔG of the AA side chain only from vapor to water (Wolfenden et al., 1981).
Wimley-White transfer ΔG of peptide AcWL-X-LL (X = AA) from bilayer interface to water (Wimley and White, 1996).
Median values of total ASA, in angstroms squared, of whole residues in ahelical structures (Lins et al., 2003).
STERIMOL length of the side chain (Fauchère et al., 1988).
STERIMOL width of the side chain (Fauchère et al., 1988).
Van de Waals volume of the residue (Nölting, 1999).
V0 and E0 behaved very similarly in both the L358X and L361X scans. These two experimental parameters correlated positively and strongly with most of the hydrophobicity AA scales considered in this study. V0 and E0 also correlated negatively with ASA in both scans, being clearly more strongly correlated with most of the hydrophobicity AA scales in L358X but not in L361X scan. V1 from both scans was negatively and strongly correlated with ASA, but only when taken from L361X this experimental parameter correlated strongly with size-related AA scales such as length, width, and volume. E1 from both scans correlated weakly with all scales but size-related AA scales in L361X.
Discussion
Voltage-dependent ion channels are the molecular basis of cell excitability in neurons, muscle cells, and glands. The VSDs in these types of channels are known to be the first four TM segments, of a total of six, with the fourth (S4) containing a charged residue (mostly R), every third position. These charged residues (sensing charges) are inside a high-strength electric field, enough to move the backbone of S4 perpendicularly to the plane of the membrane upon membrane voltage changes. Excitable cells are invariably negative inside relative to the outside when not excited; therefore, the electric field across the membrane favors arginines in S4 to stay inside. Upon depolarization of the membrane, the force that once kept S4 in the resting state disappears, and this charged TM segment is released, moving outward. The VSD charges moving across the electric field are capacitive-like currents that can be recorded in special conditions, such as when the protein is overexpressed in the membrane. Despite the fact that the sensing currents can be directly recorded and studied, the voltage range where S4 movements take place seems to be related to other regions in the VSD not necessarily obviously related to the charged residues. Here we show an all-AA scanning of two residues in the S3–S4 loop, extracellularly located and classically considered non-sensing residues: 358 and 361. By means of their physicochemical properties, these residues modulate the S4 movement and therefore the PD activation voltage dependences.
L358 and L361 residues control different movements of the VSD by different mechanisms
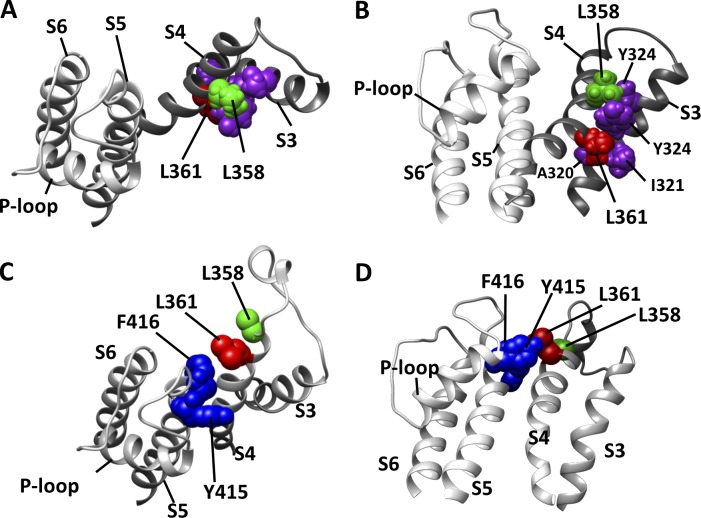
Our data showed that the residues 358 and 361 in Shaker K+ channels are strong modulators of the channels’ VSD voltage dependency. Because in WT channels both 358 and 361 residues are leucine, a highly hydrophobic AA, it is reasonable to speculate that the hydrophobicity of those residues controls the voltage dependence of both processes in the VSD (V0 and V1), an idea previously suggested (Yang et al., 2007). Indeed, the Q-V curves, which fitted parameters V0 and V1, are remarkably shifted to more negative voltages when highly hydrophilic AAs such as R, E, and Q were in those positions. We were not satisfied that experiments with only four different AAs, L (WT), R, E, and Q in each position were enough to accept that hypothesis. Therefore, we did an all-AA scan in both residue positions in order to have the maximal number of points (20) in the correlation plots. Then we determined the possible correlation of each of those sets of fit parameters V0 and V1, from both scans with classic hydrophobicity AA scales (see Materials and methods) and AA size-related scales representing the ASA of the residues and their length, width, and volumes. As mentioned before, the distribution of V0 is wide in both scans and shows the sensitivity of this parameter to a change in the side chains of two non-sensing residues. We also showed that the distributions of V0 from L358X and L361X are correlated positively with hydrophobic scales considered here and negatively correlated with ASA, showing that these two residues tend to be buried at the resting state. None of the size-related scales, length, width and volume, correlated meaningfully with the distributions of V0 (Table 1). These findings are in agreement with the prediction of the consensus model for the resting state published by Vargas et al. (2011) because this model predicts these two residues are in an extensive contact with the side chains of the S3 segment residues such as T326, Y324, I321, and A320 (Fig. 8). The relative position between these four residues from S3 and the two residues L358 and L361 from S4 can be inferred from the putative closed structure. The interface between S3 and S4 is formed by stacked-like or intercalated side chains of the following residues (looking from the extracellular space) in the following order: T326, L358, Y324, L361, I321, and A320. We speculate that in this configuration of the VSD, the size of the side chains has little or no effect on setting the resting state because the both S3 and S4 segments would have flexibility to move sideways in the plane of the membrane.
Figure 8.
Relative positions of L358 and L361 residues from Shaker in the resting and active states as predicted by KV1.2 models. (A and B) Top view (A) and side view (B) of the resting state of the VSD as predicted by a structural- and functional-data-based consensus resting model (Vargas et al., 2011). The panels show S3 and S4 from the consensus model and S5, P-loop, and S6 from a neighbor channel subunit, from a crystallography-derived model of KV1.2 (PDB code 3LUT). Only pertinent residues are shown with spheres representing the Van der Waals volume of each atom. The color code is the following—magenta: residues I321, Y324, and T326 from S3; green: L358; red, L361. (C and D) Top view (C) and side view (D) of the active state of the VSD as predicted by a crystallography-derived model of KV1.2. Highlighted residues are also shown as spheres in the same way as in A and B, with residues L358 in green, L361 in red, and Y415 and F416, both from S5, in blue.
The analysis of the Q-V curves by using a three-state model assumes the existence of an intermediate state stable enough to produce two identifiable voltage-dependent processes in the S4 trajectory. Although currently there are no available and consistent structural data on an intermediate state in Shaker K+ channels, our functional data may help define that state: an attempt to access the relative position of the intermediate state by calculating the ratio between Z0 and the total apparent charge (ZT = Z0 + Z1), Z0/ZT. That value for WT channels is 0.28 and for all mutants, but for L358P that value is higher, suggesting that the intermediate state is always displaced outward relative to the WT intermediate state when L358 or L361 is mutated (Fig. 9). In numbers, Z0/ZT spanned from the WT value (0.28) to 0.55 in L358X and to 0.66 in L361X. It is important to emphasize that the ratio Z0/ZT may not represent exactly the relative position level of the intermediate state because the Z values estimated by the three-state model data fits give only an apparent charge, being underestimated (decreased values) when many subintermediate states are present, as shown previously (Bezanilla and Villalba-Galea, 2013). Also, because both L358X and L361X scans produced conductive channels with G-V curves with reasonable voltage sensitivity, given by the maximal slope of the curves, we conclude, as suggested by Gonzalez et al. (2000) that the relative position of the S4 segment was not affected by the mutations studied here. Instead, what can be generating variations in the Z value can be attributed by both the presence of more intermediate states and the reshaping of the extracellular cavity, mostly lined by the S3–S4 linker, which was slightly changed in this case. Nevertheless, it is noteworthy to note that Z0 was always increased, which may indicate a meaningful result. The stability of the intermediate state was assessed by the factor S, a dimensionless value previously derived by Lacroix et al. (2012) that denotes the stability of the intermediary state. In this analysis, relative to WT, L358X mutant intermediate state stability was increased up to 2.3 times and in L361X up to 3.4 times (Fig. 4 D). In both scans, none of the AA scales considered here showed a good correlation with the stability of the intermediate state in the mutants, and we attribute that to the fact that these supposed intermediate states differ at each mutation, and so they are not comparable. Yet, the Z0/ZT would measure the relative position of the S4 at the most stable intermediate state, but it lacks information on their voltage dependence.
The distributions of V1, the voltage that moves S4 from an intermediate to active state, correlate with the hydrophobicity index and ASA of the residue in both positions L358X and L361X. But it is V1 only from L361X, and not from L358X, that correlates with the length, width, and volume of the residue in position 361. The analysis of V1 values in L358X and L361X can give us some hints on how that movement happens. It is known from the Shaker like K+ channel (KV1.2) crystal structure (in the active-relaxed state) that L358 side chain is far from any other residue in the protein and it is pointing to a region away from the top of the segment S5, the closest residues outside of the VSD in this conformational state of the sensor. Therefore, the inspection of the active-state structure currently available is not enough to explain the broad range of V1 values obtained in L358X scan. Still in the KV1.2 crystal structure, L361 side chain is also far from any other residue in the protein. Hence, we hypothesize that during the activation movement process, at an intermediate position different from the resting or active states, the mutated residues L358 or L361 interact with other regions of the protein, never seen in structural studies because they are not as stable as the steady-states resting and active. In that hypothesis, possible partners for L358 and L361 in an intermediate state of the VSD are likely to be in the top of S5 segment. We suggest the putatively important residues in S5 in temporary partnership to be Y415 and F416, both AAs bearing bulky side chains. One of these residues, F416, along with A419, was found to make close contact with R362 from S4 during VSD activation (Lainé et al., 2003). Interestingly, when aromatic side chains are in L358X, such as F, Y, and W, the voltage necessary to fully activate the VSD, V1, is more depolarized than in WT. These aromatic L358X mutants also show some degree of splitting in the Q-V curve, suggesting they may coordinate with those aromatic residues in S5, but we did not address this question in the present work. In the case of the L361X mutants, among the aromatic substitutions only in L361F, it is possible to detect a slight split in the Q-V curve, an effect similar to L358F. The other two aromatic mutants, L361Y and L361W, do not show any evident split in their Q-V curves. It is expected that aromatic side chains in residue 358 have a different path during VSD activation by voltage when compared with the side chain in residue 361. In L361X, not the aromatic or bulky, but small side chains, in length, width, and volume such as A, C, S, V, and P, produce a great split in the Q-V curves. We hypothesize this may happen because those short side chains, or alternatively the lack of medium-to-big side chains, are being trapped in a low-energy intermediate state. This hypothesis was not addressed in the present study.
The technique, named site-directed fluorimetry or alternatively voltage-clamped fluorimetry, is normally used to probe VSD movements by monitoring the fluorescence of a fluorophore attached to an engineered cysteine in S3–S4 extracellular loop (Priest and Bezanilla, 2015). During VSD movements the fluorescence signal may change because of quenching/unquenching when the fluorophore senses different environments. In Shaker, residues M356 and A359 in the S3–S4 linker, have been mutated to cysteine to attach a fluorophore via disulfide bond (Mannuzzu et al., 1996; Cha and Bezanilla, 1997). The fluorescence signal from 356C- and 359C-flurophore track the transferred charges during VSD activation, showing residues in the S3–S4 linker do change their environment, exchanging their coordinating partners when S4 moves. Our data in this present work show residues 358 and 361 change their environment differently during activation after a comprehensive analysis including all possible side chains from natural AAs. This result is consistent with environmental changes detected by site-directed fluorimetry.
Comparisons of the effects produced by similar replacements for L358 and L361 show distinct mechanisms despite the overall similar hydrophobicity dependence
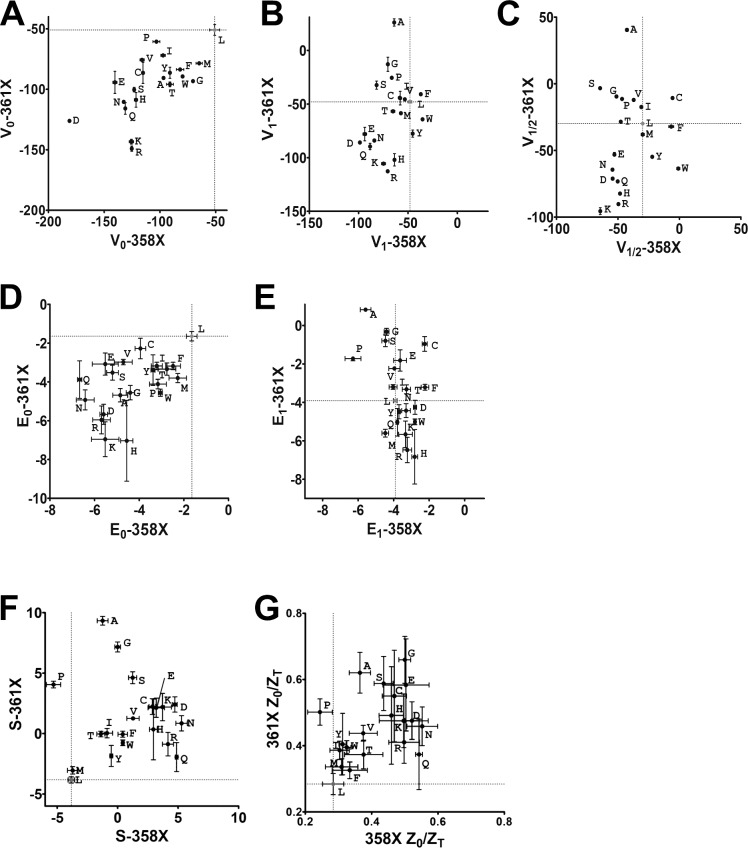
As shown in Fig. 1, VSD dynamics is affected similarly by replacing the WT residues L358 or L361 into R, Q, or E. However, when we distribute the whole set of data from different scans (fit parameters V0, Z0, V1, Z1, and V1/2 and derived parameters E0, E1, factor S, and Z0/ZT), one can find AAs with very similar effects in L358X and L361X but also AAs with opposite effects when placed in different positions. In this analysis, we simply considered the quadrants where the data points are located in the plotting areas that were split in four quadrants by the WT data point (Fig. 10). Data points in the first and third quadrants are relative to mutations with similar effect in L358X and L361X, shifting the parameter in the same direction in both scans. Data points plotted in the second and fourth quadrants denote specific mutations that have opposite effects in L358X compared with L361X for that particular parameter plotted in the graph. Following this classification, V0, E0, and factor S are similarly affected by mutations in 358 and 361 residues, whereas V1 and E1 are mostly affected differently when the replacement is done in L358 compared with in L361. Differences in the modulation of the voltage dependence of the VSD by the residues L358 and L361 characteristics are consistent with the fact that, despite being separated by only two other residues in the α-helical structure, they do not share the same partners in the protein environment during voltage activation. Three residues apart (i; i+3) in an α-helical structure place the α-carbons of the two residues 60° separated and 3 Å apart longitudinally, which might be enough to explain that perturbations in these two residues can produce such different outcomes. Besides, one should consider that only L361, and not L358, is in a complete hydrogen-bonded α-helical structure region according to a model derived from structural studies (Chen et al., 2010).
Figure 10.
Comparisons between parameters from L358X and L361X show crucial differences between the scans. In all plots, data points are labeled by the mutation they are representing. Vertical and horizontal lines are at the WT values in x and y axis, splitting the plotting area into four quadrants. Data points in odd quadrants show the mutation has similar effects either in L358X and L361X. Data points in the even quadrants include cases where the same mutation has opposite effects when in L358X or L361X. (A) V0. (B) V1. (C) V1/2. (D) E0. (E) E1. (F) Z0/ZT. (G) Factor S (see Materials and methods for details). Bars represent the SEM.
In summary, we found residues in the protein that can greatly change VSD and PD voltage dependences of the channel without altering the charges in the S4 segment. We believe that our data may prove useful in understanding VSD dynamics because it relates functional data in non-sensing residues in specific positions. The results emphasize the importance of the environment that surrounds the noncharged moving parts of the sensor in modulating its function while it is activated. In addition, the modifications found here help define intermediate states of the VSD that can be studied functionally and even structurally.
Acknowledgments
We thank Dr. Jerome Lacroix for helpful discussions during the early conception of this work.
J. L. Carvalho-de-Souza was partly supported by Coordenação de Aperfeiçoamento de Pessoal de Ensino Superior (CAPES), Ministério da Educação, Brasil. This work was supported by National Institutes of Health grant R01GM030376.
The authors declare no competing financial interests.
Author contributions: Both authors contributed to the design of the project. J.L. Carvalho-de-Souza performed all experiments and analyzed the data. J.L. Carvalho-de-Souza wrote the manuscript with input from F. Bezanilla.
Richard W. Aldrich served as editor.
References
- Bezanilla F., and Armstrong C.M.. 1977. Inactivation of the sodium channel. I. Sodium current experiments. J. Gen. Physiol. 70:549–566. 10.1085/jgp.70.5.549 [DOI] [PMC free article] [PubMed] [Google Scholar]
- Bezanilla F., and Villalba-Galea C.A.. 2013. The gating charge should not be estimated by fitting a two-state model to a Q-V curve. J. Gen. Physiol. 142:575–578. 10.1085/jgp.201311056 [DOI] [PMC free article] [PubMed] [Google Scholar]
- Cha A., and Bezanilla F.. 1997. Characterizing voltage-dependent conformational changes in the Shaker K+ channel with fluorescence. Neuron. 19:1127–1140. 10.1016/S0896-6273(00)80403-1 [DOI] [PubMed] [Google Scholar]
- Chen X., Wang Q., Ni F., and Ma J.. 2010. Structure of the full-length Shaker potassium channel Kv1.2 by normal-mode-based X-ray crystallographic refinement. Proc. Natl. Acad. Sci. USA. 107:11352–11357. 10.1073/pnas.1000142107 [DOI] [PMC free article] [PubMed] [Google Scholar]
- Elinder F., Madeja M., Zeberg H., and Århem P.. 2016. Extracellular linkers completely transplant the voltage dependence from Kv1.2 ion channels to Kv2.1. Biophys. J. 111:1679–1691. 10.1016/j.bpj.2016.08.043 [DOI] [PMC free article] [PubMed] [Google Scholar]
- Engelman D.M., Steitz T.A., and Goldman A.. 1986. Identifying nonpolar transbilayer helices in amino acid sequences of membrane proteins. Annu. Rev. Biophys. Biophys. Chem. 15:321–353. 10.1146/annurev.bb.15.060186.001541 [DOI] [PubMed] [Google Scholar]
- Fauchère J.L., Charton M., Kier L.B., Verloop A., and Pliska V.. 1988. Amino acid side chain parameters for correlation studies in biology and pharmacology. Int. J. Pept. Protein Res. 32:269–278. 10.1111/j.1399-3011.1988.tb01261.x [DOI] [PubMed] [Google Scholar]
- Gonzalez C., Rosenman E., Bezanilla F., Alvarez O., and Latorre R.. 2000. Modulation of the Shaker K(+) channel gating kinetics by the S3-S4 linker. J. Gen. Physiol. 115:193–208. 10.1085/jgp.115.2.193 [DOI] [PMC free article] [PubMed] [Google Scholar]
- Gonzalez C., Rosenman E., Bezanilla F., Alvarez O., and Latorre R.. 2001. Periodic perturbations in Shaker K+ channel gating kinetics by deletions in the S3-S4 linker. Proc. Natl. Acad. Sci. USA. 98:9617–9623. 10.1073/pnas.171306298 [DOI] [PMC free article] [PubMed] [Google Scholar]
- Hessa T., Kim H., Bihlmaier K., Lundin C., Boekel J., Andersson H., Nilsson I., White S.H., and von Heijne G.. 2005. Recognition of transmembrane helices by the endoplasmic reticulum translocon. Nature. 433:377–381. 10.1038/nature03216 [DOI] [PubMed] [Google Scholar]
- Hodgkin A.L., and Huxley A.F.. 1952. Currents carried by sodium and potassium ions through the membrane of the giant axon of Loligo. J. Physiol. 116:449–472. 10.1113/jphysiol.1952.sp004717 [DOI] [PMC free article] [PubMed] [Google Scholar]
- Hoshi T., Zagotta W.N., and Aldrich R.W.. 1990. Biophysical and molecular mechanisms of Shaker potassium channel inactivation. Science. 250:533–538. 10.1126/science.2122519 [DOI] [PubMed] [Google Scholar]
- Kyte J., and Doolittle R.F.. 1982. A simple method for displaying the hydropathic character of a protein. J. Mol. Biol. 157:105–132. 10.1016/0022-2836(82)90515-0 [DOI] [PubMed] [Google Scholar]
- Lacroix J.J., Pless S.A., Maragliano L., Campos F.V., Galpin J.D., Ahern C.A., Roux B., and Bezanilla F.. 2012. Intermediate state trapping of a voltage sensor. J. Gen. Physiol. 140:635–652. 10.1085/jgp.201210827 [DOI] [PMC free article] [PubMed] [Google Scholar]
- Lainé M., Lin M.C., Bannister J.P.A., Silverman W.R., Mock A.F., Roux B., and Papazian D.M.. 2003. Atomic proximity between S4 segment and pore domain in Shaker potassium channels. Neuron. 39:467–481. 10.1016/S0896-6273(03)00468-9 [DOI] [PubMed] [Google Scholar]
- Lins L., Thomas A., and Brasseur R.. 2003. Analysis of accessible surface of residues in proteins. Protein Sci. 12:1406–1417. 10.1110/ps.0304803 [DOI] [PMC free article] [PubMed] [Google Scholar]
- Li-Smerin Y., Hackos D.H., and Swartz K.J.. 2000. α-helical structural elements within the voltage-sensing domains of a K(+) channel. J. Gen. Physiol. 115:33–50. 10.1085/jgp.115.1.33 [DOI] [PMC free article] [PubMed] [Google Scholar]
- Mannuzzu L.M., Moronne M.M., and Isacoff E.Y.. 1996. Direct physical measure of conformational rearrangement underlying potassium channel gating. Science. 271:213–216. 10.1126/science.271.5246.213 [DOI] [PubMed] [Google Scholar]
- Mathur R., Zheng J., Yan Y., and Sigworth F.J.. 1997. Role of the S3-S4 linker in Shaker potassium channel activation. J. Gen. Physiol. 109:191–199. 10.1085/jgp.109.2.191 [DOI] [PMC free article] [PubMed] [Google Scholar]
- Miller S., Janin J., Lesk A.M., and Chothia C.. 1987. Interior and surface of monomeric proteins. J. Mol. Biol. 196:641–656. 10.1016/0022-2836(87)90038-6 [DOI] [PubMed] [Google Scholar]
- Moon C.P., and Fleming K.G.. 2011. Side-chain hydrophobicity scale derived from transmembrane protein folding into lipid bilayers. Proc. Natl. Acad. Sci. USA. 108:10174–10177. 10.1073/pnas.1103979108 [DOI] [PMC free article] [PubMed] [Google Scholar]
- Nölting B. 1999. Physical interactions that determine the properties of proteins. In Protein Folding Kinetics. Springer, Berlin, Heidelberg: 17–25. 10.1007/978-3-662-03966-3_3 [DOI] [Google Scholar]
- Perozo E., MacKinnon R., Bezanilla F., and Stefani E.. 1993. Gating currents from a nonconducting mutant reveal open-closed conformations in Shaker K+ channels. Neuron. 11:353–358. 10.1016/0896-6273(93)90190-3 [DOI] [PubMed] [Google Scholar]
- Priest M., and Bezanilla F.. 2015. Functional site-directed fluorometry. In Novel Chemical Tools to Study Ion Channel Biology. Ahern C. and Pless S., editors Springer, New York: 55–76. 10.1007/978-1-4939-2845-3_4 [DOI] [PubMed] [Google Scholar]
- Priest M.F., Lacroix J.J., Villalba-Galea C.A., and Bezanilla F.. 2013. S3-S4 linker length modulates the relaxed state of a voltage-gated potassium channel. Biophys. J. 105:2312–2322. 10.1016/j.bpj.2013.09.053 [DOI] [PMC free article] [PubMed] [Google Scholar]
- Shahidullah M., and Covarrubias M.. 2003. The link between ion permeation and inactivation gating of Kv4 potassium channels. Biophys. J. 84:928–941. 10.1016/S0006-3495(03)74910-8 [DOI] [PMC free article] [PubMed] [Google Scholar]
- Shi G., Kleinklaus A.K., Marrion N.V., and Trimmer J.S.. 1994. Properties of Kv2.1 K+ channels expressed in transfected mammalian cells. J. Biol. Chem. 269:23204–23211. [PubMed] [Google Scholar]
- Sigg D., Stefani E., and Bezanilla F.. 1994. Gating current noise produced by elementary transitions in Shaker potassium channels. Science. 264:578–582. 10.1126/science.8160016 [DOI] [PubMed] [Google Scholar]
- Stefani E., and Bezanilla F.. 1998. Cut-open oocyte voltage-clamp technique. Methods Enzymol. 293:300–318. 10.1016/S0076-6879(98)93020-8 [DOI] [PubMed] [Google Scholar]
- Vargas E., Bezanilla F., and Roux B.. 2011. In search of a consensus model of the resting state of a voltage-sensing domain. Neuron. 72:713–720. 10.1016/j.neuron.2011.09.024 [DOI] [PMC free article] [PubMed] [Google Scholar]
- Villalba-Galea C.A., Frezza L., Sandtner W., and Bezanilla F.. 2013. Sensing charges of the Ciona intestinalis voltage-sensing phosphatase. J. Gen. Physiol. 142:543–555. 10.1085/jgp.201310993 [DOI] [PMC free article] [PubMed] [Google Scholar]
- Wimley W.C., and White S.H.. 1996. Experimentally determined hydrophobicity scale for proteins at membrane interfaces. Nat. Struct. Biol. 3:842–848. 10.1038/nsb1096-842 [DOI] [PubMed] [Google Scholar]
- Wolfenden R., Andersson L., Cullis P.M., and Southgate C.C.. 1981. Affinities of amino acid side chains for solvent water. Biochemistry. 20:849–855. 10.1021/bi00507a030 [DOI] [PubMed] [Google Scholar]
- Yang Y.-C., Own C.-J., and Kuo C.-C.. 2007. A hydrophobic element secures S4 voltage sensor in position in resting Shaker K+ channels. J. Physiol. 582:1059–1072. 10.1113/jphysiol.2007.131490 [DOI] [PMC free article] [PubMed] [Google Scholar]


