

Summary
Brain aging and neurodegeneration are associated with prominent microglial reactivity and activation of innate immune response pathways, commonly referred to as neuroinflammation. One such pathway, the type I interferon response, recognizes viral or mitochondrial DNA in the cytoplasm via activation of the recently discovered cyclic dinucleotide synthetase, cGAS, and the cyclic dinucleotide receptor, STING. Here, we show that the FDA-approved, antiviral drug Ganciclovir (GCV) induces a type I interferon response independent of its canonical thymidine kinase target. The inhibition of components of the STING pathway, including STING, IRF3, Tbk1, extracellular IFNβ and the Jak-Stat pathway resulted in reduced activity of GCV and its derivatives. Importantly, functional STING was necessary for GCV to inhibit inflammation in cultured myeloid cells and in a mouse model of multiple sclerosis. Collectively, our findings uncover an unexpected new activity of GCV and identify the STING pathway as a regulator of microglial reactivity and neuroinflammation.
eTOC blurb
Mathur et al. describe a non-canonical function of the antiviral drug Ganciclovir in microglia. Ganciclovir induces a type I interferon response and reduces neuroinflammation in a mouse model of Multiple Sclerosis. The innate immune adapter STING is required for this activity of Ganciclovir.
Introduction
Neurodegenerative diseases such as Alzheimer’s disease, Parkinson’s disease, Huntington’s disease, multiple sclerosis, fronto-temporal dementia and amyotrophic lateral sclerosis are associated with activation of predominantly innate immune pathways, referred to as neuroinflammation. During this process, microglia and other brain cells, and in some cases infiltrating cells from the systemic environment, secrete inflammatory cytokines and chemokines with positive and negative effects on the brain (Glass et al., 2010). Interferons are one such class of cytokines with neuroprotective and neurotoxic properties (Deczkowska et al., 2016). For example, the type II interferon, IFNγ, previously considered proinflammatory, has recently been shown to contribute to immune surveillance in healthy brains (Kunis et al., 2013). Similarly, the type I interferon, IFNβ, was shown to negatively affect brain function during aging (Baruch et al., 2014) and on the other hand, IFNβ can serve a protective function and is used to dampen inflammation in active, relapsing multiple sclerosis (Group, 1993). Additionally, the lack of IFNβ signaling in neurons resulted in Lewy body and Parkinson’s disease-like dementia in mice (Ejlerskov et al., 2015). Together, these studies suggest that the relative levels of type I and type II interferons and the context in which they act has profound impact on neuroinflammation and neurodegeneration (Deczkowska et al., 2016).
The production of type I interferons can be induced by a number of pattern recognition receptors (Takeuchi and Akira, 2010), which trigger signaling cascades and targeted immune responses. The presence of double-stranded (ds) viral DNA in the host cytoplasm, for example, is recognized by the recently discovered cyclic GMP-AMP synthetase (cGAS), which catalyzes production of the second messenger cGAMP, a potent ligand of the signaling adaptor stimulator of interferon genes (STING/MPYS/MITA/ERIS; encoded by TMEM173). This cascade further elicits the activation of IKK and TBK1 kinases, NFκB and IRF3 transcription factors, and the production of IFNβ (Ishikawa and Barber, 2008; Okabe et al., 2009; Schoggins et al., 2011; Sun et al., 2009). STING has thus emerged as an attractive target for drug discovery, especially for cancer treatment (Ahn et al., 2015; Fu et al., 2015), but little is known about the role of STING in the brain and whether it has a role in neuroinflammation and neurodegeneration.
Here, we show that the antiviral drug, Ganciclovir (GCV), induces a type I interferon response in microglia which depends on a functional STING pathway. In vivo, STING is expressed in microglia in the CNS and is upregulated in experimental autoimmune encephalomyelitis (EAE), a mouse model for multiple sclerosis. Treatment with GCV reduces STING expression, microglial inflammatory signature, immune cell infiltration and paralysis in the EAE mouse model in a STING dependent fashion.
Results
Ganciclovir (GCV; Figure 1A) and other nucleoside analogs of 2’-deoxyguanosine are effective anti-viral drugs for the treatment of cytomegalovirus and herpes virus infections (Faulds and Heel, 1990). We recently reported that GCV, at therapeutic doses equivalent to those in humans, ameliorates the disease course and pathology of EAE in mice (Ding et al., 2014). GCV exerted these effects, in part, by reducing immune cell infiltration and inhibiting the proliferation of microglia, the immune cells of the CNS. To understand the molecular basis of GCV activity, microglia-like BV-2 cells were stimulated with GCV and 38 secreted proteins were measured using a Luminex based array (Figure S1A-B). GCV treatment led to the upregulation of several antiviral proteins, and CXCL10 was most significantly over produced (Figure S1B). Gene expression analysis of GCV treated BV-2 cells (Figure S1C-D) using a microfluidic quantitative RT-PCR panel that we created (consisting of 86 microglia genes, Table S1), showed upregulation of CXCL10 and type I interferons (Figure S1C-D). To corroborate these findings, primary microglia isolated from adult mice were treated with GCV and analyzed using the same panel. As with BV2 cells, primary microglia showed prominent induction of type I interferon dependent gene expression after GCV treatment (Figure 1B-C) including CXCL10 and IFNβ (Figure 1D). In addition, these genes were increased at the protein level as well (Figure 1F). Importantly, GCV not only activated this interferon response in mouse microglia but as well in human iPSC-derived microglia, iMGLs (Abud et al., 2017) (Figure 1E). We chose to use CXCL10 and IFNβ as outcomes for GCV activity since these proteins were upregulated at transcript as well as protein levels across multiple microglial and myeloid cell types. GCV exhibited time and dose dependent activity without detectable toxicity (Figure 1G-I). Hence, we conclude that these immune modulatory effects of GCV are unlikely due to growth inhibition or cell death.
Figure 1. Ganciclovir induces interferon response in microglia.
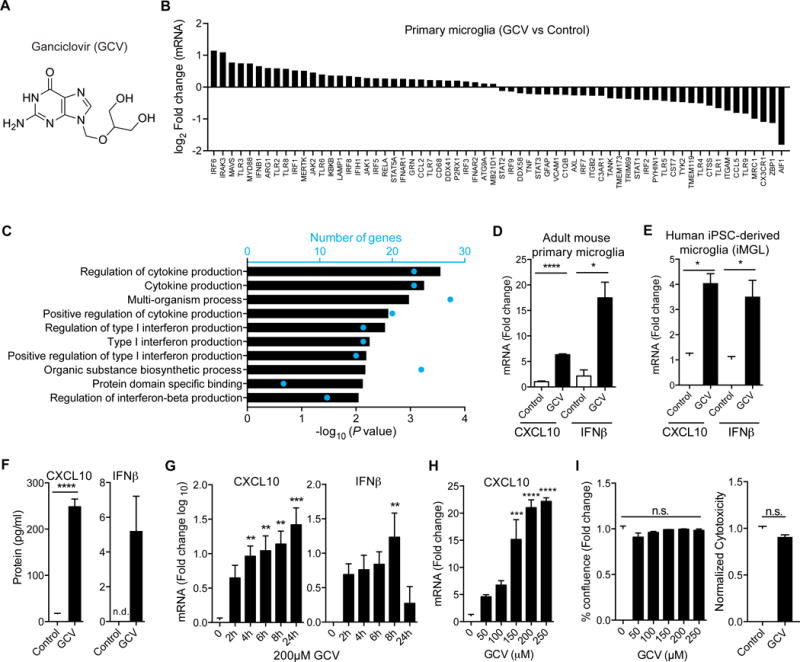
(A) Structure of Ganciclovir (GCV). (B) Microfluidic quantitative RT-PCR (qRT-PCR) analysis of control or GCV treated primary microglia from adult mice (n= 4 mice/group). Differentially expressed genes with log2 fold change > 0.1 and < −0.1 are shown. (C) Gene ontology pathways enriched by GCV treatment in primary microglia. Blue dots indicate the number of significant genes in the respective GO term. (D-E) qRT-PCR analysis for CXCL10 and IFNβ from GCV treated primary microglia from adult mice (D) and iPSC-derived human microglia, iMGL (E). (F) ELISA for CXCL10 and IFNβ on supernatants from primary microglia treated with GCV. (G) Time course for the induction of CXCL10 and IFNβ mRNA in BV-2 cells treated with GCV. (H-I) Dose response for CXCL10 mRNA (G), cell viability (H, left) and cytotoxicity (H, right) in BV-2 cells treated with GCV for 24h. Fold change is based on control treatment for experiment. All GCV treatments were with 200μM unless otherwise noted. Statistical tests: one-way ANOVA followed by Dunnett’s multiple comparison test (G-I), unpaired Student’s t-test (D-F). Bars represent mean + SEM from 3 (cell lines) or 2 (primary cells) independent experiments. *P < 0.05, **P < 0.01, *** P < 0.001, ****P < 0.0001.
In its canonical mechanism of action, GCV is phosphorylated by viral thymidine kinases (e.g. Herpes Simplex Virus type 1 thymidine kinase, HSVtk) (Littler et al., 1992) and incorporated into cellular DNA thereby inhibiting replication (Matthews and Boehme, 1988). In contrast, GCV activity that we describe did not require HSVtk or endogenous tk. Cells used in this study did not express viral tk (Figure S1E-F). Additionally, microglia isolated from adult tk1 knockout mice treated with GCV also produced CXCL10 and IFNβ (Figure S1G-H), suggesting that thymidine kinase is dispensable for this activity of GCV.
In a cell-based model of inflammation where primary microglia or BV-2 cells were stimulated with IFNγ and LPS, GCV led to a significant transcriptional inhibition of several proinflammatory genes (Figure S2A). One of the most significantly reduced transcript and protein was NOS2/iNOS (Figure S2A, C, D, E), which further led to a reduction in neurotoxic microglial nitric oxide production (Figure S2B, F).
We tested if other compounds and antiviral drugs could induce a type I interferon response like GCV. The structurally related, FDA approved GCV analogs, Acyclovir and Penciclovir or endogenous molecules, guanine and guanosine and the structurally unrelated antiviral drugs (structures shown in Figure 2A, S3) failed to induce CXCL10 mRNA (Figure 2B-C), suggesting the 1,3-dihydroxy-2-propoxymethyl group at N9 of the guanine ring is necessary for activity. In support of this notion, methylating the 1, 3-dihydroxyl groups in GCV abrogated CXCL10 inducing activity, while providing 4 hydroxyl groups in GCV dimers synthesized using reducible disulfide linker (thiol-GCV) or non-reducible PEG linkers (diGCV) at C6 of the guanine ring increased potency to induce CXCL10 (Figure 2D-E). Like GCV, diGCV, as well as the PEGylated GCV monomer (monoGCV), dose-dependently induced CXCL10 without causing considerable toxicity (Figure 2F-I). Additionally, monoGCV and diGCV potently reduced iNOS transcript and protein (Figure S2C, D, G); and nitric oxide production in IFNγ/LPS stimulated BV-2 cells (Figure S2H), and they induced CXCL10 independent of endogenous tk1 (Figure S2I).
Figure 2. GCV derivatives are potent inducers of interferon response.
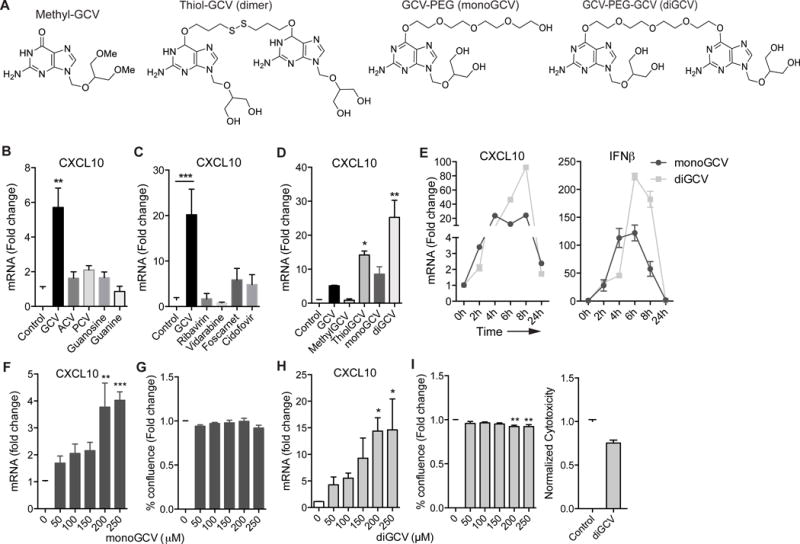
(A) Structures of GCV derivatives. (B-D) BV-2 cells were treated with indicated compounds for 24h and CXCL10 mRNA was quantified by qRT-PCR. (E) Time course for the induction of CXCL10 and IFNβ mRNA in BV-2 cells treated with monoGCV and diGCV. (F-I) Dose curves depicting CXCL10 induction by qRT-PCR, cell viability and cytotoxicity (I, right) in BV-2 cells treated with monoGCV (F-G) and diGCV (H-I) for 24h. Fold change is based on control treatment for each genotype. All monoGCV and diGCV treatments were with 200μM unless otherwise noted. Statistical tests: one-way ANOVA followed by Dunnett’s multiple comparison test (B-H), unpaired Student’s t-test (I, right). Bars represent mean + SEM from 3 independent experiments. *P < 0.05, **P < 0.01, *** P < 0.001, ****P < 0.0001.
Interferons activate the Jak/Stat signaling pathway to induce CXCL10 (Liu et al., 2011), and we observed that GCV and diGCV similarly depend on this pathway (Figure 3). Specifically, the Stat1 inhibitor Fludarabine (Frank et al., 1999) or the Jak kinase inhibitors Ruxolitinib and TG101348 (Zhou et al., 2014) strongly inhibited CXCL10 production in response to GCV and diGCV (Figure 3A, F) without causing toxicity (Figure 3B, G). Likewise, siRNA knockdown of Stat1 and Jak1, but not TLR3, reduced GCV activity (Figure 3C, H, I). Primary microglia from Stat1 KO mice also significantly reduced CXCL10 or IFNβ mRNA induction by GCV, monoGCV and diGCV (Figure 3D). Additionally, the ability of GCV to suppress the inflammatory marker iNOS, was dependent on Stat1 (Figure 3E). GCV and it’s derivatives might activate the Jak/Stat pathway either directly or through the production and autocrine signaling of IFNβ through subsequent feedback loops activating other pattern recognition receptors (Figure 4A). Indeed, neutralization of IFNβ with an antibody partly reduced CXCL10 induction mRNA by GCV, monoGCV or diGCV in BV-2 cells (Figure 3J).
Figure 3. Jak-Stat signaling through IFNβ is required for GCV activity.
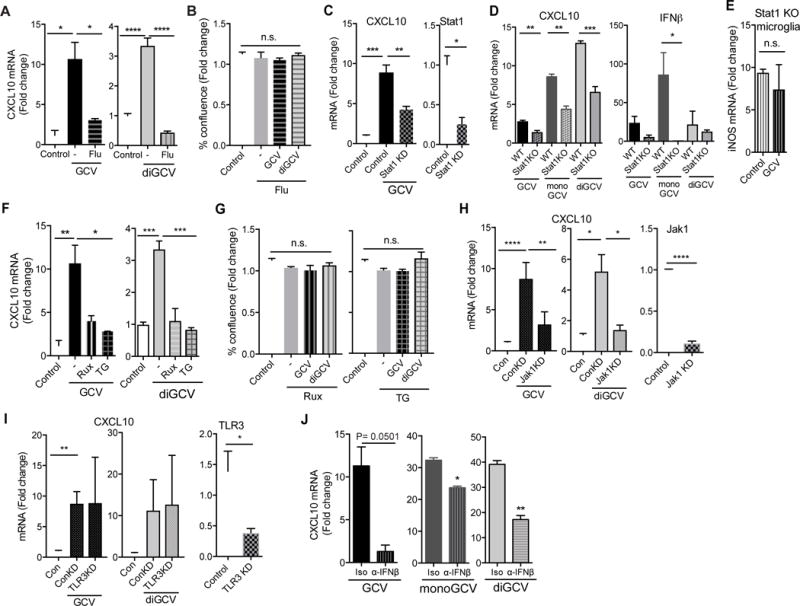
(A-B) BV-2 cells were treated with GCV or diGCV along with 10μM Fludarabine for 24h. mRNA fold change were analyzed by qRT-PCR (A) and toxicity was assessed using an automated cell counter (B). (C) BV-2 cells were transfected with control or Stat1 siRNA for 24h and then stimulated with GCV for another 24h. CXCL10 mRNA fold change (left) and efficiency of knockdown (right) are shown. (D-E) Primary microglia from wild type (WT) and Stat1 knockout (Stat1 KO) mice were treated with GCV, monoGCV or diGCV for 6h (D) or with IFNγ/LPS with or without GCV for 24h (E). Indicated transcripts were analyzed by qRT-PCR. (F-G) BV-2 cells were treated with GCV or diGCV along with 1μM Ruxolitinib (Rux) or TG101348 (TG) for 24h. mRNA (F) and toxicity (G) are shown. (H-I) BV-2 cells were transfected with control, Jak1 (H) or TLR3 (I) siRNA for 24h and then stimulated with GCV or diGCV for another 24h. CXCL10 mRNA fold change (left) and efficiency of knockdown (right) are shown. (J) BV-2 cells were treated with GCV, monoGCV or diGCV with anti-IFNβ antibody (α-IFNβ) or isotype (Iso) control for 4h and mRNA quantified. Drug treatments were with 200μM unless otherwise noted. Statistical tests: one-way ANOVA followed by Dunnett’s multiple comparison test (A-C, F-I) or unpaired Student’s t-test (C right, D, H right, I right, J). Bars represent mean + SEM from 3 (cell lines) or 2 (primary cells) independent experiments. *P < 0.05, **P < 0.01, *** P < 0.001, ****P < 0.0001.
Figure 4. STING pathway is required for GCV activity in microglia.
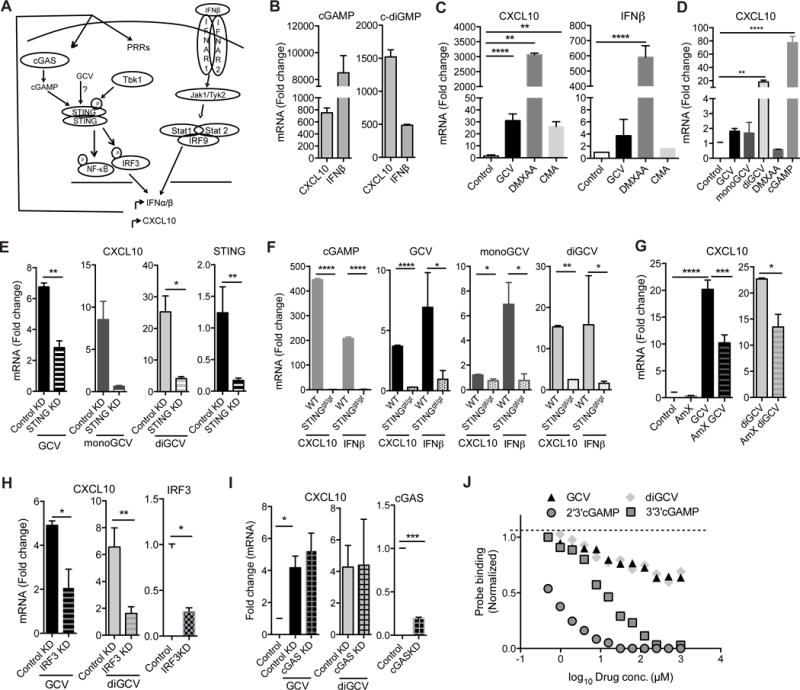
(A) Schematic showing STING induces IFNβ via Tbk1 and IRF3 and further activation of Jak/Stat signaling activates antiviral interferon response. PRR, pattern recognition receptors. (B-D) BV-2 (B, C) and THP-1 (D) cells were treated with the drugs for 24h and 8h respectively and indicated transcripts were quantified. (E) STING was knocked down in BV-2 cells using siRNA for 24h. Cells were then stimulated with GCV, monoGCV or diGCV for additional 24h. Fold change in CXCL10 mRNA (left) and efficiency of STING knockdown (right) is shown. (F) Primary microglia from wild type or STINGgt/gt mice were treated with cGAMP, GCV, monoGCV and diGCV for 6h and indicated transcripts were analyzed. mRNA fold change was determined by qRT-PCR. (G) BV-2 cells were treated with GCV or diGCV along with Tbk1 inhibitor Amlexanox (AmX, 1μM) for 24h and CXCL10 mRNA was quantified. (H-I) IRF3 (H) or cGAS (I) were knocked down in BV-2 cells using siRNA for 24h. Cells were then stimulated with GCV or diGCV for additional 24h. Fold change in CXCL10 mRNA (left) and efficiency of knockdown (right) is shown. GCV and diGCV treatments were with 200μM drugs. (J) Competition binding assay using 500 pM 35S-labeled 2′3′-cGAsMP probe showing that 2′3′-cGAMP and 3′3′-cGAMP, but not GCV and diGCV, dose dependently compete with 2′3′-cGAsMP for binding to 100nM mSTING. Statistical tests: one-way ANOVA followed by Dunnett’s multiple comparison test (C-D) or unpaired Student’s t-test (E-I). mRNA fold change was determined by qRT-PCR. Bars represent mean + SEM from 3 (cell lines) or 2 (primary cells) independent experiments. *P < 0.05, **P < 0.01, *** P < 0.001, ****P < 0.0001.
Recent studies have shown that upon sensing exogenous dsDNA in the cytoplasm, the enzyme cyclic GMP-AMP synthetase (cGAS) catalyzes formation of 2′3′-cyclic-GMP-AMP (cGAMP, structure in Figure S3), which subsequently induces a potent interferon response (Hornung et al., 2014; Ishikawa et al., 2009). Cyclic dinucleoside monophosphates (e.g. c-di-GMP, structure in Figure S3) can induce a similar response (Chin et al., 2013). These dinucleotides activate the ER membrane adapter protein STING which then activates TANK binding kinase 1 (Tbk1), NF-κB and IRF3 (Barber, 2015; Ishikawa and Barber, 2008) and downstream effector genes including IFNβ and CXCL10 (Figure 4A). Accordingly, and in line with previous studies (Gao et al., 2013), cGAMP and c-diGMP strongly induced CXCL10 and IFNβ in microglia (Figure 4B), as did the reported STING agonists, DMXAA and CMA (Cavlar et al., 2013; Gao et al., 2013; Prantner et al., 2012) (Figure 4C). GCV and diGCV also induced CXCL10 in the human monocyte cell line THP-1, while DMXAA, which is specific for mouse STING (Conlon et al., 2013), did not (Figure 4D). Due to its apparent structural similarity, we hypothesized that diGCV, and possibly GCV cellular metabolites, may mimic cyclic dinucleotides and activate the STING pathway.
Excitingly, siRNA mediated knock down of STING in BV-2 cells largely abrogated the capacity of diGCV and, to a lesser extent, monomeric GCV to induce CXCL10 (Figure 4E). Moreover, primary microglia from STINGgt/gt mice that lack functional STING protein (Sauer et al., 2011) and do not respond to cGAMP, failed to induce CXCL10 and IFNβ mRNA in response to GCV, monoGCV and diGCV (Figure 4F). Consistent with GCV targeting the STING pathway, pharmacological inhibition of Tbk1 activity using the antagonist Amlexanox and siRNA-mediated knockdown of IRF3 inhibited the capacity of monomeric and dimeric GCV to induce CXCL10 mRNA (Figure 4G-H). Furthermore, siRNA mediated knockdown of the upstream activator cGAS did not affect the activity of GCV and diGCV to induce CXCL10 (Figure 4I). These data, in aggregate, show that, like the reported STING agonists (Burdette et al., 2011; Cavlar et al., 2013; Gao et al., 2013), the ability of GCV and it’s derivatives to induce a type I interferon response in microglia-like cells requires a functional STING pathway and downstream Jak/Stat signaling. Native GCV and diGCV molecules showed very weak binding to purified mouse STING protein (Figure 4J). The possibilities that these molecules are prodrugs, which are modified intracellularly to be active, or that they bind to another target in the STING pathway remain to be elucidated.
To determine the involvement of STING in regulating microglial reactivity and neuroinflammation in vivo, we induced the autoimmune disease EAE in wild type (WT) and STINGgt/gt mice and treated them with GCV (Figure 5A). We found STING was specifically expressed in microglia and not detectable in other CNS cell types using immunohistochemistry (Figure 5B and S4). Interestingly, EAE induction led to a dramatic increase in STING expression in Iba1+ myeloid cells as well as Tmem119+ microglia, and GCV reversed this phenotype almost completely (Figure 5B). We next asked if STING was required for the therapeutic effects of GCV in the EAE mouse model. As we previously reported (Ding et al., 2014), GCV drastically reduced disease severity in WT mice in three independent experiments (Figure 5C), lowering disease incidence by 60-70% (Figure 5D) and lethality from 20% to 0% (Figure 5E). Whereas mice lacking STING showed a very similar disease course to WT mice (Figure 5C-E), GCV failed to significantly reduce disease severity (Figure 5C), incidence (Figure 5D) and lethality (Figure 5E) in STINGgt/gt mice at advanced stages of disease. However, during the early phase of disease, GCV only partially ameliorated EAE possibly due to compensatory mechanisms and other unknown complexities of EAE progression in STINGgt/gt mice. It was shown that STINGgt/gt mice exhibit attenuated EAE development compared to WT mice (Lemos et al., 2014). We hypothesize that the intermediate effect on EAE scores by GCV in STINGgt/gt mice is due to this slow and possibly altered EAE pathology. In support of this, STINGgt/gt mice with EAE show higher numbers of proliferating cells overall (Figure 5F), proliferating T-cells (Figure 5K, S6E) and activated microglia (Figure 6C).
Figure 5. STING is required for inhibition of inflammation in EAE by GCV.
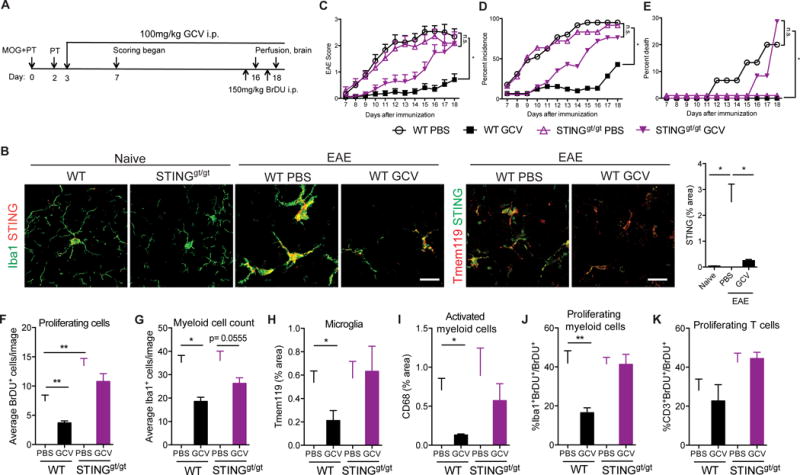
(A) Schematic showing the experimental design. (B) Representative merged images showing STING expression in Iba1 and Tmem119 expressing cells in the hippocampus (Naïve) or cerebella (EAE) of mice. Bar graph shows quantification of STING expression. Scale bar = 20μm. EAE score (C), percent incidence (D) and percent death (E) is depicted for indicated groups. Data are cumulative of 3 independent experiments (n= 25-32 mice/group). (F-K) Quantification of average number of BrDU+ proliferating cells (F), Iba1+ myeloid cells (G), Tmem119 expression (H), CD68 expression (I) percent Iba1+BrDU+ proliferating myeloid cells (J) and CD3+BrDU+ proliferating T-cells (K). For histology, n= 6-10 mice/group. Bars represent mean + SEM. Statistical tests: Two- way ANOVA followed by Sidak’s multiple comparisons test between indicated groups. *P < 0.05, **P < 0.01, *** P < 0.001, ****P < 0.0001.
Figure 6. GCV reduces CD45hi myeloid and microglial cells in wild type, but not STINGgt/gt, mice with EAE.
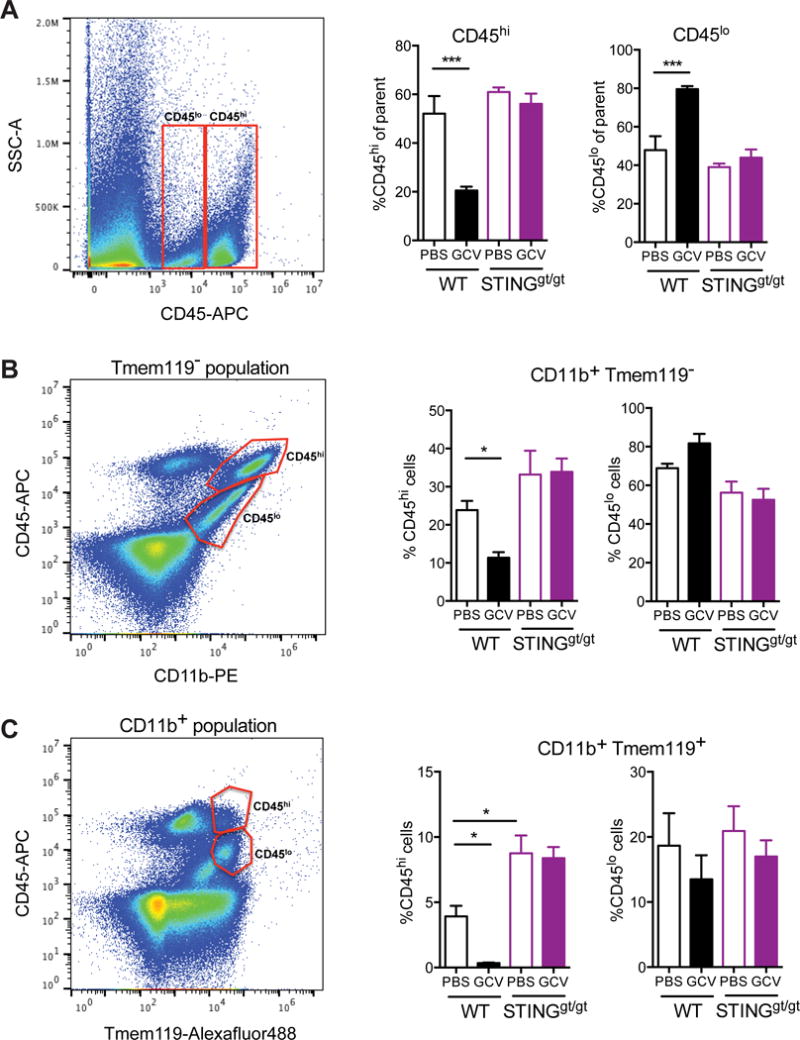
Flow cytometry analysis of CD11b, CD45 and Tmem119 in isolated microglia from the cerebella of wild type and STINGgt/gt EAE mice treated with GCV. Left shows representative flow dot plots. Right shows the quantification of CD45hi and CD45lo populations (A) in CD11b+ Tmem119− cells (B) and CD11b+ Tmem119+ microglia (C). n= 3-4 mice/group. Bars represent mean + SEM. Statistical tests: Two- way ANOVA followed by Sidak’s multiple comparisons test between indicated groups. *P < 0.05, **P < 0.01, *** P < 0.001, ****P < 0.0001.
Consistent with our published data (Ding et al., 2014), GCV significantly decreased numbers of BrDU+ and PCNA+ proliferating cells (Figure 5F and S5), Iba1+ myeloid cells (Figure 5G), Iba1+BrDU+ and Iba1+PCNA+ proliferating myeloid cells (Figure 5J and S5), but did not change CD3+BrDU+ proliferating T-cells (Figure 5K) in cerebella and spinal cords (Figure S6) of WT mice with EAE. GCV treatment did not increase the number of cleaved Caspase 3+ cells (Figure S7), suggesting that the inhibition of myeloid proliferation by GCV was not due to induction of apoptosis. Additionally, GCV treated WT EAE mice showed reduced expression of the microglia specific marker Tmem119 (Figure 5H, S4B, S8) and the microglial activation marker CD68 (Figure 5I and S8). In stark contrast, and in agreement with the preclinical data above, GCV treated STINGgt/gt mice with EAE showed no reduction in overall cell proliferation (Figure 5F, S5, S6), Tmem119 expression (Figure 5H), myeloid cell activation (Figure 5I), proliferating myeloid cells (Figure 5J, S5, S6) or T-cells (Figure 5K, S6).
To deduce if this effect of GCV on EAE was due to inhibition of infiltrating myeloid cells or resident CNS microglia, we isolated CD11b+ myeloid cells from the cerebella of WT and STINGgt/gt mice, with or without EAE, and analyzed CD45 immunoreactivity (Figure 6). GCV treatment reduced total CD45hi (Figure 6A) and CD11b+CD45hi (Figure 6B) activated myeloid cells as well as Tmem119+CD45hi activated microglia (Figure 6C) in wild type EAE, but not in STINGgt/gt mice, suggesting that GCV exerts its effects on both the infiltrating (Tmem119−, CD45hi) as well as resident microglia in the CNS (Tmem119+). Interestingly, STINGgt/gt mice with EAE had twice as many proliferating cells as wild type mice (Figure 5F), and GCV showed a trend towards reducing overall Iba1, CD68 and CD45hi immunoreactivity (Figure 5G, 5I, 6C), suggesting an altered EAE pathology in these mice.
Finally, to elaborate these anti-inflammatory effects of GCV, we isolated CD11b+Tmem119+ microglia (Figure 7A) from GCV treated WT and STINGgt/gt mice with EAE and analyzed them by RNA-sequencing. Unsupervised clustering of significantly changed genes, segregated GCV treated WT microglia from the other groups (Figure 7B-C). Most significant differences were found between WT PBS and GCV treated microglia (Table S2) and they were all STING-dependent (Figure 7D), thus supporting our finding that GCV requires STING to regulate microglial activity. The most significantly modulated genes by GCV in microglia from WT mice with EAE (Figure 7E) are known to be associated with inflammation (Alox5, Faim3, Ctsb, Lyz1, Clec2i, Apoe), small molecule transport (Sidt1, Fabp5, Slc25a31) and G-protein coupled receptors (F2rl2). Inflammatory response was the most significant GO term associated with GCV vs PBS WT microglia from mice with EAE (Figure 7F). Interestingly, some genes e.g. Ctsb, Apoe, Lyz1, that were significantly down-regulated with GCV treatment, were recently described as disease associated microglia (DAM) genes in microglia from Alzheimer’s and ALS mouse models (Keren-Shaul et al., 2017). We compared DAM genes to an independent RNA-seq study from microglia in diseased EAE mice (Lewis et al., 2014) and found that the majority of DAM genes were also upregulated in microglia from EAE mice. Further analysis of most differentially expressed DAM genes in our study showed that GCV down-regulated these genes in WT, but not in STINGgt/gt, microglia from mice with EAE (Figure 8A-C). Additionally, there was an overall increase in homeostatic microglia genes with GCV treatment (Figure 8D). Type I interferon transcripts were undetectable in the RNA-seq dataset. However, microfluidic array on mRNA from cerebella of EAE mice showed an increase in type I interferons and confirmed the down-regulation of inflammatory microglial transcripts observed by RNA-seq in WT mice treated with GCV (Figure S9). Thus, we conclude that GCV induces low therapeutic levels of IFNs and results in down-regulation of disease-associated genes in a STING dependent way, thereby reducing inflammation.
Figure 7. RNA-seq on microglia from mice with EAE shows Ganciclovir inhibits inflammation in a STING- dependent manner.
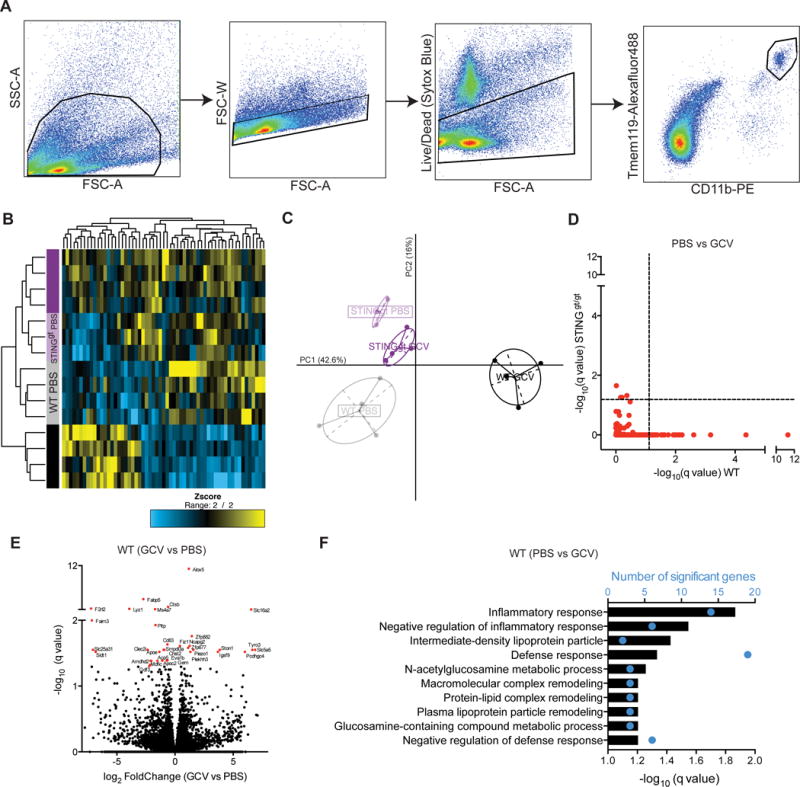
(A) Flow sorting scheme for isolation of CD11b+Tmem119+ cells from mice with EAE. (B) Heatmap showing significant genes (q<0.05) between at least two groups (n= 3-4 mice/group). (C) Principal component analysis (PCA) using significant genes. (D) –log10 q-value plots from WT and STINGgt/gt PBS vs GCV differential expression comparison. Dashed line indicates q= 0.05. (E) Volcano plot showing differentially expressed genes in WT GCV vs WT PBS microglia from mice with EAE. (F) Gene ontology (GO) terms associated with top 100 differentially expressed genes ranked by q-value in WT PBS vs GCV comparison.
Figure 8. Ganciclovir treatment reduces the expression of top disease associated genes in microglia from mice with EAE.
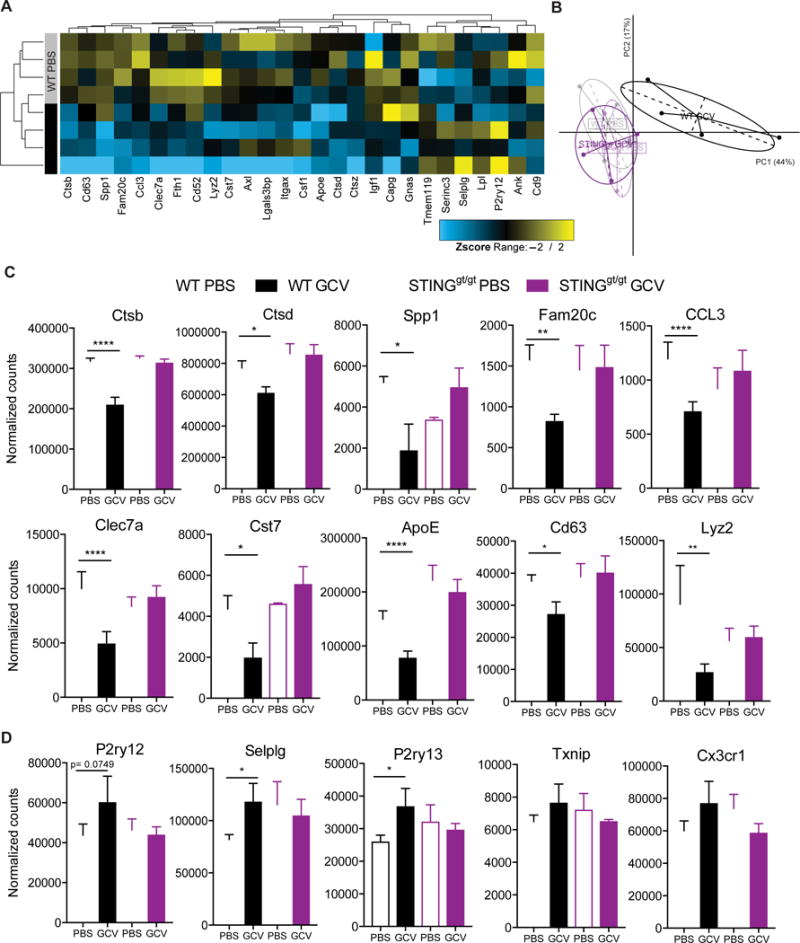
(A) Heatmap shows differential expression of top disease associated microglia genes in WT PBS vs GCV groups. The genes with –log10 (p-value) >20 for homeostatic to DAM (AD and ALS) comparisons are represented (n= 27). (B) Principal component analysis (PCA) of top disease associated microglia genes shows distinct clustering of GCV treated WT microglia. (C-D) Individual plots of normalized counts from RNA-seq data showing down-regulation of disease associated inflammatory genes (C) and an increase in homeostatic genes (D) by GCV in WT but not STINGgt/gt microglia. Bars represent mean + SEM. Statistical tests: Differential expression analysis based on the negative binomial distribution using DEseq2. *P < 0.05, **P < 0.01, *** P < 0.001, ****P < 0.0001.
Discussion
In aggregate, these studies show that GCV reduces EAE in a STING dependent fashion similar to DNA nanoparticles, which were recently shown to attenuate EAE (Lemos et al., 2014). STING is highly regulated in microglia in vivo and activation of the STING pathway reduces microglial reactivity and the neuroinflammatory disease EAE. Since excessive IFN production is linked to interferonopathies such as STING-Associated Vasculopathy with onset in Infancy and Aicardi Goutières syndrome (Rodero and Crow, 2016), it will be important to find the optimal therapeutic levels to activate the STING pathway in a beneficial way.
Ganciclovir is a widely used antiviral drug and a close analog of Acyclovir, the first successful antiviral drug, described in 1977 to exploit viral thymidine kinase activity and inhibit viral replication (Elion et al., 1977). After decades of highly effective use in humans, our study uncovered a remarkable non-canonical activity of GCV, but not Acyclovir, which involves the innate immune receptor STING and a stereotypical cellular antiviral program. We show that GCV can exhibit dual function in microglia (Figure S10): in naïve state, GCV induces microglia to be “primed”; on the other hand, GCV reduces inflammation in active microglia. We propose that GCV pushes microglia towards a primed state. This multi-modality of GCV is unique and may, in part, be responsible for the continued strong success of GCV (and its pro-drug Valganciclovir), in spite of many newer antiviral drugs. Lower doses of GCV elicited little to no effect in CNS demyelination and viral disease models in mice (Skripuletz et al., 2015) suggesting appropriate dosing is necessary for the novel properties observed here. Alternatively, it is also possible that GCV does not cross the blood-brain barrier or is functional specifically in the EAE mouse model.
Because of its growing relevance not only in anti-viral immune responses but possibly in sensing mitochondrial damage as well (West et al., 2015), STING has become an attractive target for drug development itself (He et al., 2015). In addition, mutations in STING are associated with vascular and pulmonary syndrome (Liu et al., 2014) and other autoimmune diseases (Jeremiah et al., 2014; Sharma et al., 2015), STING-IRF3 stress is associated with alcohol liver disease (Petrasek et al., 2013), and haploinsufficiency in the STING activating kinase Tbk1 is associated with ALS and FTD (Freischmidt et al., 2015; Pottier et al., 2015). Our findings that GCV, and GCV dimers in particular, activate a type I interferon response in a STING dependent way and reduce microglial proliferation and neuroinflammation in vivo open the possibility to develop a new class of drugs to treat neurodegenerative and related diseases where neuroinflammation has been implicated.
STAR Methods
CONTACT FOR REAGENT AND RESOURCE SHARING
Further information and requests for resources and reagents should be directed to the Lead Contact, Tony Wyss-Coray (twc@stanford.edu).
EXPERIMENTAL MODEL AND SUBJECT DETAILS
EAE induction and analysis
EAE was induced in 2-3 months old C57BL/6 wild type and STINGgt/gt female mice as described (Ding et al., 2014). Briefly, mice were immunized subcutaneously with 200μg mouse MOG35-55 peptide (Stanford PAN facility) emulsified in CFA (200μg M. tuberculosis, Difco adjuvants, BD) and injected intravenously with 100ng pertussis toxin (List Biological Laboratories, Inc.) at 0h and 48h of immunization. Mice were weighed and scored for clinical signs of EAE daily: 0, no paralysis; 1, loss of tail tone; 2, hind limb weakness or paresis; 3, hind limb paralysis; 4, hind limb paralysis and forelimb paresis; 5, moribund or dead. When a mouse died from the disease, it was given a score of 5 that day and subsequently removed from scoring. All mice with or without disease are included in the graphs shown. GCV (100mg/kg) or phosphate buffered saline (PBS) vehicle control were intra-peritoneally injected everyday starting 3 days after immunization till the end of the experiment. BrDU (150 mg/kg) was intra-peritoneally injected 1 day before sacrifice. GCV administration in adults and children ranges from a daily oral dose of up to 4g or multiple daily intravenous doses of 5 mg/kg (Faulds and Heel, 1990). In this study, we used GCV concentrations that are used to treat patients in clinic, adjusted with a factor of 12.3 for human to mouse dose conversion (U.S. Department of Health and Human Services, 2005), and are below the reported median inhibitory concentration.
Cell culture
BV-2 female mouse microglia-like cells were grown in DMEM + 10% FBS, and THP-1 male human monocyte cells were grown in RPMI-40+ 10% FBS+ 0.05mM β-mercaptoethanol at 37°C, 5% CO2. Adherent cells were split using 1X TrypLE (Gibco). For cellular assays, cells were treated with the following concentrations of drugs, unless otherwise noted, in DMEM (for BV-2) or RPMI-40 (for THP-1) without serum: 100-200μM ganciclovir, 10ng/ml IFNγ (R&D systems), 100ng/ml LPS (Sigma-Aldrich), 10μM Fludarabine (Selleckchem), 1μM Ruxolitinib (Selleckchem), 1μM TG-101348 (Selleckchem), 1μM Amlexanox (Tocris bioscience). Secreted signaling proteins were measured in conditioned culture supernatants from BV-2 cells stimulated with GCV for 24h in the absence of serum using two independent Luminex arrays (Human Immune Monitoring Center, Stanford University and Eve technologies, Canada). Nitrite assay was performed on conditioned culture supernatants of cells stimulated with drugs for 24h using the Griess Reagent System (Promega) according to manufacturer’s instructions. To assess cell viability, cell confluence was measured using an automated microscope (Cellavista; Roche). Toxicity was measured using Celltox Green cytotoxicity assay (Promega). All experiments were run in triplicates and replicated at least 3 times with cell lines and at least twice with primary microglia.
Primary microglia and iMGL culture
Mice were housed, bred and handled according to the Institutional Animal Care and Use Committee guidelines. Primary microglia were isolated from 2-3 months old C57BL/6 wild type male mice forebrains using the neural dissociation kit (P) followed by CD11b magnetic bead enrichment (Miltenyi Biotec) according to manufacturer’s protocol. Isolated cells were cultured at a confluent density in DMEM/F12 + 10% FBS + 1% penicillin/streptomycin for 3-4 days before the experiment.
Primary microglia and astrocytes from P0-P3 C57BL/6 mouse pups (male and female) were isolated from cortices, meninges removed and tissue dissociated using a 25-gauge needle. Two cortices were plated on each poly-L-lysine coated T-75 flasks in DMEM/F12 + 10% FBS + 1% penicillin/streptomycin. Microglia and astrocyte co-cultures were maintained for 3 weeks, after which microglia were isolated using CD11b magnetic beads. Isolated microglia were allowed to recover for 1-2 days and processed for cellular assays.
Human iMGLs were derived from human induced male Hematopoietic Progenitor Cells (iHPCs) as described (Abud et al., 2017). All stem cell work was performed with approval from UC Irvine Human Stem Cell Research Oversight and IBC committees. CD34+ human iHPCs (Cellular Dynamics International) were differentiated to iMGLs using differentiation medium for 25 days and matured in maturation medium for additional 3 days as described (Abud et al., 2017). iMGLs were treated with 200μM GCV for 24h in iMGL media and processed for RNA or protein extraction.
METHOD DETAILS
RNA preparation and quantitative real time PCR
For standard quantitative real time PCR (qRT-PCR), RNA was isolated from cells using RNeasy mini kit (Qiagen). DNased RNA was converted to cDNA using SuperScript III reverse transcriptase kit (Life technologies). cDNA was used to quantify specific targets using SYBR green in Roche Lightcycler 480. β-actin or Ubc or both were used as housekeeping genes. Primer sequences were obtained from Harvard PrimerBank (Table S3). Fold change in transcripts was calculated using ΔΔCt values based on the experimental controls. Figures depict fold change compared to the vehicle treated or untreated cells, unless otherwise noted.
For microfluidic qRT-PCR, a primer-pair panel was designed consisting of 86 microglia and other cell type specific genes + 10 house keeping genes (Table S1). The experiment was done as described (Liddelow et al., 2017). cDNA was made and pre-amplified from ~100ng RNA using pre-amplification and reverse transcription kits from Fluidigm using the manufacturer’s protocol and diluted 1:5 fold. Sample mix and assay mix were made according to manufacturer’s instructions and loaded on 96.96 Dynamic Array Chip (Fluidigm). The chip was then loaded and mixed using NanoFlexTM 4-IFC Controller (Fluidigm), followed by processing and data collection on BioMark Real-Time PCR System (Fluidigm). Fold change was calculated using ΔΔCt as described above.
siRNA knockdown
Smartpool siRNAs for specific targets were bought from Dharmacon and transfected in microglia-like cells using Viromer Blue (Lipocalyx) at a concentration of 50nM according to manufacturer’s instructions. After 24h of transfection, cells were treated with drugs for additional 24h and then processed for analysis.
Tissue preparation, histology and imaging
Mice were anesthetized using Avertin (Tribromoethanol) and perfused by cardiac puncture. Hemibrains and spinal cords were extracted, fixed in 4% paraformaldehyde for 48h, cryoprotected in 30% sucrose and then sectioned sagitally or coronally (40μm) using a freezing microtome (Leica). Immunohistochemistry was done on 3-4 free-floating sections per mouse, according to standard procedures. Primary antibodies were against BrDU (1:2,000, Abcam), Iba1 (1:1,000; Wako Chemicals USA; 1:1000, Abcam), CD3 (1:1,000, BD Biosciences), Tmem119 (gift from Ben Barres lab), CD68 (1:600, Biorad), PCNA (1:500, Dako) and Cleaved Caspase3 (1:500, Cell Signaling Technologies). Sections were treated in 3M HCl for 30 min at 37°C for BrDU antigen retrieval. Citrate antigen retrieval (pH 6.0) was done at 80°C for 20 minutes for Iba1 (Abcam), PCNA and Cleaved Caspase3. Secondary antibodies were Alexa Fluor 488, 555, 594, 647 (1:500, Life technologies). Z-stacks of images were taken on confocal microscope (Zeiss LSM700/880). Double positive cells were counted and images were analyzed using ImageJ.
Flow cytometry
All procedures were carried out at 4°C. For Figure 6, upon reaching disease score of 2 or more, mice were perfused, cerebella from hemi brains of mice were chopped and homogenized using a Dounce homogenizer in 2ml cold Medium A (HBSS+ 15mM HEPES+0.05% glucose+ 1:500 DnaseI), filtered through 100μm cell strainer, rinsed with 5ml Medium A and centrifuged at 340g for 5 mins. For myelin removal, the precipitate was resuspended in 25% standard isotonic percoll (25% Percoll in PBS, diluted with Medium A) and centrifuged at 950g for 20 mins. Precipitated cells were washed with FACS buffer (PBS+1% BSA+2mM EDTA) twice and stained with 1:100 CD11b-PE, 1:100 CD45-APC and 16μg/ml rabbit anti-mouse Tmem119 antibodies (85-5 and 106-6, gifts from Ben Barres lab) for 30 mins at room temperature, followed by 1:500 donkey anti-Rabbit-Alexafluor488. Cells were washed and analyzed on BD AccuriC6 flow cytometer.
For RNA sequencing, EAE was induced as above and mice were sacrificed when control treated group reached EAE score of 2 or higher. Cerebella were homogenized using the method described above and CD11b+Tmem119+ microglia (~20,000 per sample) were FACS sorted into 500μl RLT buffer (Qiagen) and stored on −80°C.
STING binding assay
For the nitrocellulose membrane-binding assay, 35S-labeled 2′3′-cGAsMP was used as a probe (Li et al., 2014). Negatively charged 2′3′-cGAMP and its analogs do not bind the membrane unless they are bound to proteins. 35S-labeled 2′3′-cGAsMP (500 pM) was mixed with 100nM mSTING and bound to the membrane. Different small molecules were then titrated to compete with the probe. The autoradiography signals were analyzed using ImageJ.
RNA sequencing
RNA was extracted from isolated microglia using RNeasy Plus Micro kit (Qiagen) and the quality assessed by Agilent 2100 Bioanalyzer (Stanford PAN facility). About 1ng RNA was converted to cDNA and amplified for 12 cycles using SMART-seq v4 Ultra Low input RNA kit for sequencing (Takara Bio USA, Inc.) according to manufacturer’s instructions. Amplified cDNA was then purified by immobilization on AMPure XP beads. Purified cDNA was normalized and tagmented for 5 mins using Nextera XT DNA library prep kit (Illumina). Unique indexes were then added to each sample, which were then amplified for 12 cycles. cDNA was purified using AMPure XP beads and quality assessed by Advanced Analytical Fragment Analyzer (Stanford PAN facility). Samples were then normalized and pooled together and sequenced on Illumina Novaseq 6000 (Novogene Corporation Inc.) to obtain 150bp paired-end reads.
The quality of fastq files was assessed using FASTQC (v 0.11.4) (Andrews, 2010). Reads were trimmed to 75bp using fastX toolkit (v 0.0.14) (http://hannonlab.cshl.edu/fastx_toolkit/) to remove poor quality segments towards the end of the reads. Trimmed reads were mapped to mouse mm9 reference genome using STAR (v 2.5.1b) (Dobin et al., 2013). Raw read counts were generated with STAR using the GeneCounts function.
QUANTIFICATION AND STATISTICAL ANALYSIS
The following statistical tests (Prism 7) were used unless otherwise noted. Two groups were compared using unpaired Student’s t-test. One-way ANOVA followed by Dunnett’s multiple comparison test was used for drug treatment experiments with more than one drug, and all treatments were compared to vehicle treated controls. Two-way ANOVA followed by Sidak’s multiple comparisons was used for experiments with two genotypes and two treatment conditions. For all figures *P < 0.05, **P < 0.01, *** P < 0.001, ****P < 0.0001.
RNA-seq differential expression
Differential expression in RNA-Seq was analyzed using the R DESeq2 package (Love et al., 2014). Read counts were used as input and normalized using built-in algorithms in DESeq2. Pairwise comparisons among the 4 groups were done on all genes and 16570 genes with calculable fold changes (FC) and false discovery rates (fdr) were used for further analysis. Only the genes differentially expressed in at least one comparison (q<0.05, n= 59) were included in the Principal Component Analysis (PCA) and in the hierarchical clustering. Normed PCA and hierarchical clustering were performed on rlog-transformed data using the ade4 (Dray and Dufour, 2007) and gplots (Warnes et al.) R packages, respectively. False discovery rate was estimated using Benjamini and Hochberg approach (Benjamini and Hochberg, 1995).
Gene Ontology (GO) analysis
Gene Ontology terms defined the gene product properties and covered three domains: cellular component; molecular function and biological process.
For RNA-seq GO analysis, genes were ranked based on the p-value of the differential expression analysis between WT PBS and WT GCV. Enrichment for GOs terms within the top 100 genes was tested with the topGO R package using the 16570 genes kept in the analysis as the background (Alexa and Rahnenfuhrer, 2010).
For microfluidic RT-PCR in primary microglia, the GO analysis was performed to identify GO terms with over-representation of genes when the genes upregulated with GCV (log2 fold change > 0.1) were compared to all the genes measured by the Fluidigm platform (83 genes).
DATA AND SOFTWARE AVAILABILITY
Table S2 summarizes differentially expressed genes with p- and q- values from RNA-seq dataset between WT PBS vs WT GCV, WT PBS vs STINGgt/gt PBS, and STINGgt/gt PBS vs STINGgt/gt GCV.
Raw and normalized RNA sequence data can be obtained at NCBI. The GEO Accession Series record number for the data reported in this paper is GSE106692.
Supplementary Material
Table S1. Related to Figure 1. Microfluidic panel gene list with 86 microglia related genes and 10 house-keeping genes. Log2Fold change (GCV/Control) for each gene in primary microglia is listed.
Table S2. Related to Figure 7. RNA-seq analysis showing log2fold change, p-value and false discovery rate (FDR or q-value) for three different comparisons: WT GCV vs WT PBS (Sheet 1), STINGgt/gt PBS vs WT PBS (Sheet 2), STINGgt/gt GCV vs STINGgt/gt PBS (Sheet 3).
Table S3. Related to STAR Methods. RT-PCR primers used in this study. All sequences were obtained from Harvard Primer Bank.
Highlights.
Ganciclovir induces type I interferon signaling and modulates microglial reactivity.
Microglial reactivity is associated with upregulation of innate immune adaptor STING.
Ganciclovir inhibits microglial inflammation in EAE mouse model through STING.
Acknowledgments
We thank Dr. Jian Luo, Dr. Hui Zhang, Dr. Mike Betley, Jadon Shen and Betty Chang for experimental support, and members of the Wyss-Coray lab for helpful discussions and reading of the manuscript. We thank Mariko Bennett and Ben Barres for providing Tmem119 antibodies. This work was funded by the Bluefield Project to Cure Frontotemporal Dementia Postdoctoral Fellowship (V.M.), the Department of Veterans Affairs (T.W.-C.), and the National Institute on Aging (AG045034; T.W.-C.). Based on this study, V.M., R.B., H.A.L. and T.W.-C. were issued US patent number 9,809,597.
Footnotes
Publisher's Disclaimer: This is a PDF file of an unedited manuscript that has been accepted for publication. As a service to our customers we are providing this early version of the manuscript. The manuscript will undergo copyediting, typesetting, and review of the resulting proof before it is published in its final citable form. Please note that during the production process errors may be discovered which could affect the content, and all legal disclaimers that apply to the journal pertain.
Author Contributions
V.M. and T.W.-C. conceptualized and designed the study, analyzed and interpreted data and wrote the manuscript. V.M., R.T.V., L.N.B., M.Z., D.D., K.N.M., S.E.M., E.M.A. and L.L. acquired the data. R.B. and H.A.L. designed and produced the new GCV derivatives. B.L. analyzed RNA-sequencing data. M. B.-J. provided iMGLs. All authors reviewed the manuscript.
References
- Abud EM, Ramirez RN, Martinez ES, Healy LM, Nguyen CHH, Newman SA, Yeromin AV, Scarfone VM, Marsh SE, Fimbres C, et al. iPSC-Derived Human Microglia-like Cells to Study Neurological Diseases. Neuron. 2017;94:278–293 e279. doi: 10.1016/j.neuron.2017.03.042. [DOI] [PMC free article] [PubMed] [Google Scholar]
- Ahn J, Konno H, Barber GN. Diverse roles of STING-dependent signaling on the development of cancer. Oncogene. 2015 doi: 10.1038/onc.2014.457. [DOI] [PMC free article] [PubMed] [Google Scholar]
- Alexa A, Rahnenfuhrer J. topGO: enrichment analysis for gene ontology. R package version 2.16.0 2010 [Google Scholar]
- Andrews S. FastQC: a quality control tool for high throughput sequence data 2010 [Google Scholar]
- Barber GN. STING: infection, inflammation and cancer. Nat Rev Immunol. 2015;15:760–770. doi: 10.1038/nri3921. [DOI] [PMC free article] [PubMed] [Google Scholar]
- Baruch K, Deczkowska A, David E, Castellano JM, Miller O, Kertser A, Berkutzki T, Barnett-Itzhaki Z, Bezalel D, Wyss-Coray T, et al. Aging. Aging-induced type I interferon response at the choroid plexus negatively affects brain function. Science. 2014;346:89–93. doi: 10.1126/science.1252945. [DOI] [PMC free article] [PubMed] [Google Scholar]
- Benjamini Y, Hochberg Y. Controlling the false discovery rate: a practical and powerful approach to multiple testing. Journal of the royal statistical society Series B (Methodological) 1995:289–300. [Google Scholar]
- Burdette DL, Monroe KM, Sotelo-Troha K, Iwig JS, Eckert B, Hyodo M, Hayakawa Y, Vance RE. STING is a direct innate immune sensor of cyclic di-GMP. Nature. 2011;478:515–518. doi: 10.1038/nature10429. [DOI] [PMC free article] [PubMed] [Google Scholar]
- Cavlar T, Deimling T, Ablasser A, Hopfner KP, Hornung V. Species-specific detection of the antiviral small-molecule compound CMA by STING. Embo J. 2013;32:1440–1450. doi: 10.1038/emboj.2013.86. [DOI] [PMC free article] [PubMed] [Google Scholar]
- Chin KH, Tu ZL, Su YC, Yu YJ, Chen HC, Lo YC, Chen CP, Barber GN, Chuah ML, Liang ZX, et al. Novel c-di-GMP recognition modes of the mouse innate immune adaptor protein STING. Acta Crystallogr D Biol Crystallogr. 2013;69:352–366. doi: 10.1107/S0907444912047269. [DOI] [PubMed] [Google Scholar]
- Conlon J, Burdette DL, Sharma S, Bhat N, Thompson M, Jiang Z, Rathinam VA, Monks B, Jin T, Xiao TS, et al. Mouse, but not human STING, binds and signals in response to the vascular disrupting agent 5,6-dimethylxanthenone-4-acetic acid. J Immunol. 2013;190:5216–5225. doi: 10.4049/jimmunol.1300097. [DOI] [PMC free article] [PubMed] [Google Scholar]
- Deczkowska A, Baruch K, Schwartz M. Type I/II Interferon Balance in the Regulation of Brain Physiology and Pathology. Trends Immunol. 2016;37:181–192. doi: 10.1016/j.it.2016.01.006. [DOI] [PubMed] [Google Scholar]
- Ding Z, Mathur V, Ho PP, James ML, Lucin KM, Hoehne A, Alabsi H, Gambhir SS, Steinman L, Luo J, et al. Antiviral drug ganciclovir is a potent inhibitor of microglial proliferation and neuroinflammation. J Exp Med. 2014;211:189–198. doi: 10.1084/jem.20120696. [DOI] [PMC free article] [PubMed] [Google Scholar]
- Dobin A, Davis CA, Schlesinger F, Drenkow J, Zaleski C, Jha S, Batut P, Chaisson M, Gingeras TR. STAR: ultrafast universal RNA-seq aligner. Bioinformatics. 2013;29:15–21. doi: 10.1093/bioinformatics/bts635. [DOI] [PMC free article] [PubMed] [Google Scholar]
- Dray SP, Dufour A-BA. The ade4 package: implementing the duality diagram for ecologists. Journal of statistical software. 2007;22:1–20. [Google Scholar]
- Ejlerskov P, Hultberg JG, Wang J, Carlsson R, Ambjorn M, Kuss M, Liu Y, Porcu G, Kolkova K, Friis Rundsten C, et al. Lack of Neuronal IFN-beta-IFNAR Causes Lewy Body- and Parkinson’s Disease-like Dementia. Cell. 2015;163:324–339. doi: 10.1016/j.cell.2015.08.069. [DOI] [PMC free article] [PubMed] [Google Scholar]
- Elion GB, Furman PA, Fyfe JA, de Miranda P, Beauchamp L, Schaeffer HJ. Selectivity of action of an antiherpetic agent, 9-(2-hydroxyethoxymethyl) guanine. Proc Natl Acad Sci U S A. 1977;74:5716–5720. doi: 10.1073/pnas.74.12.5716. [DOI] [PMC free article] [PubMed] [Google Scholar]
- Faulds D, Heel RC. Ganciclovir. A review of its antiviral activity, pharmacokinetic properties and therapeutic efficacy in cytomegalovirus infections. Drugs. 1990;39:597–638. doi: 10.2165/00003495-199039040-00008. [DOI] [PubMed] [Google Scholar]
- Frank DA, Mahajan S, Ritz J. Fludarabine-induced immunosuppression is associated with inhibition of STAT1 signaling. Nat Med. 1999;5:444–447. doi: 10.1038/7445. [DOI] [PubMed] [Google Scholar]
- Freischmidt A, Wieland T, Richter B, Ruf W, Schaeffer V, Muller K, Marroquin N, Nordin F, Hubers A, Weydt P, et al. Haploinsufficiency of TBK1 causes familial ALS and fronto-temporal dementia. Nat Neurosci. 2015;18:631–636. doi: 10.1038/nn.4000. [DOI] [PubMed] [Google Scholar]
- Fu J, Kanne DB, Leong M, Glickman LH, McWhirter SM, Lemmens E, Mechette K, Leong JJ, Lauer P, Liu W, et al. STING agonist formulated cancer vaccines can cure established tumors resistant to PD-1 blockade. Sci Transl Med. 2015;7:283ra252. doi: 10.1126/scitranslmed.aaa4306. [DOI] [PMC free article] [PubMed] [Google Scholar]
- Gao P, Ascano M, Zillinger T, Wang W, Dai P, Serganov AA, Gaffney BL, Shuman S, Jones RA, Deng L, et al. Structure-function analysis of STING activation by c[G(2′,5′)pA(3′,5′)p] and targeting by antiviral DMXAA. Cell. 2013;154:748–762. doi: 10.1016/j.cell.2013.07.023. [DOI] [PMC free article] [PubMed] [Google Scholar]
- Glass CK, Saijo K, Winner B, Marchetto MC, Gage FH. Mechanisms underlying inflammation in neurodegeneration. Cell. 2010;140:918–934. doi: 10.1016/j.cell.2010.02.016. [DOI] [PMC free article] [PubMed] [Google Scholar]
- Group, T.I.M.S.S. Interferon beta-1b is effective in relapsing-remitting multiple sclerosis. I. Clinical results of a multicenter, randomized, double-blind, placebo-controlled trial. Neurology. 1993;43:655–661. doi: 10.1212/wnl.43.4.655. [DOI] [PubMed] [Google Scholar]
- He S, Mao X, Sun H, Shirakawa T, Zhang H, Wang X. Potential therapeutic targets in the process of nucleic acid recognition: opportunities and challenges. Trends Pharmacol Sci. 2015;36:51–64. doi: 10.1016/j.tips.2014.10.013. [DOI] [PubMed] [Google Scholar]
- Hornung V, Hartmann R, Ablasser A, Hopfner KP. OAS proteins and cGAS: unifying concepts in sensing and responding to cytosolic nucleic acids. Nat Rev Immunol. 2014;14:521–528. doi: 10.1038/nri3719. [DOI] [PMC free article] [PubMed] [Google Scholar]
- Ishikawa H, Barber GN. STING is an endoplasmic reticulum adaptor that facilitates innate immune signalling. Nature. 2008;455:674–678. doi: 10.1038/nature07317. [DOI] [PMC free article] [PubMed] [Google Scholar]
- Ishikawa H, Ma Z, Barber GN. STING regulates intracellular DNA-mediated, type I interferon-dependent innate immunity. Nature. 2009;461:788–792. doi: 10.1038/nature08476. [DOI] [PMC free article] [PubMed] [Google Scholar]
- Jeremiah N, Neven B, Gentili M, Callebaut I, Maschalidi S, Stolzenberg MC, Goudin N, Fremond ML, Nitschke P, Molina TJ, et al. Inherited STING-activating mutation underlies a familial inflammatory syndrome with lupus-like manifestations. J Clin Invest. 2014;124:5516–5520. doi: 10.1172/JCI79100. [DOI] [PMC free article] [PubMed] [Google Scholar]
- Keren-Shaul H, Spinrad A, Weiner A, Matcovitch-Natan O, Dvir-Szternfeld R, Ulland TK, David E, Baruch K, Lara-Astaiso D, Toth B, et al. A Unique Microglia Type Associated with Restricting Development of Alzheimer’s Disease. Cell. 2017;169:1276–1290 e1217. doi: 10.1016/j.cell.2017.05.018. [DOI] [PubMed] [Google Scholar]
- Kunis G, Baruch K, Rosenzweig N, Kertser A, Miller O, Berkutzki T, Schwartz M. IFN-gamma-dependent activation of the brain’s choroid plexus for CNS immune surveillance and repair. Brain. 2013;136:3427–3440. doi: 10.1093/brain/awt259. [DOI] [PubMed] [Google Scholar]
- Lemos H, Huang L, Chandler PR, Mohamed E, Souza GR, Li L, Pacholczyk G, Barber GN, Hayakawa Y, Munn DH, et al. Activation of the STING adaptor attenuates experimental autoimmune encephalitis. Journal of immunology. 2014;192:5571–5578. doi: 10.4049/jimmunol.1303258. [DOI] [PMC free article] [PubMed] [Google Scholar]
- Lewis ND, Hill JD, Juchem KW, Stefanopoulos DE, Modis LK. RNA sequencing of microglia and monocyte-derived macrophages from mice with experimental autoimmune encephalomyelitis illustrates a changing phenotype with disease course. J Neuroimmunol. 2014;277:26–38. doi: 10.1016/j.jneuroim.2014.09.014. [DOI] [PubMed] [Google Scholar]
- Li L, Yin Q, Kuss P, Maliga Z, Millan JL, Wu H, Mitchison TJ. Hydrolysis of 2′3′-cGAMP by ENPP1 and design of nonhydrolyzable analogs. Nat Chem Biol. 2014;10:1043–1048. doi: 10.1038/nchembio.1661. [DOI] [PMC free article] [PubMed] [Google Scholar]
- Liddelow SA, Guttenplan KA, Clarke LE, Bennett FC, Bohlen CJ, Schirmer L, Bennett ML, Munch AE, Chung WS, Peterson TC, et al. Neurotoxic reactive astrocytes are induced by activated microglia. Nature. 2017;541:481–487. doi: 10.1038/nature21029. [DOI] [PMC free article] [PubMed] [Google Scholar]
- Littler E, Stuart AD, Chee MS. Human cytomegalovirus UL97 open reading frame encodes a protein that phosphorylates the antiviral nucleoside analogue ganciclovir. Nature. 1992;358:160–162. doi: 10.1038/358160a0. [DOI] [PubMed] [Google Scholar]
- Liu ML, Guo SC, Stiles JK. The emerging role of CXCL10 in cancer (Review) Oncol Lett. 2011;2:583–589. doi: 10.3892/ol.2011.300. [DOI] [PMC free article] [PubMed] [Google Scholar]
- Liu Y, Jesus AA, Marrero B, Yang D, Ramsey SE, Montealegre Sanchez GA, Tenbrock K, Wittkowski H, Jones OY, Kuehn HS, et al. Activated STING in a vascular and pulmonary syndrome. N Engl J Med. 2014;371:507–518. doi: 10.1056/NEJMoa1312625. [DOI] [PMC free article] [PubMed] [Google Scholar]
- Love MI, Huber W, Anders S. Moderated estimation of fold change and dispersion for RNA-seq data with DESeq2. Genome Biol. 2014;15:550. doi: 10.1186/s13059-014-0550-8. [DOI] [PMC free article] [PubMed] [Google Scholar]
- Matthews T, Boehme R. Antiviral activity and mechanism of action of ganciclovir. Rev Infect Dis. 1988;10(Suppl 3):S490–494. doi: 10.1093/clinids/10.supplement_3.s490. [DOI] [PubMed] [Google Scholar]
- Okabe Y, Sano T, Nagata S. Regulation of the innate immune response by threonine-phosphatase of Eyes absent. Nature. 2009;460:520–524. doi: 10.1038/nature08138. [DOI] [PubMed] [Google Scholar]
- Petrasek J, Iracheta-Vellve A, Csak T, Satishchandran A, Kodys K, Kurt-Jones EA, Fitzgerald KA, Szabo G. STING-IRF3 pathway links endoplasmic reticulum stress with hepatocyte apoptosis in early alcoholic liver disease. Proc Natl Acad Sci U S A. 2013;110:16544–16549. doi: 10.1073/pnas.1308331110. [DOI] [PMC free article] [PubMed] [Google Scholar]
- Pottier C, Bieniek KF, Finch N, van de Vorst M, Baker M, Perkersen R, Brown P, Ravenscroft T, van Blitterswijk M, Nicholson AM, et al. Whole-genome sequencing reveals important role for TBK1 and OPTN mutations in frontotemporal lobar degeneration without motor neuron disease. Acta Neuropathol. 2015;130:77–92. doi: 10.1007/s00401-015-1436-x. [DOI] [PMC free article] [PubMed] [Google Scholar]
- Prantner D, Perkins DJ, Lai W, Williams MS, Sharma S, Fitzgerald KA, Vogel SN. 5,6-Dimethylxanthenone-4-acetic acid (DMXAA) activates stimulator of interferon gene (STING)-dependent innate immune pathways and is regulated by mitochondrial membrane potential. J Biol Chem. 2012;287:39776–39788. doi: 10.1074/jbc.M112.382986. [DOI] [PMC free article] [PubMed] [Google Scholar]
- Rodero MP, Crow YJ. Type I interferon-mediated monogenic autoinflammation: The type I interferonopathies, a conceptual overview. J Exp Med. 2016;213:2527–2538. doi: 10.1084/jem.20161596. [DOI] [PMC free article] [PubMed] [Google Scholar]
- Sauer JD, Sotelo-Troha K, von Moltke J, Monroe KM, Rae CS, Brubaker SW, Hyodo M, Hayakawa Y, Woodward JJ, Portnoy DA, et al. The N-ethyl-N-nitrosourea-induced Goldenticket mouse mutant reveals an essential function of Sting in the in vivo interferon response to Listeria monocytogenes and cyclic dinucleotides. Infect Immun. 2011;79:688–694. doi: 10.1128/IAI.00999-10. [DOI] [PMC free article] [PubMed] [Google Scholar]
- Schoggins JW, Wilson SJ, Panis M, Murphy MY, Jones CT, Bieniasz P, Rice CM. A diverse range of gene products are effectors of the type I interferon antiviral response. Nature. 2011;472:481–485. doi: 10.1038/nature09907. [DOI] [PMC free article] [PubMed] [Google Scholar]
- Sharma S, Campbell AM, Chan J, Schattgen SA, Orlowski GM, Nayar R, Huyler AH, Nundel K, Mohan C, Berg LJ, et al. Suppression of systemic autoimmunity by the innate immune adaptor STING. Proc Natl Acad Sci U S A. 2015;112:E710–717. doi: 10.1073/pnas.1420217112. [DOI] [PMC free article] [PubMed] [Google Scholar]
- Skripuletz T, Salinas Tejedor L, Prajeeth CK, Hansmann F, Chhatbar C, Kucman V, Zhang N, Raddatz BB, Detje CN, Suhs KW, et al. The antiviral drug ganciclovir does not inhibit microglial proliferation and activation. Sci Rep. 2015;5:14935. doi: 10.1038/srep14935. [DOI] [PMC free article] [PubMed] [Google Scholar]
- Sun W, Li Y, Chen L, Chen H, You F, Zhou X, Zhou Y, Zhai Z, Chen D, Jiang Z. ERIS, an endoplasmic reticulum IFN stimulator, activates innate immune signaling through dimerization. Proc Natl Acad Sci U S A. 2009;106:8653–8658. doi: 10.1073/pnas.0900850106. [DOI] [PMC free article] [PubMed] [Google Scholar]
- Takeuchi O, Akira S. Pattern recognition receptors and inflammation. Cell. 2010;140:805–820. doi: 10.1016/j.cell.2010.01.022. [DOI] [PubMed] [Google Scholar]
- U.S. Department of Health and Human Services, F.a.D.A., Center for Drug Evaluation and Research (CDER) Guidance for Industry: Estimating the Maximum Safe Starting Dose in Initial Clinical Trials for Therapeutics in Adult Healthy Volunteers. Pharmacology and Toxicology 2005 [Google Scholar]
- Warnes G, Bolker B, Bonebakker L, Gentleman R, Huber W, Liaw A. gplots: Various R Programming Tools for Plotting Data. 2016: R package version 3.0.1. Reference Source. [Google Scholar]
- West AP, Khoury-Hanold W, Staron M, Tal MC, Pineda CM, Lang SM, Bestwick M, Duguay BA, Raimundo N, MacDuff DA, et al. Mitochondrial DNA stress primes the antiviral innate immune response. Nature. 2015;520:553–557. doi: 10.1038/nature14156. [DOI] [PMC free article] [PubMed] [Google Scholar]
- Zhou T, Georgeon S, Moser R, Moore DJ, Caflisch A, Hantschel O. Specificity and mechanism-of-action of the JAK2 tyrosine kinase inhibitors ruxolitinib and SAR302503 (TG101348) Leukemia. 2014;28:404–407. doi: 10.1038/leu.2013.205. [DOI] [PubMed] [Google Scholar]
Associated Data
This section collects any data citations, data availability statements, or supplementary materials included in this article.
Supplementary Materials
Table S1. Related to Figure 1. Microfluidic panel gene list with 86 microglia related genes and 10 house-keeping genes. Log2Fold change (GCV/Control) for each gene in primary microglia is listed.
Table S2. Related to Figure 7. RNA-seq analysis showing log2fold change, p-value and false discovery rate (FDR or q-value) for three different comparisons: WT GCV vs WT PBS (Sheet 1), STINGgt/gt PBS vs WT PBS (Sheet 2), STINGgt/gt GCV vs STINGgt/gt PBS (Sheet 3).
Table S3. Related to STAR Methods. RT-PCR primers used in this study. All sequences were obtained from Harvard Primer Bank.