

Abstract
Background:
Allergic diseases are complex identities determined by an interplay of genetic and environmental factors, resulting in the clinical manifestation of the disease. So far in Italy, updated data about the prevalence and risk factors of respiratory and allergic diseases in preschool children are not available.
Methods:
Children aged 3–5 years, attending four different nursery schools in an urban district of the city of Rome. A standardized questionnaire developed under the SIDRIA-2 protocol was administered to the parents of the children for the assessment of the potential risk factors and the outcomes.
Results:
A total of 494 children were enrolled in the study; 289 of them (60.3%) performed a skin prick test (SPT). In the 12 months preceding the interviews, 15% of children experienced at least one episode of wheezing, 5.5% of allergic rhinitis, 11% of children had a doctor diagnosis of asthma, 12% of children who underwent the SPT were positive to at least one of the tested allergens, being diagnosed as atopic. The univariate analysis for the health outcomes of the study shows that asthma was positively associated with daycare attendance, mother’s history of atopy, siblings’ history of atopy, recurrent siblings’ bronchitis, and dermatitis. Atopy was positively associated with mother’s history of atopy and dermatitis, whereas there is a borderline protective association with recurrent siblings’ bronchitis.
Conclusions:
This study represents a first comprehensive epidemiological evaluation of prevalence of respiratory and allergic diseases in children aged 3–5 years in the city of Rome and an updating of the evolution of allergic diseases.
Keywords: allergic diseases, preschool children, prevalence, risk factors
Background
Asthma and other allergic diseases are complex identities determined by an intricate interplay of genetic and environmental factors that contribute to a number of mechanisms resulting in the clinical manifestation of the disease.
Two main contributors are involved in atopic disorders: host factors such as gender, age, race, and genetic predisposition; and environmental factors such as living in a rural or urban setting, country and continent, increased environmental allergen exposure, inadequate childhood exposure to microbial antigens, environmental pollution, and dietary changes. The weight of each of these factors is not yet known.
Up to 40% of the population of the USA and Europe suffer from at least one type of allergy and the prevalence of allergies in industrial societies has doubled in the past 15 years. The increase in allergic diseases of civilization can probably be explained by reduced exposure to environmental micro-organisms including multicellular parasites and various microbial species, owing to the changed lifestyles in developed countries such as the absence of siblings, small families with few children, late introduction to community life and the reduced incidence of breastfeeding (which can promote the establishment of saprophytic flora).1
The need for more information about the prevalence of allergic disease in children led a team of researchers to start the International Study of Asthma and Allergies in Childhood (ISAAC).2
Within this study, the Italian Studies on Respiratory Disorders in Childhood and the Environment (SIDRIA) assessed the prevalence of respiratory and allergic diseases among Italian children and generated information on the prevalence of risk factors for childhood atopy and allergic diseases. The first phase of the study was conducted in 1994–19953 and the second one in 2002;4 the latter, carried out in 13 Italian centers, involved 20.016 children aged 6–7 years, and 16.175 adolescents aged 13–14 years, giving different results depending of the age. Prevalence of asthma was 9.3% in children and 10.3% in adolescents; prevalence of allergic rhinitis and eczema was 12.3% and 15.9%, respectively, in children, 20.9% and 11.9%, respectively, in adolescents. In both age groups, wheezing, asthma, and allergic rhinitis prevalence was greater in central than in northern and southern areas. On the other hand, eczema prevalence decreased between north and south of Italy. Furthermore, a major prevalence of asthma and rhinitis was found in metropolitan areas compared to other areas, and a major prevalence was also found in boys compared to girls. These data have not been further updated and no data were sought in the early stages of life. Although epidemiological studies in other countries evaluated the prevalence and risk factors (both environmental and genetic) related to respiratory and allergic diseases in preschool children, we do not have updated data on their prevalence in Italy.5–14
The objective of the current study is to fill this gap, describing the prevalence of the major allergic and respiratory diseases in a group of preschool children aged 3–5 years attending nurseries in the city of Rome and assessing the related factors, especially in relation to environment, associated with allergic diseases in the first years of life.
Methods
Study population
The study was conducted in four different nursery schools in an urban district of the city of Rome, attended by children aged 3–5 years.
The pediatricians of the Allergo-Immunology Unit of the Pediatric Department, of the University of Rome “Sapienza”, organized school meetings with teachers and parents in order to explain the study design and discuss about allergic diseases and their diagnosis, management, and prognosis, responding directly to every question.
Children of parents who agreed to participate and filled informed consent were included in the study. The study was approved by the Policlinico Umberto 1 ethics committee.
Questionnaire
A standardized questionnaire developed under the SIDRIA-2 protocol4 was used for the assessment of the potential risk factors and the outcomes.
The questionnaire investigated: individual characteristics such as age, gender, medical history, family history, allergies, eating habits; environmental factors such as traffic level (defined by the parents), house crowding, presence of pets at home, nursery and daycare attendance; allergic and respiratory diseases such as rhinitis, wheezing in the past 12 months, asthma diagnosed by physician, respiratory symptoms, mouth breathing and snoring during sleep, food allergy or food anaphylaxis, eczema, urticaria, otitis, diarrhea, infectious diseases; medical history including therapies (e.g. bronchodilators, antihistamines, oral corticosteroids, nasal steroids, herbal medicine) received during the past year. Questionnaires were distributed at school, completed at home by parents and finally delivered in anonymous form to the teachers.
Skin prick test
The skin prick test (SPT) for inhalant and food allergens were performed only for children whose parents signed the informed consent. All children were informed not to take antihistamines 7 days before the SPT examination.
SPTs were made using a panel of standardized allergen extracts (Lofarma), including nine common inhalant allergens such as Dermatophagoides pteronyssinus, Dermatophagoides farinae, Alternaria tenuis, animal hairs (including cat and dog epithelia), Parietaria officinalis, Grass pollens (Cynodon dactylon and Lolium perenne), Olea europea and food allergens such as milk proteins (alpha lactalbumin, beta lactoglobulin, casein), egg (yolk and white), fish, and wheat. Saline and histamine were always used as negative and positive controls. A positive immunological reaction was defined when the saline control site was completely negative, and histamine had a diameter equal or greater than 3 mm (excluding children with dermatographsim). Atopic status was defined if a positive result was found to at least one allergen tested.
Statistical analysis
We described the study population and compared children who underwent the SPTs and those who did not, by children’s individual characteristics (gender, nationality, age class, duration of breastfeeding, age at weaning, age of entry at the nursery school), environmental variables (number of siblings, house crowding, traffic, pets, daycare attendance, passive smoking), family history of atopy and respiratory diseases (mother’s, father’s, and siblings’ atopy, siblings’ recurrent bronchitis), and children’s health-related variables (wheezing, asthma dry cough at night, cough and phlegm, running nose, allergic rhinitis, otitis, eczema, urticaria, atopic dermatitis, atopy) . To test statistical differences between the two groups we calculated the Pearson’s χ2 test. Among the health-related variables collected, we selected atopy, rhinitis, wheezing, and asthma to investigate the association with a list of potential determinants, calculating the odds ratios (OR) and 95% confidence limits (95% CI) from logistic regression models. For each of these outcomes, we initially ran univariate logistic regression models for all the variables previously described. The multivariate logistic regression models included all the variables used for the univariate analysis, with the exclusion of house crowding which was highly correlated with the number of siblings (r = 0.74), age of entry at the daycare or nursery which was highly correlated with daycare attendance (r = 0.70), and age at weaning which was correlated with duration of breastfeeding (r = 0.30). We also added dermatitis as a covariate in the analysis, because it is considered a potential determinant for allergic diseases.
If the percentage of missing values of a variable was lower than 5%, we did not consider them in the analyses of the data, otherwise they were included in the analyses as one of the dummy value of the variable. As several variables had a percentage of missing value higher than 5%, we also conducted a sensitivity analyses dropping all missing values.
Results and discussion
A total of 494 children attending the nursery school (age range, 3–6 years) (Table 1) were enrolled in the study. The proportion of boys was 46% and the majority (93.1%) were born in Italy from Italian parents. The proportion of children breastfed after 2 months of life was more than 75% and 87% of children were weaned not before the 5th month of life. Most of them started attending school after the 11th month and 64% attended daycare. Sixty-seven percent of children had at least one sibling and 72.3% lived at home with at least three other people.
Table 1.
Individual and environmental characteristics of the study population and comparison between children with and without SPT.
| Total |
Children with skin prick test |
Children without skin prick test |
P value* | ||||
|---|---|---|---|---|---|---|---|
| n | % | n | % | n | % | ||
| Total | 494 | 298 | 196 | ||||
| Gender | 0.814 | ||||||
| Boys | 228 | 46.2 | 145 | 48.7 | 83 | 42.3 | |
| Girls | 243 | 49.2 | 152 | 51.0 | 91 | 46.4 | |
| Missing values | 23 | 4.7 | 1 | 0.3 | 22 | 11.2 | |
| Age group (years) | 0.274 | ||||||
| 3–4 | 271 | 54.9 | 158 | 53.0 | 113 | 57.7 | |
| 5–6 | 212 | 42.9 | 134 | 45.0 | 78 | 39.8 | |
| Nationality † | 0.018 | ||||||
| Italian | 460 | 93.1 | 284 | 95.3 | 176 | 89.8 | |
| Not Italian | 34 | 6.9 | 14 | 4.7 | 20 | 10.2 | |
| Missing values | 11 | 2.2 | 6 | 2.0 | 5 | 2.6 | |
| Duration of breastfeeding (months) | 0.268 | ||||||
| <2 | 84 | 17.0 | 56 | 18.8 | 28 | 14.3 | |
| ⩾2 | 374 | 75.7 | 225 | 75.5 | 149 | 76.0 | |
| Missing values | 36 | 7.3 | 17 | 5.7 | 19 | 9.7 | |
| Age of weaning (months) | 0.35 | ||||||
| <5 | 37 | 7.5 | 20 | 6.7 | 17 | 8.7 | |
| ⩾5 | 430 | 87.0 | 266 | 89.3 | 164 | 83.7 | |
| Missing values | 27 | 5.5 | 12 | 4.0 | 15 | 7.7 | |
| Age of entry at daycare or nursery (months) | 0.665 | ||||||
| <12 | 90 | 18.2 | 51 | 17.1 | 39 | 19.9 | |
| 12–35 | 265 | 53.6 | 161 | 54.0 | 104 | 53.1 | |
| ⩾36 | 126 | 25.5 | 79 | 26.5 | 47 | 24.0 | |
| Missing values | 13 | 2.6 | 7 | 2.3 | 6 | 3.1 | |
| Siblings | 0.167 | ||||||
| None | 143 | 28.9 | 78 | 26.2 | 65 | 33.2 | |
| 1 | 285 | 57.7 | 180 | 60.4 | 105 | 53.6 | |
| >1 | 50 | 10.1 | 33 | 11.1 | 17 | 8.7 | |
| Missing values | 16 | 3.2 | 7 | 2.3 | 9 | 4.6 | |
| House crowding | 0.152 | ||||||
| <4 people | 126 | 25.5 | 67 | 22.5 | 59 | 30.1 | |
| 4 people | 239 | 48.4 | 148 | 49.7 | 91 | 46.4 | |
| >4 people | 118 | 23.9 | 76 | 25.5 | 42 | 21.4 | |
| Missing values | 11 | 2.2 | 7 | 2.3 | 4 | 2.0 | |
| Traffic | 0.123 | ||||||
| Little or moderate | 272 | 55.1 | 155 | 52.0 | 117 | 59.7 | |
| Heavy | 208 | 42.1 | 133 | 44.6 | 75 | 38.3 | |
| Missing values | 14 | 2.8 | 10 | 3.4 | 4 | 2.0 | |
| Pets at home | 0.756 | ||||||
| No | 390 | 78.9 | 236 | 79.2 | 154 | 78.6 | |
| Yes | 102 | 20.6 | 60 | 20.1 | 42 | 21.4 | |
| Missing values | 2 | 0.4 | 2 | 0.7 | 0 | 0.0 | |
| Daycare attendance | 0.654 | ||||||
| No | 168 | 34.0 | 104 | 34.9 | 64 | 32.7 | |
| Yes | 316 | 64.0 | 189 | 63.4 | 127 | 64.8 | |
| Missing values | 10 | 2.0 | 5 | 1.7 | 5 | 2.6 | |
| Passive smoking | 0.552 | ||||||
| No | 262 | 53.0 | 188 | 63.1 | 116 | 59.2 | |
| Yes | 113 | 22.9 | 107 | 35.9 | 74 | 37.8 | |
| Missing values | 9 | 1.8 | 3 | 1.0 | 6 | 3.1 | |
| Mother’s atopy | 0.114 | ||||||
| No | 287 | 58.1 | 168 | 56.4 | 119 | 60.7 | |
| Yes | 176 | 35.6 | 116 | 38.9 | 60 | 30.6 | |
| Missing values | 31 | 6.3 | 14 | 4.7 | 17 | 8.7 | |
| Father’s atopy | 0.017 | ||||||
| No | 264 | 53.4 | 149 | 50.0 | 115 | 58.7 | |
| Yes | 188 | 38.1 | 127 | 42.6 | 61 | 31.1 | |
| Missing values | 42 | 8.5 | 22 | 7.4 | 20 | 10.2 | |
| Siblings’ atopy | 0.013 | ||||||
| No | 311 | 63.0 | 178 | 59.7 | 133 | 67.9 | |
| Yes | 121 | 24.5 | 85 | 28.5 | 36 | 18.4 | |
| Missing values | 62 | 12.6 | 35 | 11.7 | 27 | 13.8 | |
| Siblings’ recurrent bronchitis | 0.004 | ||||||
| No | 346 | 70.0 | 192 | 64.4 | 154 | 78.6 | |
| Yes | 78 | 15.8 | 57 | 19.1 | 21 | 10.7 | |
| Missing values | 61 | 12.3 | 42 | 14.1 | 19 | 9.7 | |
P value from chi2 square test, calculated without considering missing values.
Nationality was based on the place of birth of parents.
Exposure to environmental smoke of at least one parent.
Forty-two percent of children reported to live in a street with heavy traffic, 20.6% had a pet at home, and 22.9% had at least one smoking parent. Thirty-six percent of children had an atopic mother, 38.1% had an atopic father, and 24.5% had atopic siblings; 15.8% had siblings who experienced recurrent bronchitis (Table 1). Among all the children, 289 (60.3%) performed the SPT (Figure 1); the comparison between children who underwent the SPT showed that children who accepted to do the SPT were more likely Italian, with a family history of atopy (atopic father and siblings), and more frequently had siblings with recurrent bronchitis.
Figure 1.
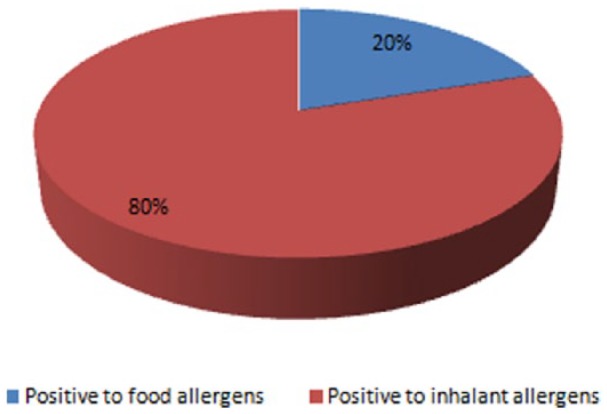
Percentage of children positive to food and inhalant allergens among atopic children
Table 2 reports the health-related variables. In the 12 months preceding the interviews, 15% of children experienced at least one episode of wheezing, 30% of dry cough at night, 39% of cough and phlegm, and 5.5% of allergic rhinitis. Eleven percent of children had a doctor’s diagnosis of asthma, 33% of otitis, 11% of eczema, 8.5% of urticaria, and 25% of dermatitis; finally 12% of children who underwent the SPTs were positive to at least one of the tested allergen, being diagnosed as atopic. Children who underwent the SPT showed a higher proportion of diagnosis of eczema with respect to the group that were not tested.
Table 2.
Health-related variables of the study population and comparison between children with and without SPT.
| Total |
Children with prick test |
Children without prick test |
P value* | ||||
|---|---|---|---|---|---|---|---|
| n | % | n | % | n | % | ||
| Total | 494 | 298 | 196 | ||||
| Symptoms in the last 12 months | |||||||
| Wheezing | 0.782 | ||||||
| No | 397 | 80.4 | 240 | 80.5 | 157 | 80.1 | |
| Yes | 74 | 15.0 | 46 | 15.4 | 28 | 14.3 | |
| Missing values | 23 | 4.7 | 12 | 4.0 | 11 | 5.6 | |
| Dry cough at night | 0.776 | ||||||
| No | 337 | 68.2 | 205 | 68.8 | 132 | 67.3 | |
| Yes | 148 | 30.0 | 88 | 29.5 | 60 | 30.6 | |
| Missing values | 9 | 1.8 | 5 | 1.7 | 4 | 2.0 | |
| Cough and phlegm | 0.941 | ||||||
| No | 294 | 59.5 | 178 | 59.7 | 116 | 59.2 | |
| Yes | 191 | 38.7 | 115 | 38.6 | 76 | 38.8 | |
| Missing values | 9 | 1.8 | 5 | 1.7 | 4 | 2.0 | |
| Running nose | 0.598 | ||||||
| No | 355 | 71.9 | 212 | 71.1 | 143 | 73.0 | |
| Yes | 125 | 25.3 | 78 | 26.2 | 47 | 24.0 | |
| Missing values | 14 | 2.8 | 8 | 2.7 | 6 | 3.1 | |
| Doctor’s diagnosis | |||||||
| Asthma | 0.147 | ||||||
| No | 422 | 85.4 | 261 | 87.6 | 161 | 82.1 | |
| Yes | 56 | 11.3 | 29 | 9.7 | 27 | 13.8 | |
| Missing values | 16 | 3.2 | 8 | 2.7 | 8 | 4.1 | |
| Allergic rhinitis | 0.767 | ||||||
| No | 441 | 89.3 | 265 | 88.9 | 176 | 89.8 | |
| Yes | 27 | 5.5 | 17 | 5.7 | 10 | 5.1 | |
| Missing values | 26 | 5.3 | 16 | 5.4 | 10 | 5.1 | |
| Otitis | 0.121 | ||||||
| No | 320 | 64.8 | 186 | 62.4 | 134 | 68.4 | |
| Yes | 162 | 32.8 | 106 | 35.6 | 56 | 28.6 | |
| Missing values | 12 | 2.4 | 6 | 2.0 | 6 | 3.1 | |
| Eczema | 0.021 | ||||||
| No | 419 | 84.8 | 247 | 82.9 | 172 | 87.8 | |
| Yes | 56 | 11.3 | 42 | 14.1 | 14 | 7.1 | |
| Missing values | 19 | 3.8 | 9 | 3.0 | 10 | 5.1 | |
| Urticaria | 0.62 | ||||||
| No | 434 | 87.9 | 265 | 88.9 | 169 | 86.2 | |
| Yes | 42 | 8.5 | 24 | 8.1 | 18 | 9.2 | |
| Missing values | 18 | 3.6 | 9 | 3.0 | 9 | 4.6 | |
| Dermatitis | 0.109 | ||||||
| No | 357 | 72.3 | 208 | 69.8 | 149 | 76.0 | |
| Yes | 125 | 25.3 | 83 | 27.9 | 42 | 21.4 | |
| Missing values | 12 | 2.4 | 7 | 2.3 | 5 | 2.6 | |
| Atopy † | |||||||
| No | 238 | 48.2 | |||||
P value from chi2 square test, calculated without considering missing values.
Assessed on the basis of positivity at skin prick test to at least one allergen.
The univariate analysis for the four health outcomes of the study (Table 3) shows that wheezing during the last 12 months was positively associated with siblings’ history of atopy (odds ratio [OR], 2.42; 95% confidence interval [CI], 1.39–4.22), recurrent siblings’ bronchitis (OR, 2.32; 95% CI, 1.26–4.27), and dermatitis (OR, 1.69; 95% CI, 0.99–2.89). The diagnosis of asthma was positively associated with nationality not being Italian (OR, 2.54; 95% CI, 1.09–5.92), duration of breastfeeding longer than 1 month (OR, 2.78; 95% CI, 0.97–7.97), daycare attendance (OR, 2.26; 95% CI, 1.14–4.52), mother’s history of atopy (OR, 2.04; 95% CI, 1.13–3.66), siblings’ history of atopy (OR, 2.09; 95% CI, 1.12–3.89), recurrent siblings’ bronchitis (OR, 1.99; 95% CI, 0.99–4.00), and dermatitis (OR, 2.02; 95% CI, 1.13–3.61). Girls had a lower risk of developing asthma with respect to boys (OR, 0.50; 95% CI, 0.27–0.90). The diagnosis of atopy was positively associated with mother’s history of atopy (OR, 2.09; 95% CI, 1.15–3.77), and dermatitis (OR, 1.78; 95% CI, 0.97–3.27), whereas we observed a borderline protective association with recurrent siblings’ bronchitis (OR, 0.44; 95% CI, 0.19–1.05). The diagnosis of allergic rhinitis was positively associated with father’s history of atopy (OR, 3.11; 95% CI, 1.30–7.44), recurrent siblings’ bronchitis (OR, 2.94; 95% CI, 1.23–7.00), and dermatitis (OR, 11.6; 95% CI, 4.52–29.6).
Table 3.
Univariate logistic models: Association between parents’ and children’s individual characteristics and health outcomes.
| Wheezing |
Asthma |
Atopy |
Allergic rhinitis |
|||||
|---|---|---|---|---|---|---|---|---|
| OR | 95% CI | OR | 95% CI | OR | 95% CI | OR | 95% CI | |
| Gender | ||||||||
| Boys | 1.00 | 1.00 | 1.00 | 1.00 | ||||
| Girls | 0.75 | 0.45–1.25 | 0.50 | 0.27–0.90 | 0.67 | 0.38–1.19 | 1.05 | 0.47–2.33 |
| Age group (years) | ||||||||
| 3–4 | 1.00 | 1.00 | 1.00 | 1.00 | ||||
| 5–6 | 0.89 | 0.54–1.48 | 1.07 | 0.61–1.88 | 0.99 | 0.56–1.76 | 1.20 | 0.54–2.70 |
| Nationality | ||||||||
| Italian | 1.00 | 1.00 | 1.00 | 1.00 | ||||
| Not Italian | 1.37 | 0.54–3.48 | 2.54 | 1.09–5.92 | 0.29 | 0.04–2.29 | 2.57 | 0.83–7.93 |
| Duration of breastfeeding (months) | ||||||||
| <2 | 1.00 | 1.00 | 1.00 | 1.00 | ||||
| ⩾2 | 0.80 | 0.42–1.49 | 2.78 | 0.97–7.97 | 0.76 | 0.38–1.54 | 0.87 | 0.31–2.38 |
| Missing values | 1.01 | 0.35–2.87 | 4.28 | 1.12–16.3 | 1.38 | 0.41–4.64 | 0.94 | 0.17–5.12 |
| Age of weaning (months) | ||||||||
| <5 | 1.00 | 1.00 | 1.00 | 1.00 | ||||
| ⩾5 | 0.55 | 0.25–1.23 | 1.03 | 0.35–3.04 | 0.57 | 0.21–1.55 | 0.39 | 0.13–1.22 |
| Missing values | 0.14 | 0.02–1.16 | 1.88 | 0.42–8.48 | 0.47 | 0.08–2.81 | 0.32 | 0.03–3.05 |
| Age of entry at daycare or nursery (months) | ||||||||
| <12 | 1.00 | 1.00 | 1.00 | 1.00 | ||||
| 12–35 | 1.15 | 0.59–2.27 | 1.43 | 0.66–3.11 | 0.80 | 0.37–1.74 | 1.65 | 0.46–5.90 |
| ⩾36 | 0.96 | 0.44–2.09 | 0.91 | 0.36–2.29 | 1.07 | 0.46–2.51 | 2.57 | 0.69–9.63 |
| Siblings | ||||||||
| None | 1.00 | 1.00 | 1.00 | 1.00 | ||||
| 1 | 1.61 | 0.89–2.92 | 1.28 | 0.66–2.47 | 0.97 | 0.50–1.87 | 1.00 | 0.42–2.39 |
| >1 | 0.61 | 0.20–1.92 | 0.82 | 0.26–2.64 | 0.86 | 0.30–2.44 | 0.68 | 0.14–3.30 |
| House crowding | ||||||||
| <4 people | 1.00 | 1.00 | 1.00 | 1.00 | ||||
| 4 people | 1.47 | 0.79–2.75 | 1.11 | 0.55–2.25 | 0.88 | 0.43–1.81 | 0.63 | 0.24–1.65 |
| >4 people | 0.92 | 0.43–1.98 | 1.38 | 0.63–3.02 | 1.09 | 0.49–2.43 | 1.11 | 0.40–3.06 |
| Traffic | ||||||||
| Little or moderate | 1.00 | 1.00 | 1.00 | 1.00 | ||||
| Heavy | 0.75 | 0.45–1.26 | 0.80 | 0.45–1.42 | 1.21 | 0.69–2.14 | 1.77 | 0.79–4.00 |
| Pets at home | ||||||||
| No | 1.00 | 1.00 | 1.00 | 1.00 | ||||
| Yes | 0.64 | 0.32–1.27 | 0.71 | 0.33–1.50 | 0.98 | 0.48–1.99 | 1.11 | 0.43–2.83 |
| Daycare attendance | ||||||||
| No | 1.00 | 1.00 | 1.00 | 1.00 | ||||
| Yes | 1.42 | 0.82–2.45 | 2.26 | 1.14–4.52 | 0.83 | 0.46–1.49 | 1.05 | 0.46–2.40 |
| Passive smoking | ||||||||
| No | 1.00 | 1.00 | 1.00 | 1.00 | ||||
| Yes | 0.99 | 0.59–1.66 | 1.09 | 0.61–1.95 | 1.02 | 0.57–1.84 | 1.12 | 0.49–2.56 |
| Mother’s atopy | ||||||||
| No | 1.00 | 1.00 | 1.00 | 1.00 | ||||
| Yes | 1.26 | 0.75–2.11 | 2.04 | 1.13–3.66 | 2.09 | 1.15–3.77 | 2.01 | 0.91–4.46 |
| Missing values | 0.72 | 0.21–2.50 | 2.33 | 0.81–6.68 | 2.29 | 0.67–7.87 | 0.92 | 0.11–7.35 |
| Father’s atopy | ||||||||
| No | 1.00 | 1.00 | 1.00 | 1.00 | ||||
| Yes | 1.11 | 0.66–1.86 | 1.14 | 0.63–2.04 | 1.28 | 0.71–2.31 | 3.11 | 1.30–7.44 |
| Missing values | 0.50 | 0.15–1.73 | 0.90 | 0.30–2.71 | 1.33 | 0.45–3.92 | 2.92 | 0.74–11.6 |
| Siblings’ atopy | ||||||||
| No | 1.00 | 1.00 | 1.00 | 1.00 | ||||
| Yes | 2.42 | 1.39–4.22 | 2.09 | 1.12–3.89 | 1.40 | 0.75–2.64 | 1.82 | 0.75–4.37 |
| Missing values | 2.23 | 1.07–4.64 | 2.11 | 0.93–4.79 | 1.35 | 0.56–3.25 | 2.39 | 0.81–7.02 |
| Siblings’ recurrent bronchitis | ||||||||
| No | 1.00 | 1.00 | 1.00 | 1.00 | ||||
| Yes | 2.32 | 1.26–4.27 | 1.99 | 0.99–4.00 | 0.44 | 0.19–1.05 | 2.94 | 1.23–7.00 |
| Missing values | 1.22 | 0.58–2.57 | 2.08 | 0.98–4.38 | 0.53 | 0.22–1.26 | 1.10 | 0.31–3.91 |
| Dermatitis | ||||||||
| No | 1.00 | 1.00 | 1.00 | 1.00 | ||||
| Yes | 1.69 | 0.99–2.89 | 2.02 | 1.13–3.61 | 1.78 | 0.97–3.27 | 11.6 | 4.52–29.6 |
CI, confidence interval; OR, odds ratio.
The results from multivariate analysis, reported in Table 4, confirmed that the association of wheezing in the last 12 months with siblings’ history of atopy and correlation is even stronger (ORadj, 4.43; 95% CI, 1.95–10.0), and the protective effect of having more than one sibling becomes statistically significant (ORadj, 0.17; 95% CI, 0.04–0.76). The analysis of asthma onset confirms an effect of gender (girls were protected compared to boys), daycare attendance, and maternal history of atopy. The adjustment for all the potential predictors of allergic rhinitis showed an effect only for dermatitis. Maternal history of atopy is confirmed as a potential risk factor for atopy, and the protective effect of recurrent siblings’ bronchitis became statistically significant (ORadj, 0.20; 95% CI, 0.06–0.64).
Table 4.
Multivariate logistic models: Association between parents’ and children’s individual characteristics and health outcomes.
| Wheezing |
Asthma |
Allergic rhinitis |
Atopy |
|||||
|---|---|---|---|---|---|---|---|---|
| ORadj | 95% CI | ORadj | 95% CI | ORadj | 95% CI | ORadj | 95% CI | |
| Gender | ||||||||
| Boys | 1.00 | 1.00 | 1.00 | 1.00 | ||||
| Girls | 0.77 | 0.44–1.37 | 0.45 | 0.23–0.89 | 1.68 | 0.55–5.12 | 0.59 | 0.30–1.16 |
| Nationality | ||||||||
| Italian | 1.00 | 1.00 | 1.00 | |||||
| Not Italian | 0.75 | 0.20–2.82 | 1.17 | 0.35–3.89 | 0.67 | 0.07–6.51 | * | |
| Duration of breastfeeding (months) | ||||||||
| <2 | 1.00 | 1.00 | 1.00 | 1.00 | ||||
| ⩾2 | 0.92 | 0.43–2.00 | 3.22 | 0.91–11.4 | 2.10 | 0.47–9.37 | 1.28 | 0.52–3.12 |
| Missing values | 0.95 | 0.25–3.54 | 3.11 | 0.54–17.7 | 1.36 | 0.10–18.2 | 3.01 | 0.71–12.7 |
| Siblings | ||||||||
| None | 1.00 | 1.00 | 1.00 | 1.00 | ||||
| 1 | 0.77 | 0.34–1.73 | 0.79 | 0.32–1.98 | 0.62 | 0.15–2.57 | 0.93 | 0.39–2.22 |
| >1 | 0.17 | 0.04–0.76 | 0.36 | 0.08–1.72 | 0.14 | 0.01–1.78 | 1.15 | 0.30–4.42 |
| Traffic | ||||||||
| Little or moderate | 1.00 | 1.00 | 1.00 | 1.00 | ||||
| Heavy | 0.70 | 0.39–1.25 | 0.83 | 0.42–1.61 | 2.63 | 0.91–7.58 | 0.89 | 0.46–1.72 |
| Pets at home | ||||||||
| No | 1.00 | 1.00 | 1.00 | 1.00 | ||||
| Yes | 0.69 | 0.31–1.51 | 0.59 | 0.23–1.54 | 2.24 | 0.59–8.48 | 1.22 | 0.53–2.80 |
| Daycare attendance | ||||||||
| No | 1.00 | 1.00 | 1.00 | 1.00 | ||||
| Yes | 1.70 | 0.91–3.20 | 2.28 | 1.03–5.06 | 0.90 | 0.29–2.79 | 0.88 | 0.44–1.76 |
| Passive smoking | ||||||||
| No | 1.00 | 1.00 | 1.00 | 1.00 | ||||
| Yes | 1.06 | 0.58–1.96 | 1.16 | 0.57–2.35 | 1.85 | 0.64–5.40 | 1.14 | 0.57–2.27 |
| Mother’s atopy | ||||||||
| No | 1.00 | 1.00 | 1.00 | 1.00 | ||||
| Yes | 1.24 | 0.67–2.28 | 2.09 | 1.03–4.24 | 1.27 | 0.45–3.58 | 2.11 | 1.04–4.30 |
| Missing values | 0.86 | 0.22–3.32 | 2.58 | 0.71–9.31 | 0.65 | 0.04–10.1 | 2.27 | 0.55–9.40 |
| Father’s atopy | ||||||||
| No | 1.00 | 1.00 | 1.00 | 1.00 | ||||
| Yes | 0.89 | 0.49–1.63 | 0.80 | 0.39–1.61 | 2.58 | 0.84–7.89 | 1.37 | 0.70–2.68 |
| Missing values | 0.42 | 0.11–1.62 | 0.45 | 0.11–1.84 | 4.86 | 0.78–30.3 | 1.03 | 0.26–4.09 |
| Siblings’ atopy | ||||||||
| No | 1.00 | 1.00 | 1.00 | 1.00 | ||||
| Yes | 4.43 | 1.95–10.0 | 1.90 | 0.74–4.89 | 1.18 | 0.27–5.18 | 1.90 | 0.77–4.71 |
| Missing values | 3.40 | 1.19–9.73 | 1.88 | 0.55–6.46 | 1.06 | 0.11–9.87 | 2.70 | 0.66–11.0 |
| Siblings’ recurrent bronchitis | ||||||||
| No | 1.00 | 1.00 | 1.00 | 1.00 | ||||
| Yes | 0.82 | 0.36–1.88 | 1.21 | 0.46–3.17 | 2.57 | 0.57–11.6 | 0.20 | 0.06–0.64 |
| Missing values | 0.65 | 0.24–1.77 | 1.20 | 0.39–3.71 | 1.84 | 0.26–13.3 | 0.23 | 0.07–0.79 |
| Dermatitis | ||||||||
| No | 1.00 | 1.00 | 1.00 | 1.00 | ||||
| Yes | 1.14 | 0.60–2.17 | 1.55 | 0.76–3.18 | 11.70 | 3.70–37.1 | 1.81 | 0.89–3.66 |
The variable predicts failure perfectly.
CI, confidence interval; ORadj, adjusted odds ratio.
The sensitivity analysis performed dropping all the missing values did not change the results of the multivariate analyses (data not shown).
Asthma and allergic diseases are common diseases in children, and their prevalence has increased in the world in the last decades.13 However few data are available on respiratory and allergic diseases in preschool children.
The multicenter epidemiological Italian Studies on Respiratory Disorders in Childhood and the Environment (SIDRIA-2 )14 provided a reliable Italian map of the prevalence of atopic diseases. This study, which was undertaken to identify factors that may explain the rise in atopic diseases, comprised children aged 6–7 years and 13–14 years. In 2007, the prevalence of atopy and asthma, and their association with familial and environmental factors, were investigated among children aged 13–14 years living in Brescia, an industrialized town in northern Italy.15 This is the first Italian study which provides information on the prevalence of respiratory and allergic diseases and their association with individual, environmental, and familiar characteristics in a population of children aged 3–5 years living in Rome.
In our study, the wheezing prevalence (15.0%) in the last 12 months was higher compared to the SIDRIA-2 study in Rome (9%) in children aged 6–7 years. This result may be the consequence of the higher viral infections in preschool children compared to school age children. Wheezing is common during infancy, particularly in association with respiratory infection. The expression of this phenotype is usually transient and resolves spontaneously by age 3–5 years.
Eleven percent of children had a physician’s diagnosis of asthma; the asthma prevalence was comparable to Italian studies with eldest children, for example 11.6% in children aged 6–7 years, 14.1% in adolescents aged 13–14 years in the SIDRIA-2 study,14 and 10.2% in adolescents in the Brescia study.15 In preschool children, asthma is often misunderstood because the features can be confused with respiratory tract infections, which are very common at this age. It is known that permanent lung damage, “remodeling,”16 that characterizes the most severe asthma, may start early in life, therefore early recognition and treatment of these features could prevent lung damage.
Asthma prevalence is higher in boys than in girls, and the female gender is inversely associated with asthma when also taking account of other risk factors.
Allergic rhinitis prevalence was lower (5.5%) compared to previous Italian studies.14,15 This result confirms the atopy march, with an increase of allergic rhinitis and decrease of atopic dermatitis with age. Allergic rhinitis typically occurs during school age; indeed, the SIDRIA-2 study showed a prevalence of 12.3% in children aged 6–7 years and 15.9% in children aged 13–14 years. The atopic dermatitis prevalence in our population was higher (25%) compared to the SIDRIA-2 study in Rome which showed 20.9% in children aged 6–7 years and 12.9% in adolescents.
Of children who performed SPT for the most common allergens, 12.1% were atopic; atopy is defined as reactivity to at least one allergen. This percentage is lower than the 35–49% reported in adolescents in other areas in Italy.15,17 About 39% of the total participants did not undergo the test because they did not present signed parental consent. No substantial differences were found between tested and untested children with regard to wheezing, dry cough at night, cough and phlegm, and running nose in the last 12 months and to the prevalence of lifetime doctor’s diagnosis of asthma, allergic rhinitis, otitis, urticarial, and dermatitis, though a slightly higher prevalence of eczema was found among the former.
We analyzed the association between parents’ and children’s individual characteristics and health outcomes. Many factors were independently associated with wheezing and asthma.
Our data show that the diagnosis of asthma was positively associated with the breastfeeding longer than 1 month (OR, 2.78; 95% CI, 0.97–7.97) in the univariate analysis, even though this result was no longer statistically significant when taking into account the other potential predictors, so any conclusions about whether there is a relationship between breastfeeding and asthma risk could not be drawn. There is debate about the relationship between breastfeeding and asthma development. A meta-analysis of prospective studies by Gladevich18 found that breastfeeding reduced the risk of asthma in young children. However, another meta-analysis, which included older children aged 2–3 years,19 demonstrated that breastfeeding was not associated with a reduction of the asthma risk. More data from epidemiological studies are needed. In any case, as breastfeeding provides development, nutritional, and immunological benefits to the infant, all mothers should be encouraged to continue to breastfeed their infants exclusively for the first 6 month of life, as recommended by the World Health Organization.
Atopic dermatitis, and mother’s and siblings’ atopy are risk factors for the development of atopy.
The atopic march refers to the natural progression of atopic diseases from atopic dermatitis in infancy to atopic rhinitis and asthma in school-age children.19 Children who develop atopic dermatitis have a significant risk of going on to become sensitized to aeroallergens and subsequently to develop rhinitis and asthma. The allergic march has a pattern of allergic sensitization that changes as children age, between 2 and 5 years the children started to develop inhalant allergy. Atopic parents represent risk factors for this chain of events.20
The siblings’ recurrent bronchitis is a protective factor for atopy (OR, 0.2; P value <0.01), providing further support for the hygiene hypothesis.21,22 During recent decades, the hygiene hypothesis, the apparent inverse relationship between infections in early life and the subsequent development of asthma and atopy, has received much attention.23,24 The hygiene hypothesis in its broadest sense can include not only infections caused by bacterial and viral pathogens, but also helminth infections and exposure to bacterial components, such as lipopolysaccharide and exposure to commensal bacteria in the gastrointestinal tract, as well as exposure to farm environment.
Nearly three decades after the first formulation of the hygiene hypothesis, our findings show that family size and siblings’ recurrent bronchitis could be associated with a reduced risk of wheezing and allergic sensitization, respectively, as found in various studies.15–25 This hypothesis maintains that a crowded, highly promiscuous environment may favor children’s exposure to polymicrobial aerosols, causing recurrent mild or asymptomatic upper respiratory tract infections, which make the risk of developing atopy lower, shifting Th0 cells toward the Th1 phenotype or stimulating T cells with regulatory function.26
Repeated viral infections, such as runny nose, or chronic infections, such as herpes virus infection and measles, early in life, reduce the risk for the development of asthma up to school age, whereas no effects were observed for other types of infection.27 Bacterial endotoxins may also play a role, as they are pro-inflammatory substances of gram-negative bacteria cell wall, and they are abundant in an environment where animals, carpets, and dust are present. Children exposed to a high amount of endotoxins may be protected from developing asthma, as these substances are Th1 stimulating, as supported by studies showing an inverse relationship between endotoxin burden in the environment and subsequent development of atopic asthma and allergic sensitization.28
Our study showed that urban traffic,29 pets,30 passive smoking, and house crowding do not represent significant risk factors for atopy and respiratory symptoms. This result could be due to the small size sample.
The limitations of the study are that the study population was not representative of the whole Italian preschool population; moreover, we used the SIDRIA-2 questionnaire for preschool children, although it was originally designed for primary and middle school children. Finally, the high percentage of missing values distributed across all the variables collected could have biased the results, even though the sensitivity analysis on the complete database gave very similar results.
Despite these limitations, the results deserve attention, because there are few data on the prevalence of allergic diseases in this age group.
Conclusions
In conclusion, the study represents a first comprehensive epidemiological evaluation of prevalence of respiratory and allergic diseases in children aged 3–5 years in the city of Rome and an updating of the evolution of allergic diseases.
Footnotes
Declaration of conflicting interests: The authors declared no potential conflicts of interest with respect to the research, authorship, and/or publication of this article.
Funding: This research received no specific grant from any funding agency in the public, commercial, or not-for-profit sectors.
References
- 1. Just J, Belfar S, Wanin S, et al. (2010) Impact of innate and environmental factors on wheezing persistence during childhood. Journal of Asthma 47: 412–416. [DOI] [PubMed] [Google Scholar]
- 2. ISAAC Steering Committee (Writing Committee: Beasley R, Keil U, Von Mutius E, Pearce N) (1998) Worldwide variation in prevalence of symptoms of asthma, allergic rhinoconjunctivitis and atopic eczema: ISAAC. Lancet 351: 1225–1232. [PubMed] [Google Scholar]
- 3. [No authors listed] (1997) Asthma and respiratory symptoms in 6-7 yr old Italian children: Gender, latitude, urbanization and socioeconomic factors. SIDRIA (Italian Studies on Respiratory Disorders in Childhood and the Environment). European Respiratory Journal 10(8): 1780–1786. [DOI] [PubMed] [Google Scholar]
- 4. Sestini P, De Sario M, Bugiani M, et al. ; Gruppo Collaborativo SIDRIA (2005) Frequency of asthma and allergies in Italian children and adolescents: Results from SIDRIA-2. Epidemiologia e Prevenzione 29 Suppl: 24–31. [PubMed] [Google Scholar]
- 5. Lodge CJ, Lowe AJ, Gurrin LC, et al. (2012) Pets at birth do not increase allergic disease in at-risk children. Clinical and Experimental Allergy 42(9): 1377–1385. [DOI] [PubMed] [Google Scholar]
- 6. Scott M, Roberts G, Kurukulaaratchy RJ, et al. (2012) Multifaceted allergen avoidance during infancy reduces asthma during childhood with the effect persisting until age 18 years. Thorax 67(12): 1046–1051. [DOI] [PubMed] [Google Scholar]
- 7. Van Oeffelen AA, Bekkers MB, Smit HA, et al. (2011) Serum micronutrient concentrations and childhood asthma: The PIAMA birth cohort study. Pediatric Allergy and Immunology 22(8): 784–793. [DOI] [PubMed] [Google Scholar]
- 8. Matos SM, Jesus SR, Saldiva SR, et al. ; SCAALA (Social Change, Asthma and Allergy in Latin America) Study Group. (2011) Overweight, asthma symptoms, atopy and pulmonary function in children of 4-12 years of age: Findings from the SCAALA cohort in Salvador, Brazil. Public Health Nutrition 14(7): 1270–1278. [DOI] [PubMed] [Google Scholar]
- 9. Pan G, Zhang S, Feng Y, et al. (2010) Air pollution and children’s respiratory symptoms in six cities of Northern China. Respiratory Medicine 104(12): 1903–1911. [DOI] [PubMed] [Google Scholar]
- 10. Midodzi WK, Rowe BH, Majaesic CM, et al. (2010) Early life factors associated with incidence of physician-diagnosed asthma in preschool children: Results from the Canadian Early Childhood Development cohort study. Journal of Asthma 47(1): 7–13. [DOI] [PubMed] [Google Scholar]
- 11. Gern JE, Visness CM, Gergen PJ, Wood RA, Bloomberg GR, O’Connor GT, Kattan M, Sampson HA, Witter FR, Sandel MT, Shreffler WG, Wright RJ, Arbes SJ, Busse WW. The Urban Environment and Childhood Asthma (URECA) birth cohort study: design, methods, and study population. BMC Pulm Med. 2009. 8;9:17. doi: 10.1186/1471-2466-9-17. [DOI] [PMC free article] [PubMed] [Google Scholar]
- 12. Nicolaou NC, Simpson A, Lowe LA, et al. (2008) Day-care attendance, position in sibship, and early childhood wheezing: A population-based birth cohort study. Journal of Allergy and Clinical Immunology 122(3): 500–506. [DOI] [PubMed] [Google Scholar]
- 13. Morgenstern V, Zutavern A, Cyrys J, et al. ; GINI Study Group; LISA Study Group (2008) Atopic diseases, allergic sensitization, and exposure to traffic-related air pollution in children. American Journal of Respiratory and Critical Care Medicine 177(12): 1331–1337. [DOI] [PubMed] [Google Scholar]
- 14. Galassi C, Forastiere F, Biggeri A, et al. ; Gruppo Collaborativo SIDRIA-2 (2005) SIDRIA second phase: objectives, study design and methods. Epidemiologia e Prevenzione 29 Suppl 2: 9–13. [PubMed] [Google Scholar]
- 15. Duse M, Donato F, Porteri V, et al. (2007) High prevalence of atopy, but not of asthma, among children in an industrialized area in North Italy: The role of familial and environmental factors–a population-based study. Pediatric Allergy and Immunology 18(3): 201–208. [DOI] [PubMed] [Google Scholar]
- 16. Kermode JA, Brown NJ, Hardaker KM, et al. (2011) The effect of airway remodeling on airway hyper-responsiveness in asthma. Respiratory Medicine 105(12): 1798–1804. [DOI] [PubMed] [Google Scholar]
- 17. Johnson CC, Ownby DR, Zoratti EM, et al. (2002) Environmental epidemiology of pediatric asthma and allergy. Epidemiologic Reviews 24(2): 154–175. [DOI] [PubMed] [Google Scholar]
- 18. Gladevich M, Mimouni D, Mimouni M. (2001) Breast-feeding and the risk of bronchial asthma in childhood: a systematic review with meta-analysis of prospective studies. Journal of Pediatrics 139: 261–266. [DOI] [PubMed] [Google Scholar]
- 19. Ip S, Chung M, Raman G, et al. (2007) Breastfeeding and maternal and infant health outcomes in developed countries. Evidence Report / Technology Assessment (153): 1–186. [PMC free article] [PubMed] [Google Scholar]
- 20. Spergel JM. (2010) Epidemiology of atopic dermatitis and atopic March in children. Immunology and Allergy Clinics of North America 30(3): 269–280. [DOI] [PubMed] [Google Scholar]
- 21. Martinez FD, Holt PG. (1999) Role of microbial burden in aetiology of allergy and asthma. Lancet 354 Suppl 2: SII12–15. [DOI] [PubMed] [Google Scholar]
- 22. Kurosaka F, Terada T, Tanaka A, et al. (2011) Risk factors for wheezing, eczema and rhinoconjunctivitis in the previous 12 months among six-year-old children in Himeji City, Japan: food allergy, older siblings, day-care attendance and parental allergy history. Allergology International 60(3): 317–330. [DOI] [PubMed] [Google Scholar]
- 23. Strachan DP. (1989) Hay fever, hygiene, and household size. BMJ 299: 1259–1260. [DOI] [PMC free article] [PubMed] [Google Scholar]
- 24. Martinez FD. (1994) Role of viral infections in the inception of asthma and allergies during childhood: Could they be protective? Thorax 49: 1189–1191. [DOI] [PMC free article] [PubMed] [Google Scholar]
- 25. Johnson CC, Ownby DR, Zoratti EM, et al. (2002) Environmental epidemiology of paediatric asthma and allergy. Epidemiologic Reviews 24: 154–175. [DOI] [PubMed] [Google Scholar]
- 26. McGeady SJ. (2004) Immunocompetence and allergy. Pediatrics 113: 1107–1113. [PubMed] [Google Scholar]
- 27. Illi S, von Mutius E, Bergman R, et al. (2001) Early childhood infectious diseases and the development of asthma up to school age: A birth cohort study. BMJ 322: 390–395. [DOI] [PMC free article] [PubMed] [Google Scholar]
- 28. Braun-Fahrlander C, Riedler J, Herz U, et al. (2002) Environmental exposure to endotoxin and its relation to asthma in school-age children. New England Journal of Medicine 347: 869–877. [DOI] [PubMed] [Google Scholar]
- 29. Venn AJ, Lewis SA, Cooper M, et al. (2001) Living near a main road and the risk of wheezing illness in children. American Journal of Respiratory and Critical Care Medicine 164(12): 2177–2180. [DOI] [PubMed] [Google Scholar]
- 30. Karimi M, Mirzaei M, Baghiani Moghadam B, et al. (2011) Pet exposure and the symptoms of asthma, allergic rhinitis and eczema in 6-7 years old children. Iranian Journal of Allergy Asthma and Immunology 10(2): 123–127. [PubMed] [Google Scholar]