

Abstract
The mammalian target of rapamycin (mTOR) is a crucial kinase present in all cells. Besides its role in the regulation of cell-growth, proliferation, angiogenesis, and survival of malignant tumors, mTOR additionally plays an important role in immune regulation by controlling the balance between effector T cells and regulatory T cells (Tregs). This critically affects the suppressive state of the immune system. Here, the systemic immunological effects of everolimus treatment were comprehensively investigated in five patients with metastatic renal cell cancer. In this hypothesis generating study, the immunological alterations in circulating immune subsets induced by everolimus included a (non-significant) increase in the frequency of Tregs, a significant increase in monocytic myeloid-derived suppressor cells, a significant decrease in the frequency of immunoregulatory natural killer cells, classical CD141+ (cDC1) and CD1c+ (cDC2) dendritic cell subsets, as well as a decrease in the activation status of plasmacytoid dendritic cells and cDC1. These date indicate that the immunological effects of everolimus affect multiple immune cell subsets and altogether tip the balance in favor of immunosuppression, which can be considered a detrimental effect in the treatment of cancer, and may require combination treatment with agents able to negate immune suppression and boost T cell immunity.
Keywords: everolimus, immune monitoring, mTOR, suppression, Treg
Introduction
Kidney cancer is among the 10 most common cancers in both men and women and accounts for approximately 62,700 new cases and 14,240 estimated deaths in 2016.1 Renal cell carcinoma (RCC) is the most prevalent primary tumor arising in the kidney. The classification of RCC has changed recently, resulting in more than 10 subtypes, among which clear cell, papillary and chromophobe RCC have the highest incidence.2
In the past 10 years, the treatment of metastatic RCC (mRCC) has changed significantly. First with the introduction of targeted agents inhibiting the vascular endothelial growth factor (VEGF)–signaling pathway and the kinase mammalian target of rapamycin (mTOR)3 and more recently with the introduction of nivolumab, a monoclonal antibody that targets the programmed cell death 1 (PD-1) immune checkpoint,4 and cabozantinib—a multi-tyrosine kinase inhibitor of MET, AXL, and VEGF.5,6 Both nivolumab and cabozantinib have been shown to be more effective than the mTOR inhibitor everolimus in clinical trials and have thereby replaced everolimus as the second-line therapy after VEGF-targeted therapy.7 The combination of everolimus and the multitarget tyrosine kinase inhibitor lenvatinib has also been shown to improve progression-free survival in patients with mRCC compared to everolimus alone following one prior antiangiogenic therapy.8,9
Everolimus is a derivate of rapamycin, and it acts as an inhibitor of mTOR, a crucial kinase present in all cells, by regulating cell growth, proliferation, angiogenesis, and survival. Furthermore, it plays an important role in immune regulation by controlling homeostasis and the balance between effector T cells and regulatory T cells (Tregs).10–13
CD4+CD25hiFoxP3+ Tregs are immunoregulatory T cells which express the transcription factor FoxP314 and have been shown to be important regulators of immunological tolerance.15 It was shown in vitro16–19 as well as in vivo20 that inhibition of mTOR using rapamycin resulted in expansion of Tregs. In addition, two recent publications confirmed similar effects for the mTOR inhibitor everolimus.21,22 Of note, the effect of everolimus on other important immune subsets, like myeloid subsets and natural killer (NK) cells, has not been previously studied.
Here, we set out to perform a more comprehensive analysis to study the systemic immunological effects of everolimus treatment in a small exploratory cohort of patients with mRCC. We report that treatment of mRCC patients with everolimus resulted in an expected increase in Treg percentages, and also in a significant increase in myeloid-derived suppressor cells (MDSC) and a significant decrease in the frequency and activation status of several dendritic cell (DC) subsets. Together these data indicate that treatment with everolimus results in a generalized suppressed state of the immune system, which can be considered to be a detrimental effect in the treatment of mRCC, and support the notion that reversing this immunosuppressive effect of everolimus could enhance its therapeutic efficacy.
Materials and methods
Study population
Five patients with mRCC and disease progression during treatment with sunitinib were treated with everolimus monotherapy. Detailed patient characteristics are described in Table 1. The study was conducted in accordance with the ethical principles that have their origin in the Declaration of Helsinki and are consistent with International Conference on Harmonization (ICH) Guidelines for Good Clinical Practice. The Medical Ethical Committee of the VU University Medical Center, Amsterdam, the Netherlands, and the Central Committee on Research Involving Human Subjects (CCMO) approved the study protocol. All patients gave written informed consent. The five patients were included from January until November 2012.
Table 1.
Patient characteristics.
| Sex | Age (years) | WHO performance status | Date of primary diagnosis (month-year) | Date metastatic disease (month-year) | Histological subtype | Previous treatment | Treatment duration everolimus (weeks) | Best clinical response | Reason for EOT | Dose modifications |
|---|---|---|---|---|---|---|---|---|---|---|
| F | 76 | 1 | 04-2006 | 04-2006 | Clear cell | Sunitinib | 24 | SD | Progression | Interruption of medication 1 day |
| F | 74 | 2 | 11-2011 | 11-2011 | Clear cell | Sunitinib | 4 | PD | Progression | Interruption of medication for 3 days |
| M | 77 | 1 | 01-2009 | 09-2011 | Clear cell | Sunitinib | 12 | SD | Patient’s request | Interruption of medication for 1 day |
| M | 58 | 1 | 03-2007 | 03-2007 | Clear cell | Sunitinib | 57 | SD | Progression | Dose lowered to 5 mg daily after week 8 due to adverse event |
| F | 56 | 1 | 07-2012 | 07-2012 | Clear cell | Sunitinib | 4 | PD | Progression | None |
Immune monitoring
Peripheral blood was collected for extensive monitoring at baseline and subsequently at 2, 4, and 8 weeks after the start of the study treatment period until disease progression. For immune monitoring, 60 mL heparinized blood was collected. In addition, whole blood was collected in PAXgene tubes (PreAnalytiX GmbH, Hombrechtikon, Switzerland). All materials were processed on the same day the blood was drawn.
Cell isolation
Peripheral blood mononuclear cells (PBMC) were isolated from heparinized blood of patients by density-gradient centrifugation with Lymphoprep (Axis-Shield, Oslo, Norway). After isolation, PBMC were stored overnight at 4°C in RPMI 1640 (Lonza, Basel, Switzerland) supplemented with 100 I.E./mL sodium penicillin (Astellas Pharma, Leiden, The Netherlands), 100 mg/mL streptomycin sulfate (Radiumfarma-Fisiofarma, Naples, Italy), 2.0 nM L-glutamine (Life Technologies, Bleiswijk, The Netherlands), 10% fetal bovine serum (FBS; HyClone, Amsterdam, The Netherlands), and 0.05 mM 2-ME (Merck; Darmstadt, Germany), hereafter referred to as complete medium. The next day, cells were stained for flow cytometric analysis. In case of sufficient cell numbers, cells were cryopreserved in liquid nitrogen for additional analysis.
Flow cytometry
PBMC were analyzed by flow cytometry using fluorescein isothiocyanate- (FITC), phycoerythrin- (PE), peridinin chlorophyll protein-Cy5.5- (PerCP), or allophycocyanin (APC)-labeled Abs directed against human CD3, CD4, CD11c, CD14, CD15, CD16, CD19, CD25, CD56, CD86, CD123, CTLA-4, HLA-DR, Ki-67, TCR-pan γδ (all BD Biosciences, New Jersey, USA), CD33, CD40, TCR-Vα24, -Vβ11, -Vδ2 (Beckman Coulter Inc., California, USA), TCR-Vγ9 (Biolegend, San Diego, USA), CD56 (IQ Products, Groningen, The Netherlands), CD11b, CD147 (eBioscience, San Diego, CA), and blood DC antigens BDCA1, BDCA2, BDCA3 (all from Miltenyi Biotec, Bergisch Gladbach, Germany), and matching isotype control antibodies. Stainings were performed in phosphate-buffered saline (PBS) supplemented with 0.1% bovine serum albumin (BSA) and 0.02% sodium azide for 30 min. Intracellular staining was performed after fixation and permeabilization using a fixation/permeabilization kit according to the manufacturer’s protocol (eBioscience). For staining of FoxP3, a PE-labeled Ab against FoxP3 (clone PCH101, eBioscience) was used.
For intracellular cytokine staining, PBMC from mRCC patients treated with everolimus were either left unstimulated or stimulated for 4 h with 50 ng/mL phorbol myristate acetate (PMA) and 500 ng/mL ionomycin in the presence of brefeldin A (1:500; GolgiPlug, BD Biosciences) and stained for CD3, CD4, IFN-γ, IL-4, TNF-α, IL-5, IL-2 (all BD Biosciences), and IL-17A (eBioscience) using the BD fixation/permeabilization kit. Live cells were gated based on forward and side scatter and analyzed on a BD FACSCalibur (BD Biosciences) using Kaluza Analysis Software (Beckman Coulter).
Functional Treg analysis
Cryopreserved PBMC from patients were thawed in complete medium supplemented with 10 μg/mL DNase (Roche Diagnostics GmbH, Mannheim, Germany). As previously described,21 CD4+ T cells were isolated using the untouched CD4+ T cell isolation kit (Miltenyi Biotec) according to the manufacturer’s protocol. Next, CD4+CD25+ cells were isolated over two consecutive magnetic columns using CD25 MicroBeads (Miltenyi Biotec), as previously published.21 After isolation, cells were rested overnight in RPMI 1640 (Lonza) supplemented with 100 I.E./mL sodium penicillin (Astellas Pharma), 100 μg/mL streptomycin sulfate (Radiumfarma-Fisiofarma), 2.0 nM L-glutamine (Life Technologies), 10% pooled human AB serum (MP Biomedicals, Ohio, USA), and 0.02 mM pyruvic acid (Sigma, St. Louis, USA) culture medium containing low-dose IL-2 (50 IU/ mL, Proleukin, Novartis, Arnhem, The Netherlands). The next day, the capacity of isolated CD4+CD25+ cells derived from patient PBMC to suppress proliferation of allogeneic CD8+ T responder cells was determined by labeling responder T cells with 1 μM carboxyfluorescein diacetate succinimidyl ester (CFSE; Sigma–Aldrich) before subsequent culture in a 96-well round-bottom plate in culture medium in the presence of 1 μg/mL anti-CD3 mAb, 1 μg/mL anti-CD28 mAb (clones 16A9 and 15E8, kindly provided by Dr René van Lier, Sanquin, Amsterdam, The Netherlands) and 20 U/mL IL-2 with or without the addition of CD4+CD25+ cells derived from patient PBMC in a CD4+CD25+ T cell/ CD8+ T cell responder ratio of 1:1 and, in case of sufficient cell numbers, also in a 1:2 ratio. After 4 days of co-culture, cells were stained with APC-labeled CD8 (BD Biosciences) and proliferation of CD8+ responder T cells was analyzed by assessing CFSE dilution. For both experiments, the same CD8+ effector T cell donor was used. Experiments for the individual patient were performed in parallel.
RNA isolation, complementary DNA synthesis, and quantitative polymerase chain reaction
RNA was isolated from the PAXgene tubes using the PAXgene RNA isolation kit (PreAnalytiX) according to the manufacturer’s protocols. A DNase (QIAGEN Benelux BV) step was included to remove any genomic DNA. RNA quantity and purity were determined using a NanoDrop spectrophotometer (NanoDrop Technologies, Wilmington, DE, USA). An amount of 250 ng of RNA was used for complementary DNA (cDNA) synthesis, which was performed using the RevertAid H Minus cDNA Synthesis Kit (Thermo Scientific, Waltham, MA, USA) according to the manufacturer’s protocol, as previously published.23 The messenger RNA (mRNA) expression of IL-10, transforming growth factor β (TGFβ), and arginase was measured on cDNA by quantitative polymerase chain reaction (qPCR), performed at ServiceXS (ServiceXS B.V., Leiden, The Netherlands) using the 96.96 BioMark™ Dynamic Array for Real-Time PCR (Fluidigm Corporation, San Francisco, CA, USA) according to the manufacturer’s instructions. Thermal cycling and real-time imaging of the BioMark array were done on the BioMark instrument, and cycle threshold (CT) values were extracted using the BioMark Real-Time PCR analysis software. The following primers were used: Hs00174086_MI for IL-10, Hs00171257_MI for TGFβ, and Hs00968979_MI for arginase (genes IL10, TGFB1, and ARG1, respectively). To calculate arbitrary values of mRNA levels and to correct for differences in primer efficiencies, a standard curve was constructed. Expression levels of target genes were calculated relative to the housekeeping gene glyceraldehyde-3-phosphate dehydrogenase (GAPDH).
Statistical analysis
One-way repeated measures analysis of variance (ANOVA) was used to determine the statistical significance of differences between groups with Dunnett’s Multiple Comparison test as post-test. Data from week 8 could not be included due to missing values as a result of disease progression; therefore, statistics were calculated comparing week 0 to weeks 2 and 4, respectively. Findings were considered statistically significant when P-values were ⩽0.05, as indicated with asterisks (*P ⩽ 0.05, **P < 0.01, ***P < 0.001). Statistical analyses were performed using GraphPad Prism software (version 7.0a, 2016).
Results
Patient characteristics
Five patients with mRCC and disease progression after treatment with sunitinib received everolimus at the oral standard dose of 10 mg once daily. Patient characteristics are shown in Table 1. Mean treatment duration was 20.2 weeks, which is comparable to the previously published results by Motzer et al.24 Four mRCC patients were treated with everolimus until disease progression, while one patient stopped treatment at his request, before disease progression occurred. At that point, he had not reported any major adverse events. One patient was treated with the standard dose throughout the complete study period; for two patients, study medication was interrupted for 1 or 3 days due to adverse events; and for one patient, medication was interrupted for 1 day due to a minor, not related, surgical procedure. One patient experienced adverse events leading to the decision of the treating physician to lower the daily dose to 5 mg after 8 weeks of study treatment. Two patients showed progressive disease before immune monitoring on week 8 could be performed. A comprehensive overview of the frequency of all monitored immune cell subsets at baseline and at weeks 2 and 4 after start of treatment is presented in supplementary Table 1. Immune cell subsets in which relevant changes were observed during treatment are discussed in more detail in the following sections.
Treatment with everolimus benefits Treg rates with suppressive capacities
As increased numbers of Tregs are associated with poor prognosis and survival and mTOR inhibitors were shown to enhance Treg proliferation, Treg percentages were determined in patient samples at baseline (t = 0), and at weeks 2, 4, and 8 after start of treatment. Tregs were defined as CD3+CD4+CD25hiFoxP3+ and percentages were determined according to the gating strategy shown in Figure 1(a). Compared to the Treg frequency at baseline, a slight, though not statistically significant, increase was seen during everolimus treatment (Figure 1(b) left panel). In contrast, the frequency of CD4+ T cells remained stable (Figure 1(b) right panel). Furthermore, while absolute numbers of CD4+ T cells showed a non-significant decrease during the first 4 weeks of treatment with everolimus (from 6.6 ± 1.9 × 10⁵/mL (mean ± SEM) at week 0 to 4.0 ± 0.9 × 10⁵/mL at week 2 and 5.1 ± 1.1 × 10⁵/mL at week 4), Treg numbers did not significantly change (2.9 ± 0.7 × 10⁴/mL at baseline, 1.8 ± 0.5 × 10⁴/mL at week 2 and 2.9 ± 0.9 × 10⁴/mL at week 4).
Figure 1.

Effect of everolimus treatment on the frequency of Tregs and their suppressive function. (a) Representative dot plots illustrating the gating strategy applied to analyze Tregs, defined as CD3+CD4+CD25hiFoxP3+, within the total isolated PBMC population. (b) Percentages of Tregs within CD4+ T cells (left graph) and CD4+ T cells within CD3+ T cells (right graph), determined in freshly isolated PBMC from five patients treated with everolimus at baseline and subsequently 2, 4, and 8 weeks after start of treatment. Mean ± SEM are shown. (c) For two patients, sufficient PBMC were available to perform CD4+CD25+ T cell isolation at two time-points. Their capacity to suppress T cell proliferation was tested by measuring CFSE dilution of CD8+ responder T cells stimulated with anti-CD3 mAb, anti-CD28 mAb, and IL-2. Representative histograms showing CFSE dilution of CD8+ responder T cells in the various conditions, upper panels for patient 01 and lower panels for patient 04. Unstimulated CD8+ responder T cells without the addition of anti-CD3 mAb, anti-CD28 mAb, and IL-2 and CD8+ responder T cells stimulated with anti-CD3 mAb, anti-CD28 mAb, and IL-2, both without the addition of isolated CD4+CD25+ T cells (two panels on the left) were used as control conditions. Two panels on the right show the CFSE dilution of responder T cells cultured with CD4+CD25+ T cells isolated from PBMC drawn at time-point 0 and 4 weeks.
In case sufficient PBMC numbers were stored in liquid nitrogen after immune monitoring, which was the case for patients 01 and 04, CD4+CD25+ T cells derived from baseline and week 4 were isolated and suppression assays were performed to investigate Treg function. Isolated CD4+CD25+ T cells were co-cultured with CFSE-labeled CD8+ responder T cells. Cell division of the responder T cells was assessed after a 4-day co-culture period of Treg-enriched cell populations with responder T cells at a 1:1 ratio. For patient 01, the purity of CD4+CD25+ T cells was 90% on week 0 and 93.8% on week 4, with a purity of FoxP3+ cells of 59.1% and 51.3%, respectively. For patient 04, the purity of CD4+CD25+ T cells was 85.1% on week 0 and 76.9% on week 4 with a purity of FoxP3+ cells of 55.5% and 75.3%, respectively. The co-cultures were performed in the presence of 1 μg/mL anti-CD3 mAb, 1 μg/mL anti-CD28 mAb, and 20 U/mL IL-2. As shown in Figure 1(c), isolated CD4+CD25+ T cells from patient PBMC were able to suppress the proliferation of responder T cells both at baseline and at 4 weeks. For patient 04, an increase in suppression of responder T cells was observed at 4 weeks, possibly as a result of the increased purity of FoxP3+ cells after isolation in this patient.
Overall cytokine production is not altered by everolimus treatment
In order to determine which cytokines were produced by T cells from patients before start of treatment with everolimus and after 4 weeks of treatment, PBMC were thawed from liquid nitrogen and stained as described in the “Materials and methods” section for intracellular cytokines. Cytokine production was determined in CD4+ T cells as well as in CD8+ T cells. Both T cell populations showed similar cytokine production patterns and levels. In unstimulated conditions, low levels of intracellular cytokines were produced in CD4+ and CD8+ T cells, with a predominant production of IL-4 in both cell types (Figure 2(a)). However, when PBMC from mRCC patients treated with everolimus were stimulated with 50 ng/mL PMA and 500 ng/mL ionomycin, mainly Th1-type cytokines were produced, that is, IFN-γ, TNF-α, and IL-2 (Figure 2(b)). There was no difference in cytokine production between baseline and week 4.
Figure 2.

Overall T cell cytokine production is not altered by everolimus treatment. (a) Bar graph showing the percentage of IL-17, IFN-γ, IL-4, TNF-α, IL-5, and IL-2 positive cells in unstimulated PBMC from patients with mRCC. Upper panel shows cytokine production in CD4+ T cells, and lower panel shows cytokine production in CD8+ T cells, n = 3–4. (b) Bar graph showing the percentage of IL-17, IFN-γ, IL-4, TNF-α, IL-5, and IL-2 positive cells in patient PBMC stimulated with PMA and ionomycin for 4 h. Upper panel shows cytokine production in CD4+ T cells, and lower panel shows cytokine production in CD8+ T cells, n = 3–4. (c) Graphs showing relative quantification (RQ) values for IL-10 (left graph) and TGFβ (right graph) mRNA expression measured in whole blood in five patients. Each value is derived from three technical replicates. Mean ± SEM are shown.
As the cytokines IL-10 and TGFβ are both known for their immunosuppressive effects in the tumor microenvironment,25,26 IL-10 and TGFβ mRNA levels were determined in whole blood with the use of PAXgene tubes (Figure 2(c)). Although results were not significant, for at least two patients, an increase in IL-10 and TGFβ levels was observed between t = 0 and t = 4, consistent with increased immune suppression.
Everolimus treatment results in a decrease in NK cell rates
NK cells are part of the innate immune system with cytotoxic capacity and the ability to produce immunoregulatory cytokines. Two distinct subsets can be defined, that is, the immunoregulatory CD56brightCD16dim/− and the cytotoxic CD56dimCD16+ subset,27 and rates of both subsets were determined in patient samples. As shown in Figure 3, a significant decrease in immunoregulatory CD56brightCD16dim/− NK cell percentages (within total PBMC) was observed when patients were treated with everolimus for 4 weeks, while the cytotoxic CD56dimCD16+ NK cell frequencies did not significantly change. No significant changes in absolute numbers were observed.
Figure 3.
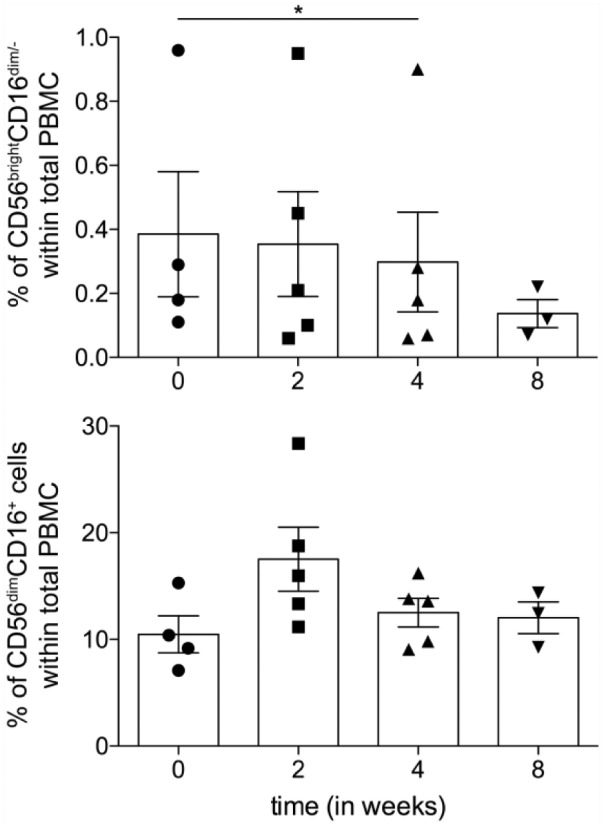
Everolimus treatment results in a decrease in the frequency of immunoregulatory NK cells. NK cell percentages present in patient PBMC. Upper panel shows CD56brightCD16dim/− immunoregulatory NK cells, and lower panel CD56dimCD16+ cytotoxic NK cells. Due to missing values, as a result of disease progression, statistics were performed on data from four patients, comparing week 0 to weeks 2 and 4, respectively. Mean ± SEM are shown; P-values are indicated with asterisk; *P ⩽ 0.05; n = 4 on weeks 0–4; two-way repeated measures ANOVA with Dunnett’s post-test.
Everolimus treatment results in an increase in the frequency of MDSC, and this correlates with increased arginase transcript levels
Since MDSC are key players in the suppressive network, both systemically and within the tumor microenvironment,28 two MDSC subsets were analyzed; monocytic MDSC (mMDSC, defined as Lin−CD14+HLA-DR−) and granulocytic MDSC (gMDSC, defined as CD14−CD11b−CD33+CD15+). Both mMDSC and gMDSC percentages increased during treatment with everolimus; however, only the increase in gMDSC was significant when comparing gMDSC frequencies at baseline with week 4 (Figure 4(a)). Since gMDSC are known for the production of arginase, one of the important factors responsible for the immunosuppressive activity of gMDSC, arginase mRNA levels were measured with the PAXgene system. As shown in Figure 4(b), a significant correlation between the detected arginase levels in whole blood and the percentages gMDSC was observed (Figure 4(b)) suggesting that the observed increase in gMDSC is accompanied by an increase in immunosuppression.
Figure 4.

Increase in MDSC frequencies in response to everolimus correlates with increased arginase expression. (a) Percentages of mMDSC (upper graph) and gMDSC (lower graph) in patient PBMC as assessed by flow cytometry. Mean ± SEM are shown; P-value is indicated with asterisk; *P ⩽ 0.05; n = 5 at weeks 0–4; two-way repeated measures ANOVA with Dunnett’s post-test. (b) Correlation between the frequency of gMDSC and the RQ of arginase mRNA expression. Each point represents an individual data point. P < 0.05, R = 0.53.
Everolimus reduces monocyte and DC frequencies and activation status
In order to assess the effect of everolimus treatment on circulating blood monocytes and myeloid DC (mDC) subsets, the frequency and activation status of several subsets were determined before start of treatment and subsequently after 2, 4, and 8 weeks of everolimus treatment. Monocytes were defined as CD14hiCD11c+, cDC1 as BDCA3+CD14−CD11c+, cDC2 as BDCA1+CD19−CD14−CD11c+, and pDC as BDCA2+CD123+. In addition, the activation status of these four cell types was determined by measuring the median fluorescence intensity (MFI) of CD40 and CD86. As shown in Figure 5, a significant decrease in the frequency of monocytes, cDC1, and cDC2 within total PBMC was observed during the first 2 weeks of treatment while for cDC1, a further decrease was noted at week 4. While no significant differences were observed in the activation status of monocytes and cDC2, a decrease in the activation status of cDC1 occurred as measured by a decreased expression of both CD40 and CD86. No significant differences were seen in pDC cell numbers, though expression of CD86 on this subset also significantly decreased during treatment with everolimus.
Figure 5.

Frequency and activation of monocytes and three different circulating blood DC subsets. Percentages of monocytes (CD14+CD11c+), cDC1 (BDCA3+CD14−CD11c+), cDC2 (BDCA1+CD19−CD14−CD11c+), and pDC (BDCA2+CD123+) were assessed by flow cytometry, and the median fluorescent intensity (MFI) of CD40 and CD86 was determined. Mean ± SEM are shown; P-values are indicated with asterisks; *P ⩽ 0.05, **P < 0.01, ***P < 0.001; one-way repeated measures ANOVA with Dunnett’s post-test.
Discussion
As everolimus was originally introduced to the market as a compound to prevent transplant rejection by inhibiting T cell activation,29 it is somewhat surprising that it is now used in the treatment of cancer; nevertheless, it was already observed that patients treated with rapamycin showed a reduced incidence of de novo malignancies.30 Since the tumor microenvironment is already in an immunosuppressed state and taking into account that rapamycin was shown to induce in vitro16–19 and in vivo20 expansion of Tregs, it is likely that treatment with everolimus contributes to a further increase in the immunosuppressed state in cancer patients. If this is the case, it is conceivable that strategies aimed at alleviating this immunosuppressive effect could enhance its antitumor efficacy.
As shown in this report and recently also by Beziaud et al.,22 treatment with everolimus indeed causes a shift in several parameters that are linked to increased immune suppression. While Beziaud and colleagues mainly focused on the effects of mTOR inhibition on Tregs, we performed more extensive immune monitoring on patient PBMC. Besides showing the effect of everolimus on Tregs, we analyzed the cytokine profile in whole blood and T cells and additionally assessed effects on NK cells, MDSC, monocytes, and peripheral blood DC subsets. We have confirmed that everolimus treatment results in an increase in Treg percentages, while CD4+ T cell percentages remain stable. These results confirm our previously published in vitro data.21 The increased Treg frequency was accompanied by a non-significant increase in mRNA levels of IL-10 and TGFβ. When analyzing ex vivo Tregs in an in vitro suppression assay, we found that the Treg population retained its suppressive function. For patient 04, the suppressive capacities of Tregs isolated at week 4 were even more pronounced compared to Tregs isolated at baseline. Although clearly anecdotal, this is consistent with an increased immune suppressive state post-treatment with everolimus.
When determining cytokine production in CD4+ and CD8+ T cells, both cell types showed a similar cytokine production profile. Interestingly, in the unstimulated condition, both cell types predominantly produced IL-4, showing a Th2-type cytokine production profile, though the frequency of cytokine producing cells was overall very low. In contrast, when stimulated with PMA and ionomycin, a predominant Th1-type cytokine profile was observed, indicating that the T cells of these patients still had the capacity to contribute to a proinflammatory antitumor immune response when appropriately stimulated.
During treatment with everolimus, a significant decrease in the frequency of immunoregulatory CD56brightCD16dim/− NK cells was observed. In contrast, the overall frequency of the cytotoxic CD56dimCD16+ NK cell population did not change significantly. As the NK cell population in cancer patients has already been shown to be compromised,31 treatment with everolimus likely further increases this effect, though this formally requires more extensive analyses which include functional analyses in addition to quantitative analyses.
The immunosuppressive effect of everolimus is further underscored by the observed increase in MDSC frequencies, which correlated with increased arginase expression levels. These data are in accordance with a previous report in which the role of MDSC in a transplant setting was investigated, showing that mTOR inhibition using rapamycin resulted in expansion of MDSC.32 Moreover, in our study, a decrease in monocytes, cDC1, and cDC2 was observed, with diminished activation of the cDC1 subset. These data are in line with earlier reports in which rapamycin was shown to negatively affect DC differentiation and functionality promoting apoptosis, the inhibition of CD86 expression, a decrease in the expression of antigen uptake receptors, and a suppressed anti-inflammatory gene expression by pDC.12,33
The data presented here demonstrate that treatment of mRCC patients with everolimus affects several immune subsets resulting in an overall increased immunosuppressive state systemically. Together with the already suppressed state of the immune system in cancer and the notion that activation of the immune system is beneficial in the treatment of cancer, it is likely that these immunological effects of everolimus on Tregs, MDSC, NK cells, and myeloid subsets limit its effectiveness as an anti-cancer drug. It is tempting to speculate that therapies known to modulate these immunoregulatory cell populations may enhance the antitumor efficacy of everolimus. For example, metronomic cyclophosphamide,34,35 denileukin diftitox (Ontak),36 and daclizumab37 have been reported to deplete Tregs. However, while metronomic cyclophosphamide was shown to have additional beneficial effects on T and NK cell functionality,35 effects of denileukin diftitox and daclizumab were not consistent.38,39 Alternatively, everolimus could be tested in combination with either low doses of IL-2 and IFN-α, as these have been shown to enhance NK cell cytotoxicity,40 or gemcitabine,41 indoleamine 2,3-dioxygenase (IDO) inhibitors42 or histone deacetylase inhibitors (HDACi)43 as these can result in MDSC depletion. Conversely, low-dose IL-2 therapy could again promote Treg expansion, so comprehensive immune monitoring should be performed.
In a currently ongoing phase 1–2 clinical trial, we aim to evaluate whether addition of low-dose oral cyclophosphamide can counteract the detrimental immune effects of everolimus and thereby increase its therapeutic efficacy.
Supplementary Material
Acknowledgments
This study was part of a clinical study (ClinicalTrials.gov Identifier NCT01462214, Netherlands Trial Register number NTR3085) initiated by the Department of Medical Oncology of the VU University Medical Center and conducted within the context of the Netherlands Working Group on Immunotherapy of Oncology (WIN-O) with participation of 13 hospitals.
Footnotes
Author contribution: C.M.H., T.D.J., and H.J.V. conceived and designed the experiments and drafted the manuscript; S.J.S. contributed to the design of the experiments; T.D.G. contributed reagents and analysis tools; and H.M.V. contributed to the design of the study protocol. All authors read and approved the final manuscript.
Declaration of conflicting interests: The author(s) declared no potential conflicts of interest with respect to the research, authorship, and/or publication of this article.
Funding: The trial was supported by the Dutch Cancer Society (grant number: VU 2011-5144) and partly funded by a grant from Novartis Oncology Netherlands.
References
- 1. Siegel RL, Miller KD, Jemal A. (2016) Cancer statistics, 2016. CA: A Cancer Journal for Clinicians 66: 7–30. [DOI] [PubMed] [Google Scholar]
- 2. Moch H, Cubilla AL, Humphrey PA, et al. (2016) The 2016 WHO classification of tumours of the urinary system and male genital organs-part A: Renal, penile, and testicular tumours. European Urology 70: 93–105. [DOI] [PubMed] [Google Scholar]
- 3. Powles T, Chowdhury S, Jones R, et al. (2011) Sunitinib and other targeted therapies for renal cell carcinoma. British Journal of Cancer 104: 741–745. [DOI] [PMC free article] [PubMed] [Google Scholar]
- 4. Motzer RJ, Escudier B, McDermott DF, et al. (2015) Nivolumab versus everolimus in advanced renal-cell carcinoma. The New England Journal of Medicine 373: 1803–1813. [DOI] [PMC free article] [PubMed] [Google Scholar]
- 5. Choueiri TK, Escudier B, Powles T, et al. (2015) Cabozantinib versus everolimus in advanced renal-cell carcinoma. The New England Journal of Medicine 373: 1814–1823. [DOI] [PMC free article] [PubMed] [Google Scholar]
- 6. American Association for Cancer Research (2016) Cabozantinib approved for renal cell carcinoma. Cancer Discovery 6: OF3. [DOI] [PubMed] [Google Scholar]
- 7. Powles T, Staehler M, Ljungberg B, et al. (2016) Updated EAU guidelines for clear cell renal cancer patients who fail VEGF targeted therapy. European Urology 69: 4–6. [DOI] [PubMed] [Google Scholar]
- 8. Motzer RJ, Hutson TE, Glen H, et al. (2015) Lenvatinib, everolimus, and the combination in patients with metastatic renal cell carcinoma: A randomised, phase 2, open-label, multicentre trial. The Lancet Oncology 16: 1473–1482. [DOI] [PubMed] [Google Scholar]
- 9. Motzer RJ, Hutson TE, Ren M, et al. (2016) Independent assessment of lenvatinib plus everolimus in patients with metastatic renal cell carcinoma. The Lancet Oncology 17: e4–e5. [DOI] [PubMed] [Google Scholar]
- 10. Haxhinasto S, Mathis D, Benoist C. (2008) The AKT-mTOR axis regulates de novo differentiation of CD4+Foxp3+ cells. The Journal of Experimental Medicine 205: 565–574. [DOI] [PMC free article] [PubMed] [Google Scholar]
- 11. Delgoffe GM, Kole TP, Zheng Y, et al. (2009) The mTOR kinase differentially regulates effector and regulatory T cell lineage commitment. Immunity 30: 832–844. [DOI] [PMC free article] [PubMed] [Google Scholar]
- 12. Thomson AW, Turnquist HR, Raimondi G. (2009) Immunoregulatory functions of mTOR inhibition. Nature Reviews Immunology 9: 324–337. [DOI] [PMC free article] [PubMed] [Google Scholar]
- 13. Weichhart T, Säemann MD. (2009) The multiple facets of mTOR in immunity. Trends in Immunology 30: 218–226. [DOI] [PubMed] [Google Scholar]
- 14. Van der Vliet HJJ, Nieuwenhuis EE. (2007) IPEX as a result of mutations in FOXP3. Clinical and Developmental Immunology 2007: 89017. [DOI] [PMC free article] [PubMed] [Google Scholar]
- 15. Sakaguchi S. (2005) Naturally arising Foxp3-expressing CD25+CD4+ regulatory T cells in immunological tolerance to self and non-self. Nature Immunology 6: 345–352. [DOI] [PubMed] [Google Scholar]
- 16. Battaglia M, Stabilini A, Roncarolo MG. (2005) Rapamycin selectively expands CD4+CD25+FoxP3+ regulatory T cells. Blood 105: 4743–4748. [DOI] [PubMed] [Google Scholar]
- 17. Battaglia M, Stabilini A, Migliavacca B, et al. (2006) Rapamycin promotes expansion of functional CD4+CD25+FOXP3+ regulatory T cells of both healthy subjects and type 1 diabetic patients. The Journal of Immunology 177: 8338–8347. [DOI] [PubMed] [Google Scholar]
- 18. Strauss L, Whiteside TL, Knights A, et al. (2007) Selective survival of naturally occurring human CD4+CD25+Foxp3+ regulatory T cells cultured with rapamycin. The Journal of Immunology 178: 320–329. [DOI] [PubMed] [Google Scholar]
- 19. Strauss L, Czystowska M, Szajnik M, et al. (2009) Differential responses of human regulatory T cells (Treg) and effector T cells to rapamycin. PLoS ONE 4: e5994. [DOI] [PMC free article] [PubMed] [Google Scholar]
- 20. Ruggenenti P, Perico N, Gotti E, et al. (2007) Sirolimus versus cyclosporine therapy increases circulating regulatory T cells, but does not protect renal transplant patients given alemtuzumab induction from chronic allograft injury. Transplantation 84: 956–964. [DOI] [PubMed] [Google Scholar]
- 21. Huijts CM, Santegoets SJ, Quiles Del Rey M, et al. (2016) Differential effects of inhibitors of the PI3K/mTOR pathway on the expansion and functionality of regulatory T cells. Clinical Immunology 168: 47–54. [DOI] [PubMed] [Google Scholar]
- 22. Beziaud L, Mansi L, Ravel P, et al. (2016) Rapalogs efficacy relies on the modulation of antitumor T cell immunity. Cancer Research 76: 4100–4112. [DOI] [PubMed] [Google Scholar]
- 23. de Jong TD, Lübbers J, Turk S, et al. (2016) The type I interferon signature in leukocyte subsets from peripheral blood of patients with early arthritis: A major contribution by granulocytes. Arthritis Research & Therapy 18: 165. [DOI] [PMC free article] [PubMed] [Google Scholar]
- 24. Motzer RJ, Escudier B, Oudard S, et al. (2010) Phase 3 trial of everolimus for metastatic renal cell carcinoma: Final results and analysis of prognostic factors. Cancer 116: 4256–4265. [DOI] [PubMed] [Google Scholar]
- 25. Sato T, Terai M, Tamura Y, et al. (2011) Interleukin 10 in the tumor microenvironment: A target for anticancer immunotherapy. Immunologic Research 51: 170–182. [DOI] [PubMed] [Google Scholar]
- 26. Pickup M, Novitskiy S, Moses HL. (2013) The roles of TGFβ in the tumour microenvironment. Nature Reviews Cancer 13: 788–799. [DOI] [PMC free article] [PubMed] [Google Scholar]
- 27. Vivier E, Tomasello E, Baratin M, et al. (2008) Functions of natural killer cells. Nature Immunology 9: 503–510. [DOI] [PubMed] [Google Scholar]
- 28. Lindau D, Gielen P, Kroesen M, et al. (2013) The immunosuppressive tumour network: myeloid-derived suppressor cells, regulatory T cells and natural killer T cells. Immunology 138: 105–115. [DOI] [PMC free article] [PubMed] [Google Scholar]
- 29. MacDonald AS. (2001) A worldwide, phase III, randomized, controlled, safety and efficacy study of a sirolimus/cyclosporine regimen for prevention of acute rejection in recipients of primary mismatched renal allografts. Transplantation 71: 271–280. [DOI] [PubMed] [Google Scholar]
- 30. Kauffman HM, Cherikh WS, Cheng Y, et al. (2005) Maintenance immunosuppression with target-of-rapamycin inhibitors is associated with a reduced incidence of de novo malignancies. Transplantation 80: 883–889. [DOI] [PubMed] [Google Scholar]
- 31. Bauernhofer T, Kuss I, Henderson B, et al. (2003) Preferential apoptosis of CD56dim natural killer cell subset in patients with cancer. European Journal of Immunology 33: 119–124. [DOI] [PubMed] [Google Scholar]
- 32. Nakamura T, Nakao T, Yoshimura N, et al. (2015) Rapamycin prolongs cardiac allograft survival in a mouse model by inducing myeloid-derived suppressor cells. American Journal of Transplantation 15: 2364–2377. [DOI] [PubMed] [Google Scholar]
- 33. Cao W, Manicassamy S, Tang H, et al. (2008) Toll-like receptor-mediated induction of type I interferon in plasmacytoid dendritic cells requires the rapamycin-sensitive PI(3)K-mTOR-p70S6K pathway. Nature Immunology 9: 1157–1164. [DOI] [PMC free article] [PubMed] [Google Scholar]
- 34. Ghiringhelli F, Larmonier N, Schmitt E, et al. (2004) CD4+CD25+ regulatory T cells suppress tumor immunity but are sensitive to cyclophosphamide which allows immunotherapy of established tumors to be curative. European Journal of Immunology 34: 336–344. [DOI] [PubMed] [Google Scholar]
- 35. Ghiringhelli F, Menard C, Puig PE, et al. (2007) Metronomic cyclophosphamide regimen selectively depletes CD4+CD25+ regulatory T cells and restores T and NK effector functions in end stage cancer patients. Cancer Immunology, Immunotherapy 56: 641–648. [DOI] [PMC free article] [PubMed] [Google Scholar]
- 36. Bacha P, Williams DP, Waters C, et al. (1988) Interleukin 2 receptor-targeted cytotoxicity. Interleukin 2 receptor-mediated action of a diphtheria toxin-related interleukin 2 fusion protein. The Journal of Experimental Medicine 167: 612–622. [DOI] [PMC free article] [PubMed] [Google Scholar]
- 37. Queen C, Schneider WP, Selick HE, et al. (1989) A humanized antibody that binds to the interleukin 2 receptor. Proceedings of the National Academy of Sciences of the United States of America 86: 10029–10033. [DOI] [PMC free article] [PubMed] [Google Scholar]
- 38. Attia P, Maker AV, Haworth LR, et al. (2005) Inability of a fusion protein of IL-2 and diphtheria toxin (Denileukin Diftitox, DAB389IL-2, ONTAK) to eliminate regulatory T lymphocytes in patients with melanoma. Journal of Immunotherapy 28: 582–592. [DOI] [PMC free article] [PubMed] [Google Scholar]
- 39. Jacobs JFM, Punt CJA, Lesterhuis WJ, et al. (2010) Dendritic cell vaccination in combination with anti-CD25 monoclonal antibody treatment: A phase I/II study in metastatic melanoma patients. Clinical Cancer Research 16: 5067–5078. [DOI] [PubMed] [Google Scholar]
- 40. Pavone L, Fanti G, Bongiovanni C, et al. (2009) Natural killer cell cytotoxicity is enhanced by very low doses of rIL-2 and rIFN-alpha in patients with renal cell carcinoma. Medical Oncology 26: 38–44. [DOI] [PubMed] [Google Scholar]
- 41. Suzuki E, Kapoor V, Jassar AS, et al. (2005) Gemcitabine selectively eliminates splenic Gr-1+/CD11b+ myeloid suppressor cells in tumor-bearing animals and enhances antitumor immune activity. Clinical Cancer Research 11: 6713–6721. [DOI] [PubMed] [Google Scholar]
- 42. Schafer CC, Wang Y, Hough KP, et al. (2016) Indoleamine 2,3-dioxygenase regulates anti-tumor immunity in lung cancer by metabolic reprogramming of immune cells in the tumor microenvironment. Oncotarget 7: 75407–75424. [DOI] [PMC free article] [PubMed] [Google Scholar]
- 43. Wang H-F, Ning F, Liu Z-C, et al. (2017) Histone deacetylase inhibitors deplete myeloid-derived suppressor cells induced by 4T1 mammary tumors in vivo and in vitro. Cancer Immunology, Immunotherapy 66: 355–366. [DOI] [PMC free article] [PubMed] [Google Scholar]
Associated Data
This section collects any data citations, data availability statements, or supplementary materials included in this article.