Abstract
Background
The six-minute walk test (6MWT) is considered to be a simple and inexpensive tool for the assessment of functional tolerance of submaximal effort. The aim of this work was 1) to background the nonlinear nature of the energy expenditure process due to physical activity, 2) to compare the results/scores of the submaximal treadmill exercise test and those of 6MWT in pulmonary patients and 3) to develop nonlinear mathematical models relating the two.
Methods
The study group included patients with the COPD. All patients were subjected to a submaximal exercise test and a 6MWT. To develop an optimal mathematical solution and compare the results of the exercise test and the 6MWT, the least squares and genetic algorithms were employed to estimate parameters of polynomial expansion and piecewise linear models.
Results
Mathematical analysis enabled to construct nonlinear models for estimating the MET result of submaximal exercise test based on average walk velocity (or distance) in the 6MWT.
Conclusions
Submaximal effort tolerance in COPD patients can be effectively estimated from new, rehabilitation-oriented, nonlinear models based on the generalized MET concept and the 6MWT.
Introduction
Even though the double labeled water method is considered the most general technique to estimate energy expenditure due to physical activity [1], it is commonly accepted that using the VO2max is a valid measure of functional capacity for patients with cardiopulmonary diseases. Many studies have been conducted to estimate the VO2max values based on the cycle exercise test, treadmill test, walk tests [1–4] and, on the other hand, running performance [5]. However, there is also evidence that submaximal exercise testing can be inaccurate for determining VO2max which cannot be estimated by prediction equations in patients with stable COPD [6]. Searching for possible reasons for the inaccuracies we trace back to the work of Åstrand and Rodehl [7], who assumed the linear relationship between VO2max and power output during incremental exercise. The function is linear indeed, but during low power output exercise only. At (sub)maximal exercise testing performed above the anaerobic/lactate threshold (ALT) [8–10], the oxygen uptake becomes essentially nonlinear with respect to the power output [10, 11]. It is well known that the recalled anaerobic/lactate parameter has little to do with “threshold” in fact as it may vary between individuals and also it may depend on various conditions, including environmental ones. Specifically, athletes may have very high ALTs but chronically sick patients may face very low values of ALT. In any case, nonlinearity of relationship between VO2max and power output should be accounted for when precisely modeling functional capacity of populations under (sub)maximal exercise tests.
From a clinical point of view it is essential to prescribe an “optimal” level of training loads in patients with cardiopulmonary diseases. For this purpose submaximal exercise test (ET) is usually performed. It defines the amount of effort that a patient can safely perform, and allows to define exercise heart rate limit for each patient. Exercise test result is expressed in Watts or METs. The most commonly used ET protocol for patients with cardiopulmonary dysfunction is the modified Bruce treadmill protocol, where the result is expressed in METs.
One MET is defined as 1 kcal/kg/hour and is roughly equivalent to the energy cost of sitting quietly. A MET unit is also defined as oxygen uptake in ml/kg/min with one MET equal to the oxygen cost of sitting quietly, equivalent to some 3.5 ml/kg/min [12]. However, there is also evidence in literature that MET may not be a good indicator of oxygen consumption [12, 13].
Considering that 6MWT is a simple and inexpensive tool for the assessment of functional tolerance of submaximal effort and it aims at global and integrated assessment of functioning of all systems engaged in fast walking, such as respiratory, cardio-vascular and neuromuscular systems [14, 15], the 6MWT is frequently used to determine functional capacity in patients [16, 17]. Research conducted by Solway et al [18], comparing the usefulness of various walk tests for efficiency tolerance assessment, showed that the six-minute walk test is the most useful type of walk tests, best tolerated by patients and correlating with the ability to undertake daily activity efforts [4]. The six-minute walk test is considered an indicator of the ability to undertake daily activity and may be used for elderly patients and for patients with COPD and after myocardial infarction [19–23]. Additionally, 6MWT shows moderate and high (linear) correlation (0.69 < r < 0.91) with maximal oxygen uptake derived from a cardiopulmonary exercise test in a well-defined group of patients [24]. The question left unanswered is whether it is possible to effectively estimate the ET results on the basis of 6MWT for wide-spectrum COPD patients.
The aim of this work is to compare results of the submaximal exercise test and results of 6MWT, expressed in METs, in patients with wide-range COPD-related dysfunctions and to develop mathematical correlations between them. The study was approved by the Committee of Ethics, Opole Chamber of Physicians (No. 139/2012).
Methods
Study population. The study included 299 patients (140 female, 159 male) with diagnosed COPD (stages I to III) treated at the Physiotherapy Department, MSW Hospital in Glucholazy, Poland, between 2013–2016 (Table 1).
Table 1. Baseline characteristics of the entire study sample.
| Number of COPD patients | 299 |
| Average age (±SD) | 56.43 (±6.13) |
| Average range (years) | 40–65 |
| Average body mass (±SD) | 83.88 (±9.72) |
| Average height (±SD) | 171.20 (±10.49) |
The study group included patients undergoing physiotherapy, who agreed to participate in the study. Informed written consent was obtained from all patients. Exclusion criteria included absolute contraindications to initiation of physical training, fever, infections and inflammations, diseases and injuries of musculoskeletal system impairing movement, unstable diabetes and mental illnesses. All the patients were subjected to a submaximal exercise test, without stopping pharmacological treatment. On the following day, a six-minute walk test was performed. In the submaximal exercise test, HR limit for all patients was established at the level of 70 to 80% of predicted maximal heart rate. The maximal heart rate was calculated for each patient individually, using the following equation: HRmax = 208 − 0.7 × age [25].
Effort tolerance assessment was made on the basis of the ET on the Cardioperfect treadmill. The ET was carried out using the modified Bruce protocol. Fifteen patients in the group participating in the study did not achieve their determined pulse values and exercise test termination was caused by occurring subjective or objective symptoms of effort intolerance. The six-minute walk test was carried out in the corridor, 30 meters in length, closed for common use for the duration of the test. The test protocol met the ATS guidelines for the 6MWT [23].
Our reference will be treadmill exercise tests, the common tool for estimation of submaximal effort tolerance. In order to introduce to an application of the 6MWT we firstly offer the
Unified distance/velocity-related framework for treadmill exercise tests
Denote by T and D the results of any fix-paced treadmill exercise test in minutes (walk time) and meters (walk distance), respectively.
Then we have
| (1) |
where
Ts, i − duration of the ith stage of test, i = 1, …, S + 1 [min]
vi − treadmill velocity at the ith stage of test, i = 1, …, S + 1 [km/h] = 1000/60 [m/min] = 50/3 [m/min]
S − number of stages completed,
- δD − distance walked during the (S + 1)th stage (uncompleted)
with δD < Ts,S+1 vS+1 50/3 [m](2) - δTs,S+1 − walk time at the (S + 1)th stage (uncompleted)
with δTs,S+1 < Ts,S+1 [min](3)
The walk time
| (4) |
converted into the test result M in METs (via VO2max) can now be related with the walk distance D as in (1) or the average walk velocity v = D/T [m/min] = (3/50) D/T [km/h], giving M = MD(D) or M = Mv(v), respectively (instead of M = MT(T)). In the 6MWT environment, featuring v6M = D/6 [m/min] = D/100 [km/h], they will be substituted with M = M6M(10−2 D) or, equivalently, M = M6M(v).
Example: Modified Bruce (mBruce) protocol to be used hereinafter. For the mBruce protocol we have Ts,i = Ts = 3 [min], i = 1, …, S, so that
| (5) |
with δD = (50/3)δTs,S+1vS+1 [m], δTs,S+1 = T − STs [min] and vi [m/min] = (3/50) [km/h], i = 1, …, S + 1, as specified (for particular stages) in the mBruce protocol. Now, a table for the mBruce protocol could be supplemented with e.g. distance-related data in meters (or velocity-related data in km/h) but we refrain from recalling the supplemented table for space-saving reasons. Rather, we exemplify the calculations for one specific treadmill score, e.g. T = 10.5 [min], M = 5.95 [MET], for which we have S = 3, v1 = v2 = v3 = 2.7 [km/h], v4 = 4.0 [km/h], δTs,4 = 1.5 [min], δD = 100 [m], D = 505 [m], v = (3/50)D/T [km/h] = 2.886 [km/h] and, reffering to the 6MWT, v6M = (D/100) [km/h] = 5.05 [km/h]. Comparing the values of v and v6M, the example clearly supports the well-known fact that the 6MWT is less exhausting than the treadmill test.
6MWT models
Applications of the simple, affordable and reproducible 6MWT have been presented in such a plethora of publications that any collection of references could by no means be considered complete. We recall a selected series of recent 6MWT-related contributions covering various medical fields [26–33], in addition to pulmonary rehabilitation highlights [15, 16, 21, 34–37]. It is striking that in the overwhelming majority of those publications the linear regression tools were employed and linearized models have been used, resulting in rather high standard deviations of the involved random variables. No wonder that many limitations have been reported in the usefulness of the otherwise simple 6MWT [38–40]. We will show how to relax some of them, in particular those related to the nonlinearity of the problem.
The first mathematical model relating the energy expenditure M with the average patient’s velocity v = v6M in the context of the 6MWT was proposed by Connors and Hilling [41]
| (6) |
| (7) |
Note that it does not matter too much whether the velocity v is expressed in mph or km/h as the parameter at v is anyway estimated. Still, we prefer the metric system since, with the walk time T = 6 [min], the abscissa velocity scale in km/h will be equivalent to scaling it with distance 10−2 D in meters. (Alternatively, the abscissa velocity scale in 102 km/h will correspond to that for distance D in meters.)
It is funny that the above linear model M1 = f1(v) was sometimes used in the rehabilitation practice in the form (6) rather than in the simpler form (7). Today, with a quite symbolic value of the model (6) or (7), it is worth emphasizing that the model is directly related with the definition of MET, with its resting value of unity being equivalent to oxygen uptake of 3.5 ml/kg/min. Also note that the uptake value could as well be equal to e.g. 3.4 or 3.6, without affecting the unity MET value in model (7) but possibly affecting the value(s) of parameter estimate(s). This could result in possible application of a model like (7) to e.g. overweight and obese patients where the O2 uptake of 3.5 ml/kg/min may be questioned [42]. Thus, the model (7) can be considered to cover exceptional cases also, with the resting uptakes different from 3.5 ml/kg/min. In such environments, we could talk about the generalized MET concept, with the model (7) apparently supporting the idea.
Nonlinear models
One of the first attempts at accounting for the nonlinearity in development of a model comparing the 6MWT and MET was the study conducted by Gomberg-Maitland et al., who concluded that 6MWT-related MET can be used in clinical management of less sick patients [43]. However, they employed two-segment piecewise linear models only, in addition to the application of a less useful, ‘reverse’ model D = φ(M), with the resting unity MET voiding. A similar nonlinear reverse characteristic, without a model however, was considered by Beatty et al. [44].
In contrast, a nonlinear model-based approach to oxygen uptake estimation during the incremental shuttle walk test (ISWT) for the purpose of cardiac rehabilitation has interestingly been surveyed and extended by Buckley at al., see [45] and references therein. However, based on our experience in modeling and identification of complex systems, also dynamical ones [46–50], we have to raise a certain reservation to their otherwise outstanding contribution. Namely, the energy expenditure process is a very complex bio-physico-chemical system, so that approximating its nonlinear statics with a very simple, two-parameter, exponential model y = b exp(av), where y and v are the oxygen uptake output and walking speed input, respectively, and a and b are model parameters to be estimated, cannot provide satisfactory estimation accuracy due to underfitting. In fact, the estimate of b equal to some 4.5 is quite far from the typical resting oxygen uptake of some 3.5 ml/kg/min. Note that if we try to match the exponential model to the generalized MET form, with the resting unity MET incorporated no matter what is the resting oxygen uptake, this would lead to the model with b = b0 = 1, with only a single parameter left to be estimated. This would be a disaster in terms of the extreme underfitting. Clearly, the two-parameter exponential model y = b exp(av) is too simple to be effectively used in the energy expenditure modeling task.
Now, the time has come to extend the model (7) to the actual, nonlinear environment. For lucidity, we will refrain from a general, stochastic formulation of our model as this would lead to the inclusion of a sophisticated statistical machinery that might blur the core of the analysis.
Polynomial expansion model
(A deterministic part of) the polynomial expansion model can be expressed as
| (8) |
with K being usually selected in a heuristic way and the unknown parameter vector A = [a1, a2, …, aK]T being analytically least squares (LS) estimated using a linear regression formulation. Note that for v = 0 we have the resting MET equal to 1.
Piecewise linear model
The n-segment piecewise linear model can be presented as
| (9) |
where ai, i = 1, …, n, bj, j = 2, …, n, are the unknown parameters and Vi, i = 1, …, n, are the unknown change points, compare [51, 52].
Note that, due to the linear spline property of the segments, the bj parameters, j = 2, …, n, can be calculated in an analytical way
| (10) |
with b1 = 1 resulting in Mpl = 1 for v = 0. Now, the unknown parameter vector C = [a1, a2, …, an, V1, …, Vn]T could be estimated numerically using the least squares (LS) method. Unfortunately, the estimation problem is highly nonlinear with respect to the parameters V1, …, Vn, so that the numerical LS minimization algorithm is often stuck in a local minimum. A remedy is to use a genetic algorithm (GA) which is much likely to converge to a global minimum. Luckily, the ranges of possible changes in Vis can be easily “guessed” by an expert designer, so this can facilitate the GA procedure. Nonetheless, we have succeeded in the development of a combined LS/GA minimization procedure which is effectively used here.
Remark 1. In order to discriminate between the above specified model outputs and results/scores measured from the tests we will denote the estimated model outputs with and the measured system outputs with M, possibly adding the appropriate subindexes wherever necessary.
Results
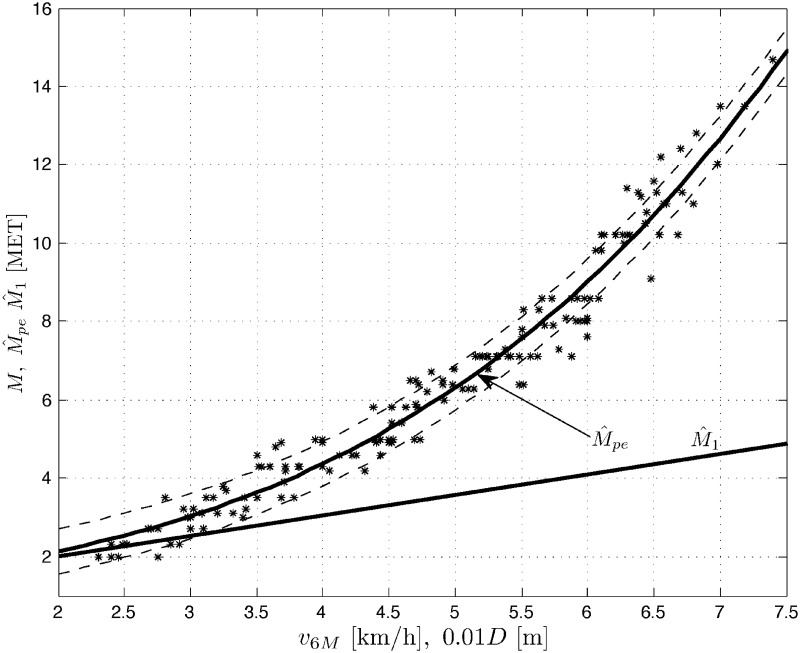
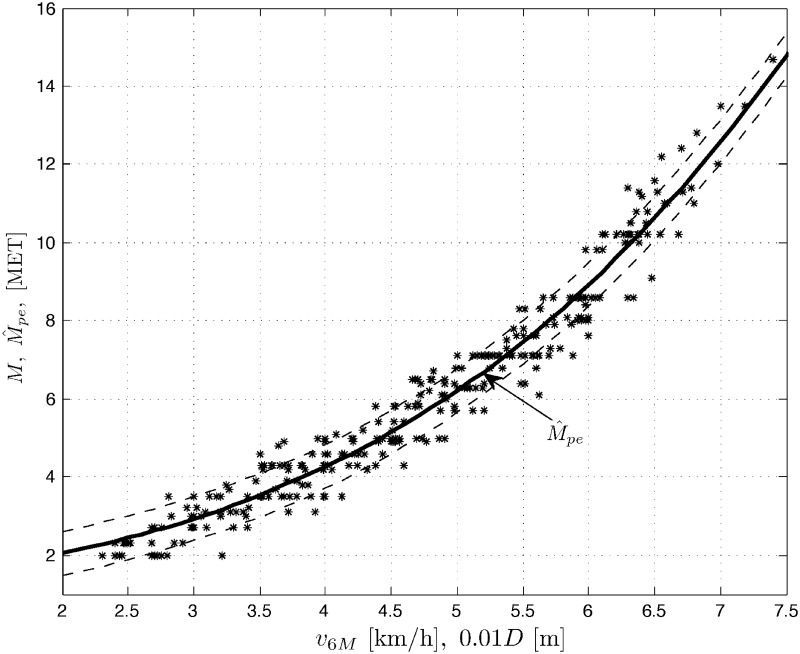
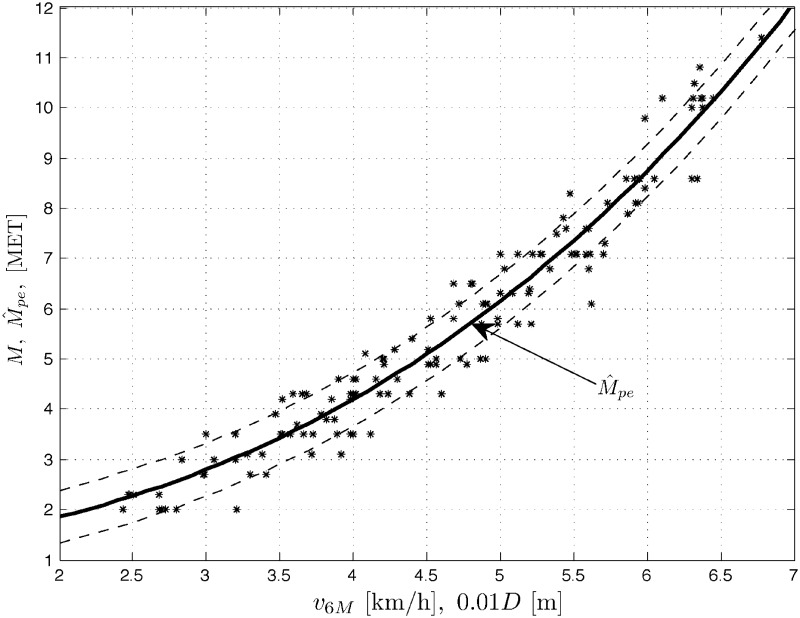
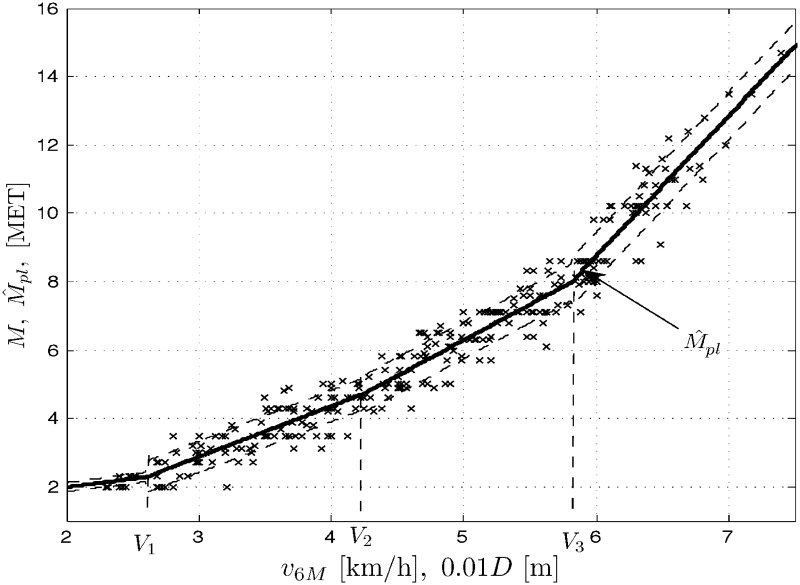
Results M of treadmill exercise tests, measured in METs vs. results of the 6MWT, expressed in velocity v6M [km/h] (or distance 10−2 D [m]) are plotted for men (population Nm = 159), women (Nw = 140) and the whole COPD patient population (Np = Nm + Nw = 299) in Figs 1 to 3, respectively. Three sets of data M vs. v6M suggest nonlinear (stochastic) models. The figures also contain the corresponding outputs from the polynomial expansion models (8) for K = 3 and the marked standard deviation ranges (results for K = 5 are quite comparable). For negative comparison, the output from the (very poor) linear model (7) is only once plotted in Fig 1. Below you can find the sets of the optimal LS parameter estimates and the corresponding root mean square errors , where l = 1, …, N, is the number of consecutive samples of the result M and its modeled value (whose squared difference sum is minimized by the LS method) and N is the total number of samples, with N being equal to Nm, Nw or Np for the populations of men, women and all the COPD patients, respectively.
Fig 1. Data set M vs. v6M (or 10−2 D) and the model outputs and for men patients’ population.
Fig 3. Data set M vs. v6M (or 10−2 D) and the model output for overall patients’ population.
Fig 2. Data set M vs. v6M (or 10−2 D) and the model output for women patients’ population.
It is worth mentioning that increasing the model order K to 9 (or higher odd) leads, unsurprisingly, to an increase in RMSE due to rather highly disturbed measurements M(l).
For negative comparison, the (very poor) linear model (7) applied e.g. to the men’s patient group produces RMSE as high as 3.3969.
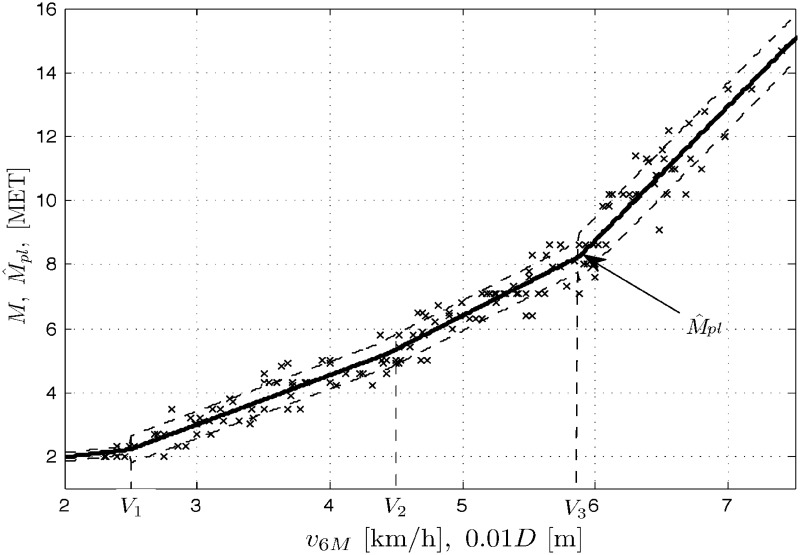
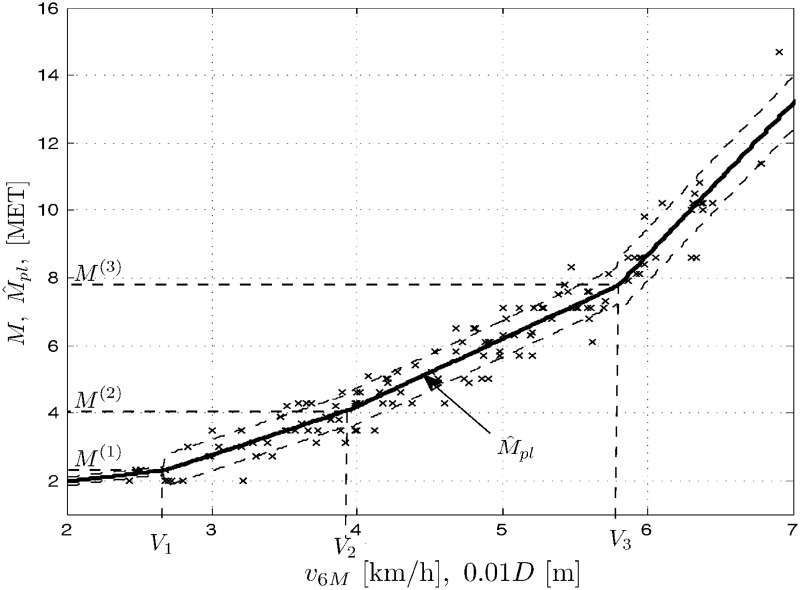
In a similar way, the modeling and simulation work was performed for the three population cases as above and the piecewise linear model (9). In addition to the data sets as above, Figs 4 to 6 present the corresponding outputs from the piecewise linear models (9) for n = 4 and the marked standard deviation ranges. Below you can find the sets of the optimal LS/GA parameter estimates and the corresponding mean square errors for the populations of men, women and all the COPD patients.
Fig 4. Data set M vs. v6M (or 10−2 D) and the model outputs for men patients’ population.
Fig 6. Data set M vs. v6M (or 10−2 D) and the model outputs for overall patients’ population.
Unsurprisingly, RMSE values while using models (8) and (9) are quite close to each other. We can preliminary say that both models can be (almost) equally accurate for the modeling task considered.
Cross-validation for model selection
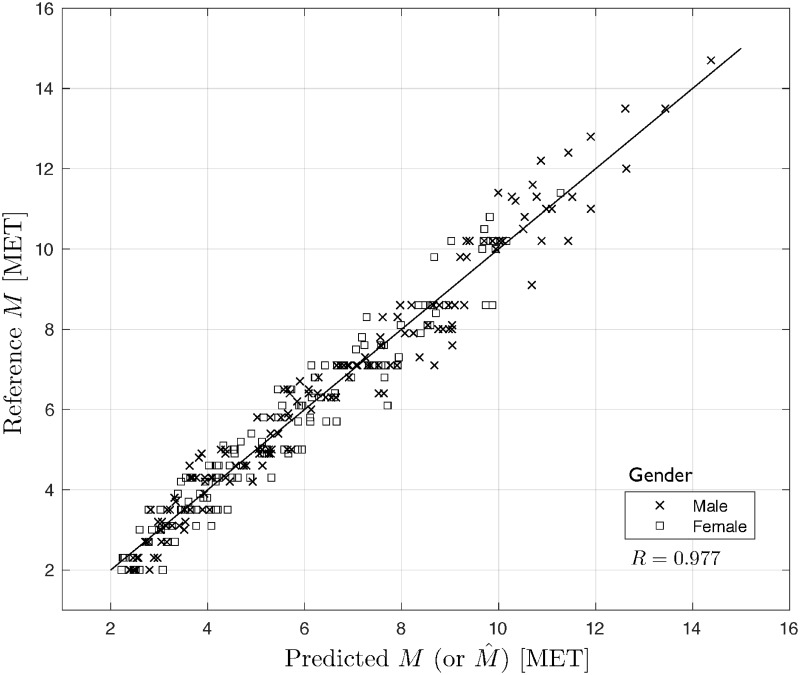
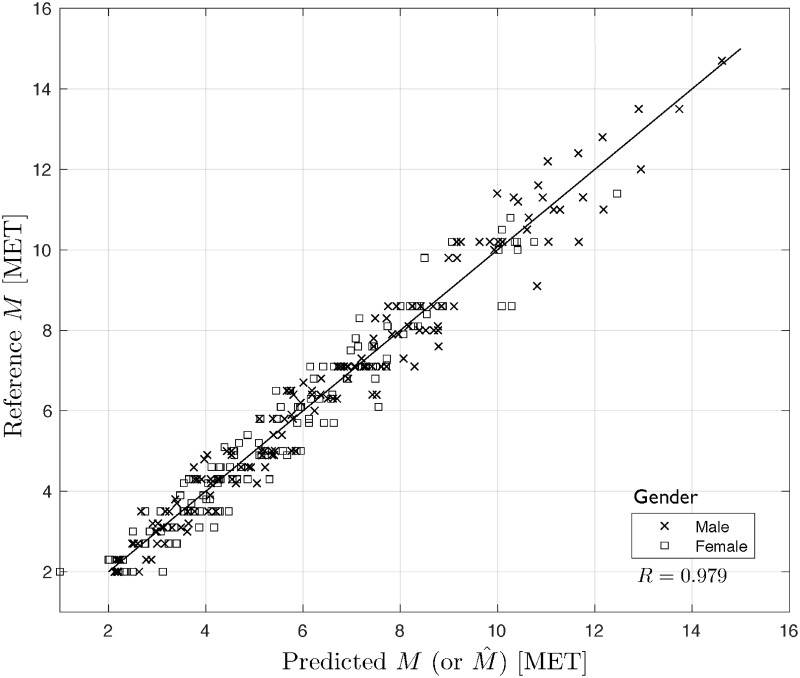
It is well known that an LS fit to data can be assessed with various model selection criteria, see e.g. https://en.wikipedia.org/wiki/Model_selection. In our case, we choose a popular model validation technology which is cross-validation (CV) [53, 54]], in particular Leave-One-Out (LOO) CV regarding its VO2max-related modeling applications [5, 55]. LOO CV uses (N − 1) input/output data points for training and the remaining single input/output data point for validation, that is a prediction is made for that point. This is repeated N times for all the training/validation sets. The RMSEcv error for LOO CV, over all those validation points, is computed and used to evaluate the model. We have developed a Matlab-scripted program to LOO cross-validate our two classes of models. The obtained results for the men, women and all patients populations, respectively, are presented in Table 2 and Figs 7 and 8.
Table 2. Results of LOO CV for polynomial and piecewise linear models.
| Model | Results |
|---|---|
| Men | |
| polynomial model | RMSEcv = 0.5779 |
| piecewise linear model | RMSEcv = 0.5429 |
| Women | |
| polynomial model | RMSEcv = 0.5401 |
| piecewise linear model | RMSEcv = 0.5993 |
| All patients | |
| polynomial model | RMSEcv = 0.5666 |
| piecewise linear model | RMSEcv = 0.5608 |
Fig 7. Reference vs. predicted values of M for polynomial model.
Fig 8. Reference vs. predicted values of M for piecewise linear model.
As seen from Table 2, the values of the performance measures are quite close to those RMSEs obtained above in this Section. Also, Figs 7 and 8 present a very nice prediction quality of the considered models, which translates to very good properties of the residuals (not illustrated here), compare [5, 53–55]. Additionally, the Pearson correlation coefficients R are very high for both cases. This confirms the validity of the presented polynomial expansion and piecewise linear models.
Discussion
Clearly, the linear model (6) or (7) is unacceptable, in general. The performances of the two nonlinear models considered are comparable for the study populations under tests. Even though the parameter estimation problem is highly nonlinear for the piecewise linear model (9), which necessitates the employment of rather complicated, genetic minimization algorithms, we still opt for using that model. The reason is our rehabilitation application of the model. In our specific case, COPD patients were subjected to both treadmill and 6MWT tests in order to formulate relationships between results of the two tests. Now, having constructed the models (9) we would be able to use a result of the simple 6MWT, instead of the treadmill exercise test, to assign the patient to one of four rehabilitation groups. Why four? No one precisely knows but the rehabilitation practices, both cardiac and pulmonary ones, have developed some routines subdividing the sick population into four rehabilitation groups or classes. That is why our model (9) comprises n = 4 linear segments. Why linear and not e.g. cubic splines? Just for simplicity. Note that we optimize the locations of change points Vis (in addition to parameter estimates) and this corresponds with ‘optimization’ of their MET switch points , i = 1, …, n, that can be used in the patients’ division into rehabilitation classes. And yet, final selections of M(i)s in the rehabilitation procedures may be not unique, they may change from country to country or even from hospital to hospital. For example, let us recall a (rather intuitive) division into cardiopulmonary rehabilitation groups typically encountered in the therapeutic society, also in Poland:
| (11) |
Note that the division does not account for gender, the factor apparently affecting the results of exercise tests as can also be seen from our experiments. Let us confront now the above division with the results obtained from the model (9) for our study population. In Figs 4 through 6 we show the optimal locations of the change points for each population case. For lucidity, the ‘optimal’ MET switch points are exemplary depicted only in Fig 5 as M(1) = 2.304, M(2) = 4.094 and M(3) = 7.782. Those are not quite in agreement with the group division presented above, which might suggest some corrections to the classification (11). We use to implement those corrections in our rehabilitation practice indeed, in particular 1) discriminating between two rehabilitation divisions like in (11) with respect to gender and 2) rectifying the boundaries of classes specified in the classification (11).
Fig 5. Data set M vs. v6M (or 10−2 D) and the model outputs for women patients’ population.
Treadmill exercise tests revisited
The crucial problem in treadmill exercise test procedures is estimation of a ‘reference’ nonlinear model relating a final result in walk time T [min] (or distance D [m] or velocity v [km/h]) to its VO2max score or, ‘almost’ equivalently to the (sub)maximal effort tolerance M in METs. Abstracting from our 6MWT rehabilitation-oriented application, this is nothing but our model (8) or (9). Now, the problem is that some models sometimes investigated in treadmill exercise test procedures may be far from reality. Let us recall some examples brought from [Wikipedia]. https://en.wikipedia.org/wiki/Bruce_protocol:
Apparently, the above linear models are unacceptable as the phenomenon is nonlinear, in general. Well, get the first model which is nonlinear. However, its offset term is 14.76, which is a disaster because for T = 0, which is the resting condition, we should have the oxygen uptake of some 3.5 [ml/kg/min] and this is the value the offset term should be approximately equal to. But for the two linear models we have the offset terms close to 3.5. This means that the two models were constructed for populations of 1) severe sick (women) patients mainly and 2) young men of low effort tolerance mainly. This is in contrast to the linear model with the offset term equal to −3.9, which suggests that the population of low sick or low medium (women) patients was mainly investigated.
Now, treadmill exercise test procedures are equipped with specific, typically nonlinear models but still they may not be population-related. The treadmill exercise test procedures need banks of nonlinear reference models designed for various patient populations and called e.g. from keyboard for each individual patient under test, depending on various conditions including gender, type/class of sickness, possibly age range and others. This might be involving and time-consuming in general and that is why we have sought for the simple 6MWT substitute herein.
Still, we believe the concept of developing the banks of nonlinear models for treadmill exercise test procedures could be attractive sooner or later. The intimation of such an idea is the second goal of this paper. To this end, we can make generally available (upon request) all our programming packages necessary for construction and simulation of models (8) and (9). The final goal would be to develop an expert system for estimation of (sub)maximal effort tolerance for a plethora of patient populations involved in various patient management tasks, not only the rehabilitation one.
Remark 2. Similar banks of nonlinear models for treadmill exercise test procedures could be developed for athlete management software, in particular for junior athletes in their preliminary selection process.
Remark 3. Even though many VO2max or MET-involving models are single input, with the input variable being either walk time or velocity or distance, the time has come to thoroughly introduce the second input variable into the treadmill exercise test model, that is the grade. Such a more complex and general model is out of scope of this study and it will be a subject of our future research.
6MWT revisited
Apart from the above-mentioned, general need for treadmill exercise test procedures to incorporate banks of ‘reference’ nonlinear models (rather than one ‘average’ model), right the same holds for the 6MWT score modeled by Eqs (8) or (9). Our results in METs vs. 6MWT distance/velocity presented hereinbefore could be a starting step for the development of such a bank for COPD patient populations within the mBruce procedure. Again, our software is open not only to the rehabilitation society.
Remark 4. Note that e.g. a 6MWT bank for COPD patient populations should strictly ‘cooperate’ with the corresponding COPD bank within the mBruce procedure. Unfortunately, this ‘compatibility rule’ is currently rather seldom observed during treadmill exercise tests, that is e.g. COPD patients are tested against some nonlinear reference model of VO2max vs. T, being likely a sort of an ‘average’ characteristic for cardiopulmonary patients.
Conclusions
Having backgrounded the energy expenditure process due to physical activity, we justified the nonlinear relationship between VO2max and power output during a submaximal exercise test. This has led to the proposal of two classes of nonlinear models, namely polynomial expansion and piecewise linear models. The models can be used to estimate submaximal effort tolerance in patients with COPD by means of the cost-saving 6MWT, without the use of cardiorespiratory analysis. The models’ LS fit to data was successfully assessed by means of the LOO cross-validation technique. The above constitutes an original modeling methodology for estimation of submaximal effort tolerance, which is the main achievement of the paper. Our new nonlinear estimation algorithms have been finally applied for piecewise linear models in rehabilitation of COPD patients, improving their assignment rules to four rehabilitation classes. The second achievement of the paper has been the proposal to use our nonlinear estimation methodology in treadmill exercise test procedures in order to construct a bank of (nonlinear) ‘reference’ models cooperating compatibly with various patient populations under various patient management environments. This challenging, expert system-oriented future research direction will be followed in our works. Another interesting future research topic could be an extension of our methodology to self-paced treadmill exercise tests, combined with 6MWT, compare [37]. Yet another challenging research topic is incorporation of the second input variable, that is treadmill grade, into our nonlinear single-input models relating energy expenditure in METs with either 6MWT or treadmill test scores.
Supporting information
(TXT)
(TXT)
Acknowledgments
Stimulating comments from anonymous Reviewers are gratefully acknowledged.
Data Availability
All relevant data are within the paper and its Supporting Information files.
Funding Statement
The authors received no specific funding for this work.
References
- 1. Hills AP, Mokhtar N, Byrne NM. Assessment of physical activity and energy expenditure: An overview of objective measures. Frontiers in Nutrition. 2014;1:5 10.3389/fnut.2014.00005 [DOI] [PMC free article] [PubMed] [Google Scholar]
- 2. Meira L, Damas C, Martins P, Gaspar L, Araújo E, Eusébio E, et al. Relationship between 6MWT distance and VO2max and Wmax in lung transplant candidates undergoing pulmonary rehabilitation. European Respiratory Journal. 2015;46(suppl 59). [Google Scholar]
- 3.Mackenzie B. VO2 max; 2015. Available from: www.brianmac.co.uk/vo2max.htm [cited 20/11/2017].
- 4. Chiaranda G, Myers J, Mazzoni G, Terranova F, Bernardi E, Grossi G, et al. Peak oxygen uptake prediction from a moderate, perceptually regulated, 1-km treadmill walk in male cardiac patients. J Cardiopulm Rehabil Prev. 2012;32(5):262–9. 10.1097/HCR.0b013e3182663507 [DOI] [PubMed] [Google Scholar]
- 5.Altini M, Van Hoof C, Amft O. Relation between estimated cardiorespiratory fitness and running performance in free-living: an analysis of HRV4Training data. IEEE EMBS Int. Conf. on Biomedical & Health Informatics (BHI), Orlando, FL, 16–19 Feb., 2017.
- 6. Fregonezi G, Resqueti V, Vigil L, Calaf N, Casan P. Maximal oxygen uptake cannot be estimated from resting lung function and submaximal exercise in patients with chronic obstructive pulmonary disease. J Cardiopulm Rehabil Prev. 2012;32(4):219–25. 10.1097/HCR.0b013e318259b6a5 [DOI] [PubMed] [Google Scholar]
- 7. Astrand PO, Rodehl K. In: Textbook of Work Physiology. New York: MacGraw-Hill; 1977. p. 354–8. [Google Scholar]
- 8. Fregonezi G, Resqueti V, Vigil L, Calaf N, Casan P. Blood lactate measurements and analysis during exercise: A guide for clinicians. J Diabetes Sci Technol. 2007;1(4):558–569. 10.1177/193229680700100414 [DOI] [PMC free article] [PubMed] [Google Scholar]
- 9. Moran P, Prichard JG, Ansley L, Howatson G. The influence of blood lactate sample site on exercise prescription. J Strength Cond Res. 2012;26(2):563–7. 10.1519/JSC.0b013e318225f395 [DOI] [PubMed] [Google Scholar]
- 10.Lactate Testing and the Lactate and Anaerobic Thresholds; 2015. Available from: www.lactate.com/threshold.html [cited 16/2/2017].
- 11. Zoladz JA and Szkutnik Z, Majerczak J, Duda K, Pedersen PK. Non-linear relationship between oxygen uptake and power output in the Astrand nomogram-old data revisited. J Physiol Pharmacol. 2007;58(2):265–73. [PubMed] [Google Scholar]
- 12. Ainsworth BE, Haskell WL, Herrmann SD, Meckes N, Bassett DRJ, Tudor-Locke C, et al. 2011 Compendium of physical activities: A second update of codes and MET values. Medicine & Science in Sports & Exercise. 2011;43(8). [DOI] [PubMed] [Google Scholar]
- 13. Kozey S, Lyden K, Staudenmayer J, Freedson P. Errors in MET estimates of physical activities using 3.5 ml x kg(-1) x min(-1) as the baseline oxygen consumption. J Phys Act Health. 2010;7(4):508–16. 10.1123/jpah.7.4.508 [DOI] [PubMed] [Google Scholar]
- 14. Venkatesh N, Thanikachalam S, Satyanarayana MJ, Maiya A, Senthil KT, Sridevi S. Six minute walk test: a literary review. Sri Ramachandra J Med. 2011;4(1):30–4. [Google Scholar]
- 15. Mathioudakis AG, Evangelopoulou EI, Karapiperis GC, Perros EI, Simou G, Kiritsi E, et al. Complementary role of 6-minutes walking test (6MWT) in the assessment of functional status of patients with chronic obstructive pulmonary disease (COPD). Journal of Thoracic Disease. 2015;7((Suppl 1)). [Google Scholar]
- 16. Ghofraniha L, Dalir Sani Z, Vakilian F, Khajedalooyi M, Arabshahi ZJ. The six-minute walk test (6MWT) for the evaluation of pulmonary diseases. Journal of Cardio-Thoracic Medicine. 2015;3(2):284–287. [Google Scholar]
- 17. Pollentier B, Irons SL, Benedetto CM, DiBenedetto AM, Loton D, Seyler RD, et al. Examination of the six minute walk test to determine functional capacity in people with chronic heart failure: A systematic review. Cardiopulmonary Physical Therapy Journal. 2010;21(1):13–21. [PMC free article] [PubMed] [Google Scholar]
- 18. Solway S, Brooks D, Lacasse Y, Thomas S. A qualitative systematic overview of the measurement properties of functional walk tests used in the cardiorespiratory domain. Chest. 2001;119(1):256–70. [DOI] [PubMed] [Google Scholar]
- 19. Ingle L, Shelton RJ, Rigby AS, Nabb S, Clark AL, Cleland JGF. The reproducibility and sensitivity of the 6-min walk test in elderly patients with chronic heart failure. European Heart Journal. 2005;26(17):1742 10.1093/eurheartj/ehi259 [DOI] [PubMed] [Google Scholar]
- 20. Kern L, Condrau S, Baty F, Wiegand J, van Gestel AJ, Azzola A, et al. Oxygen kinetics during 6-minute walk tests in patients with cardiovascular and pulmonary disease. BMC Pulmonary Medicine. 2014;14(1):167 10.1186/1471-2466-14-167 [DOI] [PMC free article] [PubMed] [Google Scholar]
- 21. Zainuldin R, Mackey MG, Alison JA. Prescription of walking exercise intensity from the 6-minute walk test in people with chronic obstructive pulmonary disease. Journal of Cardiopulmonary Rehabilitation and Prevention. 2015;35(1). 10.1097/HCR.0000000000000074 [DOI] [PubMed] [Google Scholar]
- 22. Mandic S, Walker R, Stevens E, Nye ER, Body D, Barclay L, et al. Estimating exercise capacity from walking tests in elderly individuals with stable coronary artery disease. Disability and Rehabilitation. 2013;35(22):1853–1858. 10.3109/09638288.2012.759629 [DOI] [PubMed] [Google Scholar]
- 23. ATS Statement: Guidelines for the Six-Minute Walk Test. American Journal of Respiratory and Critical Care Medicine. 2002;166(1):111–117. 10.1164/ajrccm.166.1.at1102 [DOI] [PubMed] [Google Scholar]
- 24. Zugck C, Krüger C, Dürr S, Gerber SH, Haunstetter A, Hornig K, et al. Is the 6-minute walk test a reliable substitute for peak oxygen uptake in patients with dilated cardiomyopathy? European Heart Journal. 2000;21(7):540 10.1053/euhj.1999.1861 [DOI] [PubMed] [Google Scholar]
- 25. Tanaka H, Monahan KD, Seals DR. Age-predicted maximal heart rate revisited. J Am Coll Cardiol. 2001;37(1):153–156. 10.1016/S0735-1097(00)01054-8 [DOI] [PubMed] [Google Scholar]
- 26. Bellet RN, Adams L, Morris NR. The 6-minute walk test in outpatient cardiac rehabilitation: validity, reliability and responsiveness—a systematic review. Physiotherapy. 2012;98(4):277–286. [DOI] [PubMed] [Google Scholar]
- 27. Maria da Silva R, Brunow de Carvalho W, Johnston C, Borba de Castro M, Manta Ferreira I, Patti CL, et al. Functional capacity after pediatric liver transplantation: a pilot study. Pediatr Transplant. 2014;18(6):586–593. 10.1111/petr.12318 [DOI] [PubMed] [Google Scholar]
- 28. Adonis A, Taylor GP. Assessing walking ability in people with HTLV-1-associated myelopathy using the 10 meter timed walk and the 6 minute walk test. PLoS One. 2016;11(6):e0157132 10.1371/journal.pone.0157132 [DOI] [PMC free article] [PubMed] [Google Scholar]
- 29. Nilsagard Y, Westerdahl E, Wittrin A, Gunnarsson M. Walking distance as a predictor of falls in people with multiple sclerosis. Physiother Res Int. 2016;21(2):102–108. 10.1002/pri.1625 [DOI] [PMC free article] [PubMed] [Google Scholar]
- 30. Marjanski T, Badocha M, Wnuk D, Mosiewicz A, Rzyman W. Result of the 6-minue walk test is an independent prognostic factor of surgically treated non-small cell lung cancer. Annals of Oncology. 2015;26(suppl 1):i22 10.1093/annonc/mdv048.17 [DOI] [PubMed] [Google Scholar]
- 31. Stellmann JP, Neuhaus A, Gotze N, Briken S, Lederer C, Schimpl M, et al. Ecological validity of walking capacity tests in multiple sclerosis. PLoS One. 2015;10(4):e0123822 10.1371/journal.pone.0123822 [DOI] [PMC free article] [PubMed] [Google Scholar]
- 32. Andersen LK, Knak KL, Witting N, Vissing J. Two- and 6-minute walk tests assess walking capability equally in neuromuscular diseases. Neurology. 2016;86(5):442–445. [DOI] [PubMed] [Google Scholar]
- 33. Serra AJ, de Carvalho PdTC, Lanza F, de Amorim Flandes C, Silva SC, Suzuki FS, et al. Correlation of six-minute walking performance with quality of life is domain- and gender-specific in healthy older adults. PLoS One. 2015;10(2):e0117359 10.1371/journal.pone.0117359 [DOI] [PMC free article] [PubMed] [Google Scholar]
- 34. Arbillaga-Etxarri A, Torrent-Pallicer J, Gimeno-Santos E, Barberan-Garcia A, Delgado A, Balcells E, et al. Validation of walking trails for the urban training of chronic obstructive pulmonary disease patients. PLoS One. 2016;11(1):e0146705 10.1371/journal.pone.0146705 [DOI] [PMC free article] [PubMed] [Google Scholar]
- 35. Mador MJ, Modi K. Comparing various exercise tests for assessing the response to pulmonary rehabilitation in patients with COPD. J Cardiopulm Rehabil Prev. 2016;36(2):132–139. 10.1097/HCR.0000000000000154 [DOI] [PubMed] [Google Scholar]
- 36. Bell M, Fotheringham I, Punekar YS, Riley JH, Cockle S, Singh SJ. Systematic review of the association between laboratory- and field-based exercise tests and lung function in patients with chronic obstructive pulmonary disease. Chronic Obstr Pulm Dis. 2015;2(4):321–342. 10.15326/jcopdf.2.4.2014.0157 [DOI] [PMC free article] [PubMed] [Google Scholar]
- 37. Liu WY, Meijer K, Delbressine JM, Willems PJ, Franssen FME, Wouters EFM, et al. Reproducibility and validity of the 6-minute walk test using the Gait Real-time Analysis Interactive Lab in patients with COPD and healthy elderly. PLoS One. 2016;11(9):e0162444 10.1371/journal.pone.0162444 [DOI] [PMC free article] [PubMed] [Google Scholar]
- 38. Heresi GA, Dweik RA. Strengths and limitations of the six-minute-walk test: a model biomarker study in idiopathic pulmonary fibrosis. Am J Respir Crit Care Med. 2011;183(9):1122–1124. 10.1164/rccm.201012-2079ED [DOI] [PubMed] [Google Scholar]
- 39. Someya F, Mugii N. Limitations to the 6-minute walk test in dermatomyositis with interstitial lung disease in comparison with idiopathic interstitial pneumonia. Clin Med Insights Circ Respir Pulm Med. 2013;7:1–6. 10.4137/CCRPM.S10764 [DOI] [PMC free article] [PubMed] [Google Scholar]
- 40. Holland AE, Dowman L, Fiore JJ, Brazzale D, Hill CJ, McDonald CF. Cardiorespiratory responses to 6-minute walk test in interstitial lung disease: not always a submaximal test. BMC Pulm Med. 2014;14:136 10.1186/1471-2466-14-136 [DOI] [PMC free article] [PubMed] [Google Scholar]
- 41. Connors G, Hilling L. American Association of Cardiovascular and Pulmonary Rehabilitation Guidelines for Pulmonary Rehabilitation Programs. Champaign, Illinois: Human Kinetics; 1993. [Google Scholar]
- 42. Wilms B, Ernst B, Thurnheer M, Weisser B, Schultes B. Correction factors for the calculation of metabolic equivalents (MET) in overweight to extremely obese subjects. Int J Obes (Lond). 2014;38(11):1383–1387. 10.1038/ijo.2014.22 [DOI] [PubMed] [Google Scholar]
- 43. Gomberg-Maitland M, Huo D, Benza RL, McLaughlin VV, Tapson VF, Barst RJ. Creation of a model comparing 6-minute walk test to metabolic equivalent in evaluating treatment effects in pulmonary arterial hypertension. J Heart Lung Transplant. 2007;26(7):732–738. [DOI] [PubMed] [Google Scholar]
- 44. Beatty AL, Schiller NB, Whooley MA. Six-minute walk test as a prognostic tool in stable coronary heart disease: data from the heart and soul study. Arch Intern Med. 2012;172(14):1096–1102. 10.1001/archinternmed.2012.2198 [DOI] [PMC free article] [PubMed] [Google Scholar]
- 45. Buckley JP, Cardoso FMF, Birkett ST, Sandercock GRH. Oxygen Costs of the Incremental Shuttle Walk Test in Cardiac Rehabilitation Participants: An Historical and Contemporary Analysis. Sports Med. 2016;46(12):1953–1962. 10.1007/s40279-016-0521-1 [DOI] [PubMed] [Google Scholar]
- 46. Stanisławski R, Rydel M, Latawiec KJ. Modeling of discrete-time fractional-order state space systems using the balanced truncation method. Journal of the Franklin Institute. 2017;354(7):3008–3020. 10.1016/j.jfranklin.2017.02.003 [DOI] [Google Scholar]
- 47. Stanisławski R. New results in stability analysis for LTI SISO systems modeled by GL-discretized fractional-order transfer functions. Fractional Calculus and Applied Analysis. 2017;20(1):243–259. [Google Scholar]
- 48. Stanisławski R, Latawiec KJ. Fractional-order discrete-time Laguerre filters—a new tool for modeling and stability analysis of fractional-order LTI SISO systems. Discrete Dynamics in Nature and Society. 2016;2016:1–9. [Google Scholar]
- 49. Rydel M, Stanisławski R. A new frequency weighted Fourier-based method for model order reduction. Automatica. 2018;88:107–112. 10.1016/j.automatica.2017.11.016. [DOI] [Google Scholar]
- 50. Stanisławski R, Latawiec KJ, Łukaniszyn M. A comparative analysis of Laguerre-based approximators to the Grünwald-Letnikov fractional-order difference. Mathematical Problems in Engineering. 2015;2015:1–10. [Google Scholar]
- 51. Khodadadi A, Asgharian M. Change-point problem and regression: an annotated bibliography. Collection of Biostatistics Res Arch COBRA Preprint Series. 2008; p. 44. [Google Scholar]
- 52. Toriello A, Vielma JP. Fitting piecewise linear continuous functions. European Journal of Operational Research. 2012;219(1):86–95. 10.1016/j.ejor.2011.12.030. [DOI] [Google Scholar]
- 53. Arlot S, Celisse A. A survey of cross-validation procedures for model selection. Statistics Surveys. 2010;4:40–79. 10.1214/09-SS054. [DOI] [Google Scholar]
- 54. Zhang Y, Yang Y. Cross-validation for selecting a model selection procedure. Journal of Econometrics. 2015;187(1):95–112. 10.1016/j.jeconom.2015.02.006. [DOI] [Google Scholar]
- 55. Altini M, Casale P, Penders J, Amft O. Cardiorespiratory fitness estimation in free-living using wearable sensors. Artif Intell in Med. 2016;68:37–46. 10.1016/j.artmed.2016.02.002. [DOI] [PubMed] [Google Scholar]
Associated Data
This section collects any data citations, data availability statements, or supplementary materials included in this article.
Supplementary Materials
(TXT)
(TXT)
Data Availability Statement
All relevant data are within the paper and its Supporting Information files.


