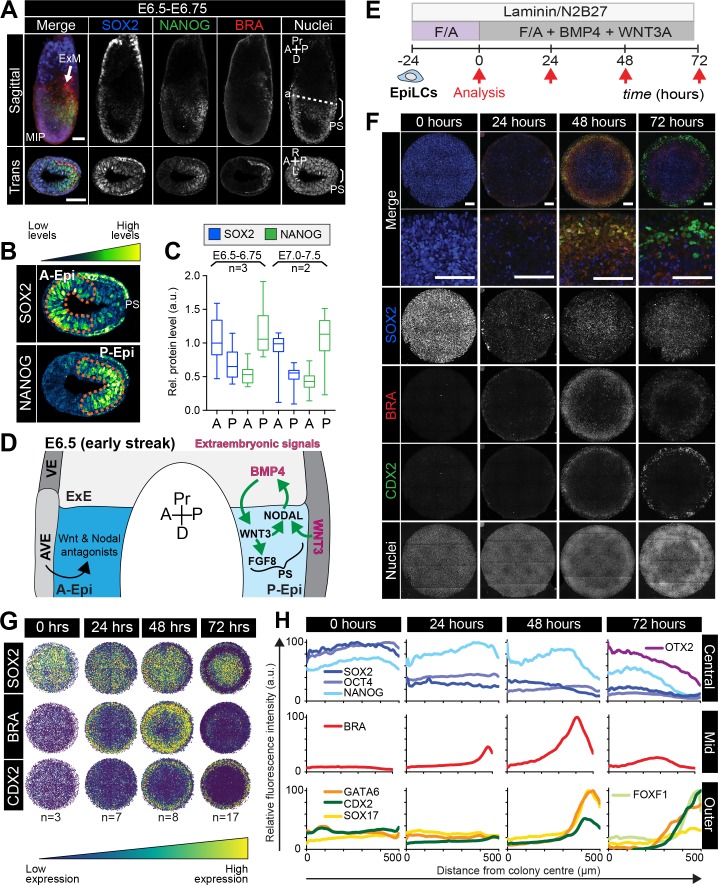
Figure 2. Micropatterned EpiLCs undergo spatially organized differentiation.
(A) Maximum intensity projection (MIP), sagittal and transverse sections of an embryonic day (E) 6.5 mouse embryo. Dashed line marks transverse plane. Non-nuclear anti-BRACHYURY/CDX2/SOX2 VE fluorescence likely represents non-specific binding. ExM, extraembryonic mesoderm; PS, primitive streak; A, anterior; P, posterior; Pr, proximal; D, distal. Scale bars, 50 μm. (B) Lookup table (LUT) of SOX2 marking anterior Epi (A-Epi) and NANOG marking posterior Epi (P-Epi). Orange dashed lines delineate regions of interest. (C) Quantification (5 sections/embryo/ stage) of SOX2 and NANOG in manually selected (panel B) anterior (A) and posterior (P) Epi of E6.5-E6.75 and E7.0-E7.5 embryos, normalized to Hoechst fluorescence. Data depicts mean fluorescence intensity ± S.D. N, number of embryos. No NANOG was observed in the A-Epi hence ~0.5 a.u. equates to background signal. (D) BMP, Wnt, Nodal, FGF signaling initiates gastrulation at the P-Epi - extraembryonic ectoderm (ExE) boundary. BMP4 produced by ExE stimulates Wnt3 expression within proximal Epi. WNT3 produced by Epi and visceral endoderm (VE) triggers Nodal and Fgf8 expression. NODAL promotes Bmp4 expression in the ExE. The anterior VE (AVE) expresses Wnt and Nodal pathway antagonists, restricting signaling activity to P-Epi. (E) EpiLCs were plated onto Laminin-coated micropatterns overnight (−24 hr) in N2B27 with F/A. The following day medium was changed to F/A, BMP4, WNT3A for 72 hr. Colonies were analyzed at 24 hr intervals. (F) MIPs of immunostained 1000 μm diameter colonies. All subsequent data represents 1000 μm diameter colonies. Upper two panels represent a merge of the markers shown below. Second panel shows high magnification of colony edge. Scale bars, 100 μm. BRA, BRACHYURY. (G) Depiction of average positional marker expression across multiple colonies. Each dot represents a single cell. (H) Quantification of voxel fluorescence intensity from colony center (0) to edge (500). Data represents average voxel intensity relative to maximum voxel intensity across time course/marker. For 0,24,48,72 hr respectively, POU5F1/NANOG n = 5,3,3,3, SOX2 n = 15,7,21,20, BRACHYURY n = 11,9,10,12, GATA6/SOX17/CDX2 n = 3,5,6,5. Markers grouped by spatial distribution within colonies. OTX2 and FOXF1 only analyzed at 72 hr.


