

Abstract
Objectives
Deficits in social cognition predict poor functional outcome in severe mental illnesses such as schizophrenia and autism. However, research findings on social cognition in bipolar disorder (BD) are sparse and inconsistent. This study aimed to characterize a critical social cognitive process - eye gaze perception - and examine its functional correlates in BD to inform psychopathological mechanisms.
Methods
Thirty participants with BD, 37 healthy controls (HC), and 46 psychiatric controls with schizophrenia (SZ) completed an eye-contact perception task. They viewed faces with varying gaze directions, head orientations, and emotion, and made eye-contact judgments. Psychophysics methods were used to estimate perception thresholds and slope of the perception curve, which were then compared between the groups and correlated with clinical and functional measures using Bayesian inference.
Results
Compared with HC, BD over-perceived eye contact when gaze direction was ambiguous, and this self-referential bias was similar to that in SZ. BD had lower thresholds (i.e., needed weaker eye-contact signal to start perceiving gaze as self-directed) but similar slope compared with HC. Regression analyses showed that steeper slope predicted better socio-emotional functioning in HC and SZ, but not in BD.
Conclusions
The psychopathology of social dysfunction between BD and SZ is fundamentally different in this modest sample. Eye gaze perception in BD is characterized by a self-referential bias but preserved perceptual sensitivity, the latter of which distinguishes BD from SZ. The relationship between gaze perception and broader socio-emotional functioning in SZ and HC was absent in BD.
Keywords: Psychosis, affective disorder, social cognition, emotional intelligence, face processing, schizophrenia
Introduction
Individuals with bipolar disorder (BD) often suffer from lasting functional impairments, even during remission of active mood symptoms (1–3). These impairments not only lead to reduced work productivity and unemployment (4), but also impact their social relationships and quality of life negatively (2,5). A main predictor of low functioning in BD was subsyndromal depressive symptoms (i.e. symptoms not meeting the full diagnostic criteria for a mood episode) (2), but it only accounts for a small amount of variance (6,7)—even smaller (7%) after accounting for the effect of neurocognitive functioning (8). Neurocognition is a more promising predictor, though the variance explained is typically in the range of 7% – 21% (8,9). Research with individuals diagnosed with schizophrenia (SZ) have shown that social cognition mediates the relationship between neurocognition and functional outcome (10,11), suggesting that social cognition has a more direct relationship to functioning. There is preliminary evidence showing a significant link between the two in BD (12–14). Given its potential as a better predictor of psychosocial outcome than neurocognition, a better understanding of social cognition in BD could inform the illness mechanism and refine current treatment.
Despite its clinical relevance, social cognition in BD remains under-investigated, and findings are mixed. There is some evidence that individuals with BD are impaired in emotion processing (i.e. the ability to recognize, appraise, and utilize emotion) and theory of mind (i.e., the ability to infer other people’s mental states, such as beliefs, intentions, and emotions, based on available social cues and contexts) (15,16). However, not all studies have found social cognition impairment in BD, even in the presence of impaired neurocognition (17). Clinical factors are one potential source of variability across studies. For example, social cognitive deficits were more severe in BD with a history of psychotic symptoms than those without (18). They were most severe during manic episodes (16,19), but can persist during remission of active mood symptoms (16). Another source of variability is the tasks used to assess social cognition. Some data suggest that social cognitive impairment in BD may be present only in some specific domains (e.g., self-referential information processing; 20). Despite evidence for significant genetic and phenotypic overlap between SZ and BD, the degree to which social cognitive abilities differ across the two disorders has not been extensively investigated. Although one study has found that the level of impairment (e.g., in theory-of-mind tasks) in BD is as severe as in SZ patients (21), the majority have found it intermediate between healthy controls (HC) and SZ (13,15,22).
To determine if and how social cognition is compromised in BD, it is necessary to examine well-defined social cognitive domains. One core building block of social cognition is eye gaze perception (23). Humans develop the ability to infer attention and intention of others from their gaze direction during infancy and this ability is critical to successful social development and functioning (24). Abnormal gaze perception may lead to wrong judgments about the focus of people’s attention, thus assigning meaning to irrelevant stimuli. For example, misperceiving someone else as looking at you may lead to grandiose ideas (if the intention is perceived as positive) or paranoid delusions (if intention perceived as negative). Studies have shown that self-referential gaze perception is impaired in SZ (25–27). Specifically, when gaze perception was assessed using a continuum of gaze directions and analyzed using a psychophysical method, SZ patients over-perceived eye contact when gaze was ambiguous and began to endorse eye contact with a weaker eye-contact signal (i.e., when gaze direction was more averted) compared with HC (27). Their perception curve plotting eye-contact perception as a function of gaze direction was also shallower, suggesting more uncertainty or reduced sensitivity in making self-referential vs. non-self-referential judgments of eye gaze. This impairment was correlated with more severe clinical symptoms and explained a significant amount of variance in socio-emotional functioning even after controlling for basic neurocognition. The same linear relationship between gaze perception and socio-emotional functioning was also observed in HC, suggesting that gaze perception may be a determinant of social functioning regardless of disease status.
This study addresses a gap in the field of social cognition research in BD, namely, gaze perception. Demonstrating a relationship between gaze perception and broader social functioning, as observed in SZ and HC, would inform the mechanisms and treatment of functional impairment of BD. This would also provide support that gaze perception is an important dimension of social functioning that cuts across disease boundaries, thus enhancing our understanding of psychopathologies. Further, given preliminary findings that BD with psychotic features had more severe social cognitive deficits than those without (18), investigating how a history of psychosis is associated with a specific social cognitive deficit in BD, eye gaze perception in this case, would also inform disease mechanisms.
The primary aim of this study was to characterize self-referential eye gaze perception in BD and examine its implications for psychosocial functioning. In addition, to investigate whether putative gaze perception differed quantitatively or qualitatively from SZ, we examined its relationship to socio-emotional functioning in BD in comparison with HC and SZ patients. We used a psychophysical approach to examine judgments of eye contact as a function of eye-contact signal strength (i.e. gaze direction) as described in our previous study (27). Briefly, we used a relatively large number of trials of face stimuli covering the full range of gaze directions (from averted to direct in gradual increments). This method allowed us to examine two critical characteristics of eye-contact perception: thresholds (how strong the eye-contact signal one needs to perceive gaze as self-directed) and slope (how categorical or sensitive one’s eye-contact perception is). We also manipulated head orientation (forward, averted) and facial emotion (neutral, fearful) of the face stimuli because these two factors have been shown to interact with gaze direction during gaze perception (28,29). Studying how these two factors modulate eye-contact perception in BD can provide a richer understanding of how contextual and affective information influences self-referential gaze processing in the disorder.
We hypothesized that 1) BD would show abnormal eye-contact perception (i.e., overperception when gaze is ambiguous, and reduced perception thresholds and slope) compared with HC; 2) the patterns of abnormalities in eye gaze perception in BD would be similar to those observed in SZ but to a lesser degree; 3) the abnormalities in eye gaze perception would be worse in BD with a history of psychosis compared with those without; and 4) BD would exhibit a similar relationship between gaze perception and socio-emotional functioning as in SZ and HC.
Methods
Participants
The sample consisted of 113 participants: 30 diagnosed with BD (16 with a history of psychosis and 14 without), 37 HC, and 46 diagnosed with schizophrenia or schizoaffective disorder (SZ). Data of 23 HC and 26 SZ were reported in a previous study (27). DSM-IV diagnoses were established using the Structured Clinical Interview for the DSM-IV (SCID-IV) (30) or the Diagnostic Interview for Genetic Studies (DIGS Version 4.0) (31). Participants were recruited through advertisements and referrals by clinicians and researchers in an academic medical center. BD and SZ were excluded if they had a history of alcohol/substance use disorder in the past 6 months. HC were excluded if they had any past or current Axis-I disorders, alcohol/substance use disorder in the past 5 years, or a first-degree relative with a psychotic or bipolar disorder. All participants were able to give informed consent and had at least 20/30 visions according to a Snellen chart. Written informed consent was obtained from every participant after a complete description of the study. The study was approved by the University of Michigan Medical School Institutional Review Board.
Assessments
The revised version of the Beck Depression Inventory (BDI-IA; 32) and the Young Mania Rating Scale (YMRS; 33) were used to assess participants’ mood state. The scale for Assessment of Positive Symptoms (SAPS; 34) and the Scale for Assessment of Negative Symptoms (SANS; 35) were used to assess the positive and negative symptoms of patients. To allow a direct comparison with previous findings in SZ, the Brief Assessment of Cognition of Schizophrenia (BACS; 36) and the Mayer-Salovey-Caruso Emotional Intelligence Test (MSCEIT; 37) were used to assess participants’ neurocognition and socio-emotional functioning, respectively. The BACS is a performance-based test battery that assesses verbal memory, working memory, motor speed, attention, executive functions, and verbal fluency. MSCEIT is a performance-based battery that measures individuals’ ability to perceive, facilitate, understand, and manage emotions.
Eye-contact Perception Task
Participants viewed black-and-white photos of faces varying in head orientation (forward, 30° averted to left or right), emotion (neutral, fearful), and eye-contact signal strength (0, 0.1, 0.2, …, 1.0). Gaze direction varied from averted (0 eye-contact signal strength) to direct (1.0 eye-contact signal strength) in ten 10% increments (see Figure 1 for example stimuli). The task contains 528 trials in total: 2 head orientations × 2 emotions × 11 eye-contact signal strengths × 6 actors × 2 directions (left, right). For each face, participants were instructed to indicate, according to their first impression, whether they felt the person was looking at them (yes/no) by pressing one of two buttons. The task was self-paced and participants were allowed to pause and take a brief break whenever they needed (see 27 for more task details). The task typically lasted 10–12 minutes.
Figure 1.
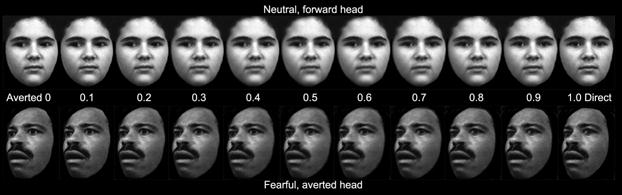
Sample face stimuli from the eye-contact perception task. From left to right, eye-contact signal strength increases in 10% increments from 0 (averted) to 1.0 (direct).
Data Processing
The major analyses were conducted on the parameters that define each participant’s psychometric curve plotting eye-contact perception as a function of gaze direction. To this end, a two-parameter logistic function was fitted to each participant’s eye-contact endorsement rate (percentage of “yes, looking at me” responses) plotted against eye-contact signal strength:
where c and b are constant parameters provided by the IBM SPSS Statistics 22 Curve Estimation (logistic) function (see Figure 2 for an example). Because responses to averted faces did not approach a logistic function, only responses to forward faces were used in this analysis. Two psychophysical properties of eye-contact perception were derived from the fitted curve: thresholds (i.e., the expected signal strength given a certain eye-contact endorsement rate) and slope. Our previous study (27) suggests that thresholds estimated using lower response cutoffs could best distinguish SZ from HC. In this study, we used the same method and obtained nine perception thresholds using response cut-offs of 10%, 20%, …, 90% eye-contact endorsement rate. The slope of the function when f(x) = 50% was used as a measure of participants’ sensitivity to eye-contact signal strength, given that it measures how rapidly one’s perception changes from non-self-referential to self-referential (see 27 for more details on the mathematical derivation of the slope); higher values indicate that perception is more clear-cut categorical (i.e., with higher perceptual sensitivity).
Figure 2.
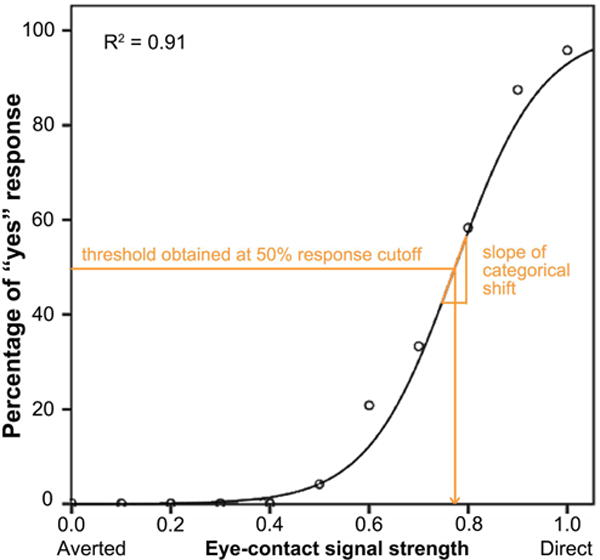
An example of a participant’s psychometric curve plotting eye-contact endorsement rate as a function of eye-contact signal strength. Nine perception thresholds were obtained using response cut-offs from 10% to 90% eye-contact endorsement rate. The slope of the function when endorsement rate = 50% was used as a measure of participants’ sensitivity to eye-contact signal strength, i.e. the rate of change of the categorical shift from non-self-referential to self-referential.
In order to include the data on averted faces, we performed an additional analysis in which we calculated each subject’s mean eye-contact endorsement rate for the 11 gaze angles.
Statistical Analyses
Group and model comparisons were conducted using Bayes factors (BFs) throughout this paper. BF is the ratio of the Bayesian evidence of the numerator model (e.g., alternative hypothesis) to that of the denominator model (e.g., null hypothesis); it provides information regarding the relative strength of evidence of two competing models, instead of merely accepting/rejecting null hypotheses as in traditional frequentist statistics. Model complexity is penalized in the computation of model evidence, allowing a more parsimonious model to win if it fits the data better. BF < 1 indicates evidence favoring the denominator model, while BF >1 indicates evidence favoring the numerator model. Interpretations of strength of evidence followed accepted guidelines (38), where BF between 1–3 provides “anecdotal” evidence for the numerator model, 3–10 “substantial” evidence, 10–30 “strong” evidence, 30–100 “very strong” evidence, and >100 “decisive” evidence. Similarly, BF between 0.33 and 1 provides “anecdotal” evidence for the denominator model (often the null hypothesis), 0.10 and 0.33 “substantial” evidence, 0.033 and 0.10 “strong” evidence, 0.01 and 0.033 “very strong” evidence, and <0.01 “decisive” evidence. All BFs were computed using the R package ‘BayesFactor’ (39).
For threshold, the anovaBF command was used to compare ANOVA models consisting of all possible permutations consisting of Group, Emotion, Response Cutoff, and their interaction terms as fixed effects. The model with the highest BF (compared against a denominator model consisting of only subject as a random factor) was chosen as the winning model and reported in the Results. This was then followed up by pairwise group comparisons of threshold at each response cutoff using the ttestBF command.
For eye-contact endorsement rate, the anovaBF command was used to select the winning model among ANOVA models consisting of all possible permutations of Group, Head Orientation, Emotion, and their interaction terms as fixed effects.
For slope of the perception curve, the anovaBF command was used to select the winning model among ANOVA models consisting of all possible permutations of Group, Emotion, and their interaction term as fixed effects. Follow-up pairwise group comparisons were conducted using the ttestBF command.
Finally, the relationships between eye-contact perception measures and clinical/functional measures in the three groups were examined using Pearson’s correlations and multiple regressions. In the regression analyses, we used the slope of the gaze perception curve as a predictor, because it was the gaze perception measure that significantly explained socio-emotional functioning in SZ and HC in our previous study (27). This variable, in addition to group membership, was included as a predictor of MSCEIT. Specifically, the lmBF command was used to identify a winning model among regression models consisting of all possible permutations of group membership (coded as two dummy variables, SZ and BD, to denote the 3 groups), slope of gaze perception curve, and their interaction terms as predictors of MSCEIT. Since HC was coded as the reference group, including the interaction terms (e.g., BD × Gaze Slope) allowed testing whether the relationship between gaze slope and MSCEIT in one diagnostic group (e.g., BD) was different from HC.
Results
Participant Characteristics
The BD, SZ, and HC groups were well matched for age and parental education. The BD group had a significantly lower male-to-female ratio than the other two groups. BD’s socio-emotional functioning as measured by MSCEIT was not different from HC, but SZ had lower MSCEIT score than HC. See Table 1 for detailed participant characteristics.
Table 1.
Participant Characteristics
| Variable | BD (N=30)
|
HC (N=37)
|
SZ (N=46)
|
Group Comparisons
|
||||
|---|---|---|---|---|---|---|---|---|
| Range | Mean (SD) | Range | Mean (SD) | Range | Mean (SD) | F/t/χ2 | p-value | |
| Age | 22–60 | 40.6 (12) | 19–59 | 37.5 (13.9) | 18–65 | 41.1 (14.4) | 0.79 | 0.457 |
| Sex (male/female) | – | 9/21 | – | 23/14 | – | 31/15 | 11.21 | 0.004 |
| Education | 12–21 | 15.5 (2.6) | 12–21 | 16.2 (2.3) | 10–18 | 13.9 (2.1) | 10.94 | <0.001 |
| Parental education | 6–20 | 15.2 (3.4) | 9–20 | 15.5 (2.6) | 4–26 | 15.3 (3.8) | 0.08 | 0.923 |
| BACS | −2.72–0.96 | −0.44 (0.73) | −2.65–1.85 | 0.39 (1.02) | −2.84–2.07 | −1.17 (1.08) | 17.28 | <0.001 |
| Duration of illness (years) | 1–51 | 24.4 (14.1) | – | – | 1–41 | 21.5 (13.4) | −.90 | 0.372 |
| CPZeq (mg daily)a | 4–800 | 212.7 (212) | – | – | 13–2000 | 424.4 (497.2) | 2.07 | 0.044 |
| Lithium | – | 40.0% | – | – | – | 6.5% | 12.85 | <0.001 |
| Mood stabilizer | – | 73.3% | – | – | – | 15.2% | 25.99 | <0.001 |
| Antipsychotic | – | 40.0% | – | – | – | 80.4% | 12.96 | <0.001 |
| Antidepressant | – | 63.3% | – | – | – | 34.8% | 5.96 | 0.015 |
| Anxiolytic | – | 26.7% | – | – | – | 17.4% | 0.94 | 0.332 |
| BDI-IAb | 0–30 | 9.1 (9.3) | 0–6 | 1.5 (1.8) | 0–36 | 10.5 (7.3) | 15.21 | <0.001 |
| YMRSb | 0–15 | 2.2 (3.4) | – | – | 0–4 | 1.3 (1.5) | −0.83 | 0.415 |
| SAPSb | 0–5 | 0.7 (1.3) | – | – | 0–11 | 3.6 (3) | 5.35 | <0.001 |
| SANS | 0–6 | 1.1 (1.6) | – | – | 0–18 | 5.4 (4.1) | 6.42 | <0.001 |
| MSCEIT Overallb | 75–146 | 110 (15) | 80–143 | 108 (18) | 60–136 | 87 (18) | 15.98 | <0.001 |
| Perceiving Emotions | 67–146 | 110 (15) | 87–146 | 112 (18) | 67–129 | 93 (14) | 12.89 | <0.001 |
| Using Emotions | 75–132 | 104 (12) | 79–162 | 110 (19) | 49–127 | 93 (18) | 8.41 | <0.001 |
| Understanding Emotions | 79–132 | 104 (15) | 72–131 | 105 (16) | 67–131 | 92 (16) | 6.44 | 0.002 |
| Managing Emotions | 85–121 | 106 (10) | 72–149 | 103 (16) | 59–149 | 87 (17) | 14.19 | <0.001 |
Notes: BACS = Brief Assessment of Cognition for Schizophrenia composite score; CPZeq = antipsychotic dose in chlorpromazine equivalent; BDI-IA = revised version of the Beck Depression Inventory; YMRS = Young Mania Rating Scale; SAPS = Scale for the Assessment of Positive Symptoms; SANS = Scale for the Assessment of Negative Symptoms; MSCEIT = age- and gender-adjusted scores on the Mayer-Salovey-Caruso Emotional Intelligence Test; SZ = individuals with schizophrenia; BD = individuals with bipolar disorder; HC = healthy controls.
Analysis only included 37 SZ and 12 BD who were taking antipsychotics.
10 SZ and 14 HC did not have data on SAPS, BDI-IA, YMRS, and MSCEIT because the data came through different studies.
Over-perception of Eye Contact
For threshold, BFs of all possible ANOVA models showed that the winning model, providing “decisive” evidence (BF = 1.26 × 10662), contained Group, Emotion, Response Cutoff, Group × Emotion interaction, and Group × Response Cutoff interaction as fixed effects. The evidence of this model was more than 126 times stronger than the next best model (containing all factors except the Group × Emotion interaction). The Group effect indicated that overall threshold for BD (M = 0.64, SD = 0.16) was substantially lower than HC (M = 0.74, SD = 0.14; BF = 3.89) but did not differ from SZ (M = 0.60, SD = 0.17; BF = 0.36). SZ’s overall threshold was “very strongly” lower than HC (BF = 90.18). That is, both BD and SZ needed weaker signal strength to indicate that eye gaze was directed towards them. The Emotion effect indicated that overall, mean threshold for neutral faces (M = 0.64, SD = 0.16) was decisively lower than fearful ones (M = 0.69, SD = 0.20; BF = 6.19 × 10⁵). The Group × Emotion interaction was driven by a clear Emotion effect in BD and HC (neutral < fearful; BF = 115 for BD and 266 for HC) but only “anecdotal” evidence for it in SZ (BF = 2.50). Follow-up pairwise group comparisons at each response cutoff revealed what drove the Group × Response Cutoff interaction. See Figure 3 for eye-contact perception thresholds of each group calculated using nine response cut-offs collapsed across the two emotions. Group differences increased as the response cutoff value to obtain threshold decreased. This was true for both BD - HC comparisons and SZ - HC comparisons. BD started to show clear evidence (BF > 3) of lower threshold than HC at response cutoff of 50% and the group difference reached its maximum at response cutoff of 10%. The pattern was the same for SZ, but the SZ < HC difference was even larger and started sooner at response cutoff of 70%. There were no differences in threshold between BD and SZ (BFs ranging from 0.24 to 0.66).
Figure 3.
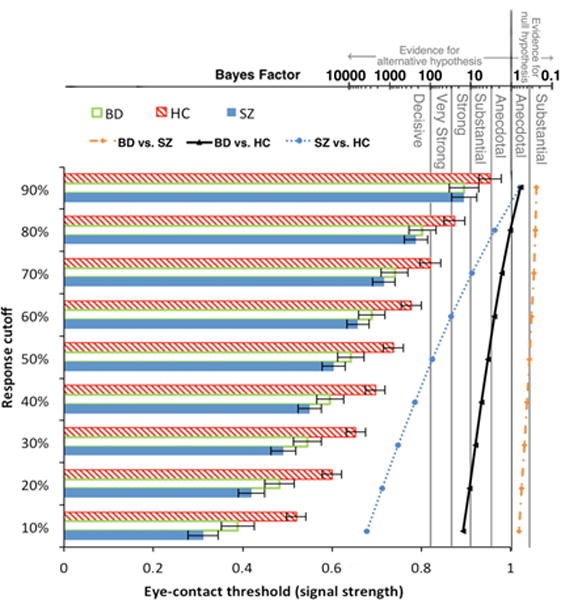
Group differences in eye-contact perception threshold (forward face only) increased as response cutoff (criterion used to obtain threshold) decreased. The corresponding Bayes factors (scale shown on top of the figure) of pairwise group differences at each response cutoff value are plotted to the right of the bars.
For eye-contact endorsement rate, results of BFs showed that the winning model contained fixed factors of Group, Signal Strength, Emotion, Head Orientation, Group × Signal Strength, Emotion × Signal Strength, Group × Head Orientation, Signal Strength × Head Orientation, Emotion × Head Orientation, Group × Signal Strength × Head Orientation, and Emotion × Signal Strength × Head Orientation. The evidence of this model was overwhelmingly “decisive” (BF = 3.34 × 101616), which was more than 167 times stronger than the next best model (containing all but two of the fixed effects in the winning model: Group × Head Orientation and Group × Signal Strength × Head Orientation). Group patterns of eye-contact endorsement rate across eye-contact signal strengths and head orientations collapsed across the two emotions (because there was no interaction between Group and Emotion) are presented in Figure 4. Overall, BD (M = 30%, SD = 14%) endorsed eye contact more frequently than HC (M = 23%, SD = 10%; BF = 3.60), but did not differ from SZ (M = 33%, SD = 13%; BF = 0.33). SZ endorsed more frequently than HC, very strongly (BF = 98.91). The Emotion effect indicated that endorsement rate (M = 31%, SD = 13%) for neutral faces was higher than fearful ones (M = 26%, SD = 13%; BF = 1.19 × 1024). The Head Orientation effect indicated that endorsement rate for forward faces (M = 37%, SD = 13%) was higher than averted faces (M = 21%, SD = 16%; BF = 8.02 × 10²³). The Group × Head Orientation interaction was driven by a higher endorsement rate in BD (M = 37%, SD = 13%) compared with HC (M = 30%, SD = 10%; BF = 3.59) that was not different from SZ (M = 41%, SD = 13%; BF = 0.42) for forward faces. For averted faces, however, there was only “anecdotal” evidence that mean endorsement rate in BD (M = 23%, SD = 17%) was higher than HC (M = 15%, SD = 11%; BF = 1.88) but substantial evidence that it did not differ from SZ (M = 25%, SD = 16%; BF = 0.27). As for the Group × Signal Strength interaction, follow-up pair-wise group comparisons at each signal strength revealed that group differences were the largest in the low to middle range of signal strengths for both BD – HC comparisons and SZ – HC comparisons. There was no difference in mean endorsement rate between BD and SZ across signal strengths.
Figure 4.
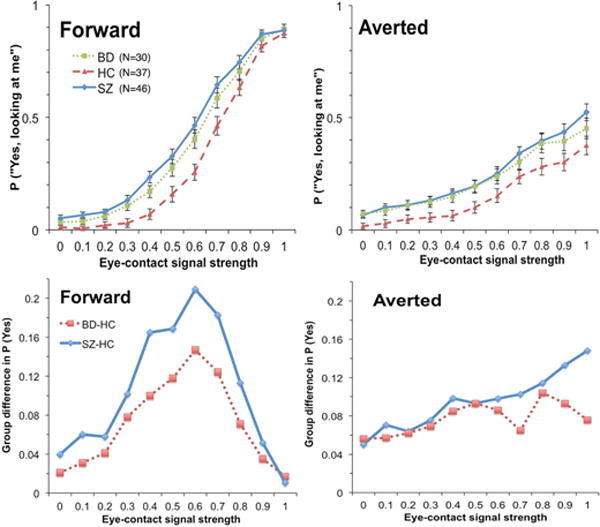
Upper panels: Eye-contact endorsement rate (percentage of “yes, looking at me” responses) by group along the gaze continuum. Lower panels: Over-perception of eye contact of BD and SZ along the gaze continuum (i.e., group differences between BD and HC, and between SZ and HC.)
Intact Perceptual Sensitivity in BD
The gaze perception slope measures how rapidly one’s perception changes from non-self-referential to self-referential, thus an index of perceptual sensitivity. For the slope, results of BFs showed that the winning model, providing “very strong” evidence (BF = 87.98), contained main effects of Group and Emotion only, with no Group × Emotion interaction (see Figure S1 for BFs of all possible models). Follow-up analyses of the Group effect showed that there was no evidence for a difference in gaze perception slope between BD (M = 2.39, SD = 0.67) and HC (M = 2.60, SD = 0.44; d = 0.37, BF = 0.69), or between BD and SZ (M = 2.11, SD = 0.64; d = 0.43, BF = 0.99). The evidence for a shallower slope in SZ relative to HC was “decisive” (d = 0.89, BF = 140.49). The Emotion effect indicated that slope for neutral faces (M = 2.67, SD = 0.72) was strongly steeper than that for fearful faces (M = 2.50, SD = 0.66; BF = 21.21) across participants.
We conducted two follow-up BF analyses to further examine if gaze perception slope was different between subgroups within the BD group. To address the question of psychosis is a determinant of BD’s gaze perception, we compared BD with and without a history of psychosis. BF results favored no group difference in gaze perception slope (BF = 0.35), and the effect size of group difference was also small (d = 0.14). Because the BD group had a higher female-male ratio relative to the SZ and HC groups and the literature suggests that females generally have better social cognition than males (40,41), we also examined whether there were differences in gaze perception slope as well as MSCEIT between female and male BD participants. BF results favored a lack of sex difference in slope of gaze perception (BF = 0.47; d = 0.04) as well as MSCEIT (BF = 0.37; d = 0.02).
Relationship with Clinical and Functional Measures
In both patient groups, eye-contact perception was not significantly correlated with mood symptoms (BDI-IA, YMRS), positive symptoms (SAPS), or negative symptoms (SANS; see Table S1 for pair-wise correlations). In BD and HC, eye-contact perception was not significantly correlated with neurocognition (BACS). However, in SZ, altered eye-contact perception (lower perception threshold at low/medium response cutoffs; reduced slope of categorical shift) was significantly correlated with poorer neurocognition.
To examine the relationship between gaze perception and socio-emotional functioning (MSCEIT) in each group, we assessed the BFs of different linear regression models. The model with the most “decisive” evidence (BF = 1.84 × 10⁷) contained gaze perception slope, group membership of SZ, group membership of BD, and the interaction term between slope and BD membership as predictors of MSCEIT; group membership of HC was the implicit reference group. The evidence of this model was nearly 9 times stronger than the next best model that did not include the interaction term (see Figure S2 for BFs of all models). This winning model suggested that: 1) steeper gaze perception slope was associated with better MSCEIT; 2) the three groups had different intercepts, i.e. different MSCEIT scores when slope was held zero; and 3) BD (but not SZ) had a different (reduced) linear relationship between gaze perception slope and MSCEIT relative to HC—indicating that gaze perception slope had less effect on MSCEIT in BD compared with HC (see Figure 5). The regression model explained 45.6% of variance in MSCEIT (F = 16.6, p < 0.001).
Figure 5.
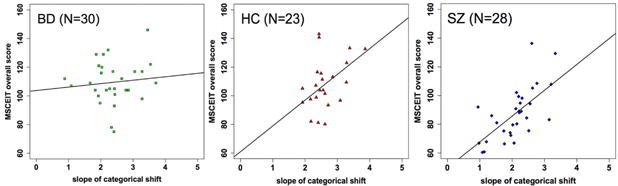
Scatterplots of MSCEIT score against slope of categorical shift with the regression line of the best model among BD (left), HC (middle), and SZ (right). A faster rate at which perception changes from nonself-referential to self-referential directly correlates with better social cognitive performance in HC and SZ.
Discussion
This study examined whether BD showed abnormal self-referential gaze perception—a crucial perceptual component of complex social processes—and whether putative abnormality was related to socio-emotional functioning. Using a psychophysics approach, we found that on some measures of eye-contact perception, BD were indistinguishable from SZ. Like SZ, BD were more likely than HC to report a face to be making eye contact with them, particularly as gaze direction became increasingly averted. BD required a weaker eye-contact signal (i.e. less direct gaze angle) to start perceiving gaze as self-directed, relative to HC. Unlike SZ, however, the slope of the gaze perception curve of BD was not different from HC’s, indicating that as actual gaze became increasingly directed at the participant, gaze perception in BD changed from non-self-referential to self-referential as rapidly as in HC; that change simply occurred sooner than HC (i.e., at a weaker eye-contact signal strength) in BD. Taken together, our findings suggest that BD over-perceive eye contact from gaze that HC would consider ambiguous or non-self-directed, but their perceptual sensitivity was preserved.
We hypothesized that BD would exhibit a similar relationship between gaze perception (slope) and socio-emotional functioning (MSCEIT) as in SZ and HC. However, while higher gaze perception slope was associated with better MSCEIT score in SZ and HC, this relationship was absent in BD. It is noteworthy that although BD showed a self-referential bias in gaze perception, their MSCEIT scores did not differ from HC, consistent with previous reports (42,43). Since reasoning and problem-solving skills appear to be intact in BD (42), it is possible that this compensates for altered perception of social signals, leaving socio-emotional functions, at least as measured by MSCEIT, unaffected. This highlights the issue that social cognitive instruments well-validated in SZ may not have the same utility in BD despite the clinical and cognitive overlap between the two disorders.
Another way in which performance differed between BD and SZ was in the extent to which self-referential biases in gaze perception were influenced by emotion. Both BD and HC required more direct eye gaze to endorse the person as looking at them when the face was fearful than when it was neutral. This effect of facial emotion was blunted in SZ. Such emotion effect on gaze perception is consistent with previous findings in healthy individuals that fearful faces bias people to perceive averted gaze, which could be a result of fearful emotion and averted gaze being congruent in avoidant motivation (29,44). Therefore, it seems that despite an overall tendency of over-perceiving gaze as self-referential, BD showed normal emotional modulation of gaze perception, which distinguished them from SZ. This preserved integration of affective contexts in self-referential social signal processing may be a contributing factor of normal socio-emotional functioning in this BD sample.
The findings of differential gaze perception between BD and SZ in this study have important treatment implications. They suggest that gaze perception deficits in BD and SZ may be driven by different factors, which may have differential relationships with socio-emotional functioning. Many social cognitive trainings have been developed for SZ (45) and there has been effort to apply such interventions to BD (46), assuming that if improvement in those specific social cognitive domains results in improved functional outcome in SZ, the same would happen in BD. Our findings suggest that this may not necessarily be the case. For example, BD participants showed a self-referential bias but preserved perceptual sensitivity, suggesting that abnormal gaze perception in BD likely reflects a top-down problem rather than impaired data-driven perception as observed in SZ. Therefore, interventions for BD should focus on top-down processes (e.g., cognitive restructuring as implemented in cognitive-behavioral therapy; brain stimulation targeting frontal regions); cognitive training paradigms that aim to strengthen early sensory processing for SZ (47) may not be as beneficial. The differential relationship between gaze perception and socio-emotional functioning in BD and SZ suggests that BD and SZ might make social inferences using different strategies or sources of information. Future investigations of the cognitive and neural bases of these strategies would enhance our understanding of differences in social cognition and treatment response between psychiatric disorders as well as across individuals, helping to develop more informative assessment and personalized treatment.
We did not find any significant correlations between gaze perception and positive/negative symptoms in the patient groups. We also did not find any significant differences in gaze perception between BD with and without a history of psychosis, suggesting that abnormal self-referential gaze perception may not be a marker of psychotic symptoms. This is consistent with several previous studies showing that BD with and without psychotic symptoms displayed no difference in their performances of various theory-of-mind tasks (48–50), although one study has reported that BD with psychosis performed worse than those without in the perceptual and reasoning aspects of social cognition, measured with tasks of emotion recognition and logical arrangement of pictures depicting social scenarios (18). It is also possible that altered gaze perception is only related to specific aspects of psychosis such as paranoia, and therefore correlating it with SAPS total score may not be able to capture a true relationship. Given that our analysis was limited by a modest sample size and that previous inconsistent findings in this area may be due to methodological differences, larger studies with more comprehensive assessment of social cognition are needed to more conclusively show whether a history of psychosis in BD has any impact on gaze perception and its relationship to social cognition in general. Further, since most patients in this study were clinically stable and euthymic, it is possible that the null result of symptom correlates of gaze perception in BD was due to the limited range of symptom severity in both groups, as was the case in other studies (17). It remains to be investigated whether impaired gaze perception varies between mood phases in BD.
The interpretation of the current findings is limited by several factors. First, the BD group had a higher female-male ratio relative to the other two groups. Previous social cognition studies in healthy individuals found that women perform better than men (40,41). A recent meta-analysis of social cognitive studies comparing BD and SZ also showed that larger effect sizes (BD better than SZ) were associated with higher male-to-female ratios in the SZ group (22). Although we conducted additional analyses to rule out that the intact gaze perception slope and MSCEIT performance in our BD sample was due to better performance of the female BD participants, the sample size of male BD in this study was undeniably small and it is difficult to draw definite conclusions on potential sex differences in social cognition in BD. This question needs to be addressed in future studies with larger samples that have balanced female-male ratios. Second, different medication regimens could be a potential confound. Our sample size did not permit analyzing sub-groups of BD and SZ who were on similar medication regimens. Because the use and dose of medications are not independent of symptoms and is also confounded by individual treatment response, the question of whether medications contribute to the observed gaze perception abnormalities can only be adequately addressed by studying medication-free participants or those in the early stage of the illness in future studies. Third, the task comprised of many (528) trials and there was a possibility that any poor performance may be due to general cognitive deficits. Since frequent attentional lapses or random responses would result in “noisier” eye-contact endorsement rates for clearly averted and clearly direct gaze (i.e., significantly shifted away from 0% and 100% on both ends of the x-axis), response patterns of all three groups (see Figure 4) show that this was not the case. Although a self-referential bias in BD could be due to low-level perceptual deficits or general cognitive dysfunctions, BD were equally sensitive to gaze signal strength as HC (as indicated by their equal perceptual slopes), making deficits in low-level perception seem unlikely. There was also no significant correlation between neurocognition (BACS) and gaze perception in BD, further ruling out general cognitive deficits as a contributor to their bias. The relationship between general cognitive functioning and gaze perception in SZ has been examined in detail in our previous study, and the finding showed that abnormal gaze perception in SZ is above and beyond just general cognitive deficits (27). Lastly, static visual stimuli were used in this study. There is evidence that different brain systems may be involved in processing static vs. dynamic faces, and dynamic facial expressions may be more ecologically valid than static photos in emotion recognition studies (51). It remains to be investigated whether basic-level social cognition such as eye gaze perception is similarly affected by motion information.
Conclusions
This study used a novel psychophysics approach to examine a fundamental social cognitive function, eye-contact perception, in BD. Our results showed that BD exhibited a similar self-referential bias in eye gaze perception as in SZ, characterized by over-perception of self-directed intention when viewing ambiguous gaze direction, and required weaker eye-contact signal strength to start perceiving eye contact. However, BD’s categorical gaze perception was as efficient as HC’s and their socio-emotional functioning did not appear to depend on gaze perception performance as HC and SZ patients do. These findings suggest that preserved perceptual sensitivity in making eye-contact judgment distinguishes BD from SZ and may suggest differential psychopathological mechanisms of social dysfunction between BD and SZ.
Supplementary Material
Bayes factors comparing four possible ANOVA models against the denominator model (containing no fixed effects) with slope of gaze perception as the dependent variable. Subject was included as an additive random factor in all models.
Bayes factors comparing different regression models against the denominator model containing an intercept only.
Acknowledgments
The authors thank Ms. Gloria Harrington for her assistance in subject recruitment and the participants for their participation in this study. This research was partially supported by the National Institutes of Health (5KL2TR000434 to I.F.T.), the National Institute of Mental Health (5K23MH108823 to I.F.T.; R21MH101676 to S.F.T.; R01MH082784 to V.E.R.), NARSAD Young Investigator award from the Brain and Behavior Research Foundation (to K.T.), and the Heinz C. Prechter Bipolar Research Fund (to M.G.M.).
References
- 1.Grande I, Berk M, Birmaher B, Vieta E. Bipolar disorder. Lancet. 2016;387:1561–1572. doi: 10.1016/S0140-6736(15)00241-X. [DOI] [PubMed] [Google Scholar]
- 2.Sanchez-Moreno J, Martinez-Aran A, Tabarés-Seisdedos R, et al. Functioning and Disability in Bipolar Disorder: An Extensive Review. Psychother Psychosom. 2009;78:285–297. doi: 10.1159/000228249. [DOI] [PubMed] [Google Scholar]
- 3.Saarni SI, Viertio S, Perälä J, et al. Quality of life of people with schizophrenia, bipolar disorder and other psychotic disorders. Br J Psychiatry. 2010;197:386–394. doi: 10.1192/bjp.bp.109.076489. [DOI] [PubMed] [Google Scholar]
- 4.World Health Organization. The Global Burden of Disease: 2004 update. Available from: http://www.who.int/healthinfo/global_burden_disease/GBD_report_2004update_full.pdf. Last accessed April 6, 2017.
- 5.Dean BB, Gerner D, Gerner RH. A systematic review evaluating health-related quality of life, work impairment, and healthcare costs and utilization in bipolar disorder. Curr Med Res Opin. 2004;20:139–154. doi: 10.1185/030079903125002801. [DOI] [PubMed] [Google Scholar]
- 6.Özer S, Uluşahin A, Batur S, et al. Outcome measures of interepisode bipolar patients in a Turkish sample. Soc Psychiatry Psychiatr Epidemiol. 2002;37:31–37. doi: 10.1007/s127-002-8211-z. [DOI] [PubMed] [Google Scholar]
- 7.Fagiolini A, Kupfer DJ, Masalehdan A, et al. Functional impairment in the remission phase of bipolar disorder. Bipolar Disord. 2005;7:281–285. doi: 10.1111/j.1399-5618.2005.00207.x. [DOI] [PubMed] [Google Scholar]
- 8.Martinez-Aran A, Vieta E, Torrent C, et al. Functional outcome in bipolar disorder: the role of clinical and cognitive factors. Bipolar Disord. 2007;9:103–113. doi: 10.1111/j.1399-5618.2007.00327.x. [DOI] [PubMed] [Google Scholar]
- 9.Tabarés-Seisdedos R, Balanzá-Martínez V, Sánchez-Moreno J, et al. Neurocognitive and clinical predictors of functional outcome in patients with schizophrenia and bipolar I disorder at one-year follow-up. J Affect Disord. 2008;109:286–299. doi: 10.1016/j.jad.2007.12.234. [DOI] [PubMed] [Google Scholar]
- 10.Couture SM, Penn DL, Roberts DL. The Functional Significance of Social Cognition in Schizophrenia: A Review. Schizophr Bull. 2006;32:S44–63. doi: 10.1093/schbul/sbl029. [DOI] [PMC free article] [PubMed] [Google Scholar]
- 11.Hoe M, Nakagami E, Green MF, Brekke JS. The causal relationships between neurocognition, social cognition and functional outcome over time in schizophrenia: a latent difference score approach. Psychol Med. 2012;42:2287–2299. doi: 10.1017/S0033291712000578. [DOI] [PubMed] [Google Scholar]
- 12.Van Rheenen TE, Rossell SL. Phenomenological predictors of psychosocial function in bipolar disorder: Is there evidence that social cognitive and emotion regulation abnormalities contribute? Aust New Zeal J Psychiatry. 2014;48:26–35. doi: 10.1177/0004867413508452. [DOI] [PubMed] [Google Scholar]
- 13.Caletti E, Paoli RA, Fiorentini A, et al. Neuropsychology, social cognition and global functioning among bipolar, schizophrenic patients and healthy controls: preliminary data. Front Hum Neurosci. 2013;7:661. doi: 10.3389/fnhum.2013.00661. [DOI] [PMC free article] [PubMed] [Google Scholar]
- 14.Tabak NT, Green MF, Wynn JK, et al. Perceived emotional intelligence is impaired and associated with poor community functioning in schizophrenia and bipolar disorder. Schizophr Res. 2015;162:189–195. doi: 10.1016/j.schres.2014.12.005. [DOI] [PMC free article] [PubMed] [Google Scholar]
- 15.Samamé C. Social cognition throughout the three phases of bipolar disorder: A state-of-the-art overview. Psychiatry Res. 2013;210:1275–1286. doi: 10.1016/j.psychres.2013.08.012. [DOI] [PubMed] [Google Scholar]
- 16.Bora E, Bartholomeusz C, Pantelis C. Meta-analysis of Theory of Mind (ToM) impairment in bipolar disorder. Psychol Med. 2016;46:253–264. doi: 10.1017/S0033291715001993. [DOI] [PubMed] [Google Scholar]
- 17.Lee J, Altshuler L, Glahn DC, et al. Social and Nonsocial Cognition in Bipolar Disorder and Schizophrenia: Relative Levels of Impairment. Am J Psychiatry. 2013;170:334–341. doi: 10.1176/appi.ajp.2012.12040490. [DOI] [PMC free article] [PubMed] [Google Scholar]
- 18.Thaler NS, Allen DN, Sutton GP, et al. Differential impairment of social cognition factors in bipolar disorder with and without psychotic features and schizophrenia. J Psychiatr Res. 2013;47:2004–2010. doi: 10.1016/j.jpsychires.2013.09.010. [DOI] [PubMed] [Google Scholar]
- 19.Hawken ER, Harkness KL, Lazowski LK, et al. The manic phase of Bipolar disorder significantly impairs theory of mind decoding. Psychiatry Res. 2016;239:275–280. doi: 10.1016/j.psychres.2016.03.043. [DOI] [PubMed] [Google Scholar]
- 20.Zhao Y, Luo W, Chen J, et al. Behavioral and neural correlates of self-referential processing deficits in bipolar disorder. Sci Rep. 2016;6:24075. doi: 10.1038/srep24075. [DOI] [PMC free article] [PubMed] [Google Scholar]
- 21.Donohoe G, Duignan A, Hargreaves A, et al. Social cognition in bipolar disorder versus schizophrenia: comparability in mental state decoding deficits. Bipolar Disord. 2012;14:743–748. doi: 10.1111/bdi.12011. [DOI] [PubMed] [Google Scholar]
- 22.Bora E, Pantelis C. Social cognition in schizophrenia in comparison to bipolar disorder: A meta-analysis. Schizophr Res. 2016;175:72–78. doi: 10.1016/j.schres.2016.04.018. [DOI] [PubMed] [Google Scholar]
- 23.Itier RJ, Batty M. Neural bases of eye and gaze processing: The core of social cognition. Neurosci Biobehav Rev. 2009;33:843–863. doi: 10.1016/j.neubiorev.2009.02.004. [DOI] [PMC free article] [PubMed] [Google Scholar]
- 24.Butterworth G. The ontogeny and phylogeny of joint visual attention. In: Whiten A, editor. Natural Theories of Mind: Evolution, Development and Simulation of Everyday Mindreading. Oxford: Basil Blackwell; 1991. pp. 223–232. [Google Scholar]
- 25.Hooker C, Park S. You must be looking at me: The nature of gaze perception in schizophrenia patients. Cogn Neuropsychiatry. 2005;10:327–345. doi: 10.1080/13546800444000083. [DOI] [PubMed] [Google Scholar]
- 26.Rosse RB, Kendrick K, Wyatt RJ, et al. Gaze discrimination in patients with schizophrenia: preliminary report. Am J Psychiatry. 1994;151:919–921. doi: 10.1176/ajp.151.6.919. [DOI] [PubMed] [Google Scholar]
- 27.Tso IF, Mui ML, Taylor SF, Deldin PJ. Eye-contact perception in schizophrenia: Relationship with symptoms and socioemotional functioning. J Abnorm Psychol. 2012;121:616–627. doi: 10.1037/a0026596. [DOI] [PubMed] [Google Scholar]
- 28.Itier RJ, Alain C, Kovacevic N, McIntosh AR. Explicit versus implicit gaze processing assessed by ERPs. Brain Res. 2007;1177:79–89. doi: 10.1016/j.brainres.2007.07.094. [DOI] [PubMed] [Google Scholar]
- 29.Tipples J. Fear and fearfulness potentiate automatic orienting to eye gaze. Cogn Emot. 2006;20:309–320. [Google Scholar]
- 30.First MB, Spitzer RL, Gibbon M, Williams JB. Structured Clinical Interview for DSM-IV Axis I Disorders, Patient Edition (SCID-P), version 2.0. New York, NY: Biometrics Research; 1995. [Google Scholar]
- 31.Nurnberger JI, Blehar MC, Kaufmann CA, et al. Diagnostic Interview for Genetic Studies. Rationale, Unique Features, and Training. Arch Gen Psychiatry. 1994;51:849–859. doi: 10.1001/archpsyc.1994.03950110009002. [DOI] [PubMed] [Google Scholar]
- 32.Beck AT, Steer RA. Manual for the Beck Depresion Inventory. San Antonio, TX: Psychological Corporation; 1993. [Google Scholar]
- 33.Young RC, Biggs JT, Ziegler VE, Meyer DA. A rating scale for mania: reliability, validity and sensitivity. Br J Psychiatry. 1978;133:429–435. doi: 10.1192/bjp.133.5.429. [DOI] [PubMed] [Google Scholar]
- 34.Andreasen NC. Scale for the Assessment of Positive Symptoms (SAPS) Iowa City, IA: University of Iowa; 1984. [Google Scholar]
- 35.Andreasen NC. Scale for the Assessment of Negative Symptoms (SANS) Iowa City, IA: University of Iowa; 1984. [Google Scholar]
- 36.Keefe R, Goldberg TE, Harvey PD, et al. The Brief Assessment of Cognition in Schizophrenia: reliability, sensitivity, and comparison with a standard neurocognitive battery. Schizophr Res. 2004;68:283–297. doi: 10.1016/j.schres.2003.09.011. [DOI] [PubMed] [Google Scholar]
- 37.Mayer JD, Salovey P, Caruso DR. Mayer-Salovey-Caruso Emotional Intelligence Test. North Tonawanda, NY: Multi-Health Systems Inc; 1999. [Google Scholar]
- 38.Jeffreys H. Theory of Probability. 3rd. Oxford, UK: Oxford University Press; 1961. [Google Scholar]
- 39.Morey RD, Rouder JN. BayesFactor: Computation of Bayes Factors for Common Designs. R package version 0.9.12-2. 2015 [Google Scholar]
- 40.Stevens JS, Hamann S. Sex differences in brain activation to emotional stimuli: A meta-analysis of neuroimaging studies. Neuropsychologia. 2012;50:1578–1593. doi: 10.1016/j.neuropsychologia.2012.03.011. [DOI] [PubMed] [Google Scholar]
- 41.Frank CK, Baron-Cohen S, Ganzel BL. Sex differences in the neural basis of false-belief and pragmatic language comprehension. Neuroimage. 2015;105:300–311. doi: 10.1016/j.neuroimage.2014.09.041. [DOI] [PubMed] [Google Scholar]
- 42.Van Rheenen TE, Rossell SL. An empirical evaluation of the MATRICS Consensus Cognitive Battery in bipolar disorder. Bipolar Disord. 2014;16:318–325. doi: 10.1111/bdi.12134. [DOI] [PubMed] [Google Scholar]
- 43.Burdick KE, Goldberg TE, Cornblatt BA, et al. The MATRICS Consensus Cognitive Battery in Patients with Bipolar I Disorder. Neuropsychopharmacology. 2011;36:1587–1592. doi: 10.1038/npp.2011.36. [DOI] [PMC free article] [PubMed] [Google Scholar]
- 44.Adams RB, Franklin RG. Influence of emotional expression on the processing of gaze direction. Motiv Emot. 2009;33:106–112. [Google Scholar]
- 45.Fiszdon JM, Reddy LF. Review of social cognitive treatments for psychosis. Clin Psychol Rev. 2012;32:724–740. doi: 10.1016/j.cpr.2012.09.003. [DOI] [PubMed] [Google Scholar]
- 46.Lahera G, Benito A, Montes JM, et al. Social cognition and interaction training (SCIT) for outpatients with bipolar disorder. J Affect Disord. 2013;146:132–136. doi: 10.1016/j.jad.2012.06.032. [DOI] [PubMed] [Google Scholar]
- 47.Nahum M, Fisher M, Loewy R, et al. A novel, online social cognitive training program for young adults with schizophrenia: A pilot study. Schizophr Res Cogn. 2014;1:e11–e19. doi: 10.1016/j.scog.2014.01.003. [DOI] [PMC free article] [PubMed] [Google Scholar]
- 48.Lahera G, Montes JM, Benito A, et al. Theory of mind deficit in bipolar disorder: Is it related to aprevious history of psychotic symptoms? Psychiatry Res. 2008;161:309–317. doi: 10.1016/j.psychres.2007.08.009. [DOI] [PubMed] [Google Scholar]
- 49.Benito A, Lahera G, Herrera S, et al. Deficits in recognition, identification, and discrimination of facial emotions in patients with bipolar disorder. Rev Bras Psiquiatr. 2013;35:435–438. doi: 10.1590/1516-4446-2013-1086. [DOI] [PubMed] [Google Scholar]
- 50.Martino DJ, Strejilevich SA, Fassi G, et al. Theory of mind and facial emotion recognition in euthymic bipolar I and bipolar II disorders. Psychiatry Res. 2011;189:379–384. doi: 10.1016/j.psychres.2011.04.033. [DOI] [PubMed] [Google Scholar]
- 51.Alves NT. Recognition of static and dynamic facial expressions: a study review. Estud Psicol. 2013;18:125–130. [Google Scholar]
Associated Data
This section collects any data citations, data availability statements, or supplementary materials included in this article.
Supplementary Materials
Bayes factors comparing four possible ANOVA models against the denominator model (containing no fixed effects) with slope of gaze perception as the dependent variable. Subject was included as an additive random factor in all models.
Bayes factors comparing different regression models against the denominator model containing an intercept only.