

Abstract
The clinical course of breast cancer varies from one patient to another. Currently, the choice of therapy relies on clinical parameters and histological and molecular tumor features. Alas, these markers are informative in only a subset of patients. Therefore, additional predictors of disease outcome would be valuable for treatment stratification. Extensive studies showed that the degree of variation of the nuclear DNA content, i.e., aneuploidy determines prognosis. Our aim was to further elucidate the molecular basis of aneuploidy. We analyzed five diploid and six aneuploid tumors with more than 20 years of follow-up. By performing FISH with a multiplexed panel of 10 probes to enumerate copy numbers in individual cells, and by sequencing 563 cancer-related genes, we analyzed how aneuploidy is linked to intratumor heterogeneity. In our cohort, none of the patients with diploid tumors died of breast cancer during follow-up in contrast to four of six patients with aneuploid tumors (mean survival 86.4 months). The FISH analysis showed markedly increased genomic instability and intratumor heterogeneity in aneuploid tumors. MYC gain was observed in only 20% of the diploid cancers, while all aneuploid cases showed a gain. The mutation burden was similar in diploid and aneuploid tumors, however, TP53 mutations were not observed in diploid tumors, but in all aneuploid tumors in our collective.
We conclude that quantitative measurements of intratumor heterogeneity by multiplex FISH, detection of MYC amplification and TP53 mutation could augment prognostication in breast cancer patients.
Keywords: breast cancer, aneuploidy, intratumor heterogeneity, TP53 mutations, MYC amplification
Background
Breast cancer is the most common cancer among women worldwide, and with 521,900 deaths in 2012, also has the highest mortality (Torre, et al. 2015). In the United States, the overall five-year-survival rate for breast cancer patients is about 89%, but ranges from almost 100% when diagnosed with stage I to as low as 25% for stage IV (Howlader, et al. 1975-2014). Clinical and histological parameters, the aggressiveness of individual tumors, and the response of patients to systemic therapy are more variable in breast cancer than in many other types of cancer (Bettaieb, et al. 2017).
However, even at an early stage, tumor-intrinsic genetic alterations affect tumor growth, progression and metastatic potential and therefore limit the value of commonly used prognostic markers. In many cases, the current standard of care does not correctly assess a patient’s prognosis (Ellsworth, et al. 2010).
To improve prognostication, gene expression profiling has been added into clinical management. A commonly used test is OncotypeDX (Genomic Health), which is included in the current ASCO breast cancer guidelines (Harris, et al. 2016; Kwa, et al. 2017). OncotypeDX is applied to stratify early stage breast cancer and measures the expression of 21 genes resulting in a score, which can predict the risk of disease recurrence as well as the potential benefit from chemotherapy (Paik, et al. 2004). Additional gene expression tests such as MammaPrint, Prosigna, or EndoPredict are currently under evaluation in prospective clinical trials (Kwa, et al. 2017; Senkus, et al. 2015; van ‘t Veer, et al. 2002).
In addition to specific gene expression profiles, extensive studies measuring nuclear DNA content showed that the degree of aneuploidy determines disease outcome (Auer, et al. 1984; Cornelisse, et al. 1987; Fallenius, et al. 1988; Kronenwett, et al. 2004). In general, patients with genomically stable tumors have a significantly better prognosis compared to patients whose tumors are aneuploid. We have previously determined a gene expression signature of chromosomal instability, which recapitulated the expression signatures of both OncotypeDX and Mammaprint (Habermann, et al. 2009). We showed that general aneuploidy is reflected in these expression profiles and lays the genetic basis for poor prognosis. However, it remains unclear how aneuploidy is reflected by chromosomal gains and losses in individual cells across the tumor population, and to what extent aneuploidy drives intratumor heterogeneity (ITH). It is also unclear whether aneuploidy correlates with the gene mutation frequency.
To address these questions, we used multiplex interphase FISH (miFISH) with a panel of eight genes commonly subject to copy number changes in breast cancer to determine the extent of ITH due to copy-number variation, and applied targeted sequencing of a panel of 563 cancer-associated genes for the analysis of five diploid and six aneuploid breast cancers from individuals with comprehensive clinical annotation, including a 20-year follow-up period.
Materials and Methods
Tumor samples
Based on DNA content measurements, we selected diploid and aneuploid samples from a cohort of breast cancer patients with a follow-up of at least 20 years, who were treated in Stockholm, Sweden and enrolled in the Stockholm county epidemiological registry. We chose approximately equal group sizes for the diploid and aneuploid tumors. No additional selection criteria were applied. Clinical data were collected during treatment and follow-up. Use of samples and data for this study were approved by the local ethics committee.
Quantitative measurement of the nuclear DNA content
Nuclear DNA content was measured quantitatively after Feulgen staining as described using static image analysis, which converts the computer-aided extinction coefficient of the stained cells into a ploidy degree (Kronenwett, et al. 2004). Around 100-200 tumor cells and 10-20 lymphocytes (serving as diploid reference cells) were measured per case. The DNA histograms (see Figure 1 and Additional File 1 were then classified according to Auer et al. (Auer, et al. 1984).
Figure 1.
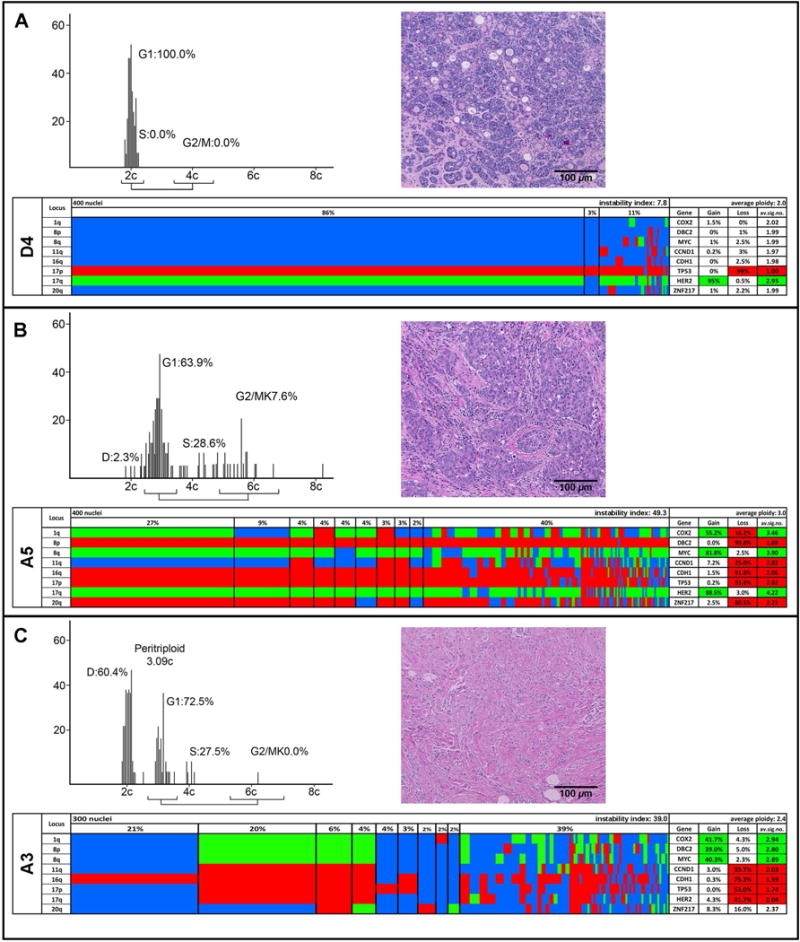
Quantitative DNA content measurements, histology, and multiplex FISH results for the diploid case D4 (A) and the aneuploid cases A5 (B) and A3 (C). The DNA histograms show the quantitative measurements of the nuclear DNA content, and the percentage of cells in G1, S, and G2/M phases of the cell cycle. The histology of each case is based on H&E staining. Color display of miFISH analysis with eight gene-specific probes. Copy number counts for each nucleus are displayed as gains (green), losses (red) and unchanged (blue). Markers are plotted vertically with the “Locus” column depicting the specific chromosome arm for each probe. Nuclei are plotted horizontally by pattern frequency. Each vertical line discerns specific gain and loss patterns and how prevalent these clones are in the population. The instability index and the average ploidy were calculated as described in Material and Methods.
Preparation of sections and cytospins from archived tumor blocks
All experiments were performed on formalin-fixed, paraffin-embedded (FFPE) tumor blocks, from which four sections (thickness: 4 μm, 50 μm, 50 μm, 4 μm) were consecutively prepared. The 4 μm sections were stained with hematoxylin and eosin (H&E) and representative tumor areas were marked on all slides by a pathologist. One 50 μm section was used to prepare cytospins for the miFISH analysis (Heselmeyer-Haddad, et al. 2012). The other 50 μm section was used for sequencing. The representative areas were macrodissected, deparaffinized in xylene, rehydrated and digested with protease. Tissue disintegration was monitored under microscopic control. Once it was judged to be optimal, the reaction was stopped and the density of the single cell suspension was adjusted to achieve medium dense, monolayered cytospins when loading 80-120 μl of suspension into a Shandon cytospin centrifuge.
Multiplex interphase fluorescence in situ hybridization (miFISH)
Bacterial artificial chromosome contigs consisting of three to four overlapping clones were assembled targeting the following eight breast cancer associated genes: COX2 (1q31.1), DBC2 (8p21.3), MYC (8q24.21), CCND1 (11q13.3), CDH1 (16q22.1), HER2 (17q12), TP53 (17p13.1), and ZNF217 (20q31.2). All clones were labeled by nick translation with fluorochromes DY-415-dUTP (ZNF217, MYC), DY-505-dUTP (CDH1, CCND1), DY-547P1-dUTP (TP53, DBC2) and DY-590-dUTP (HER2, COX2). The two centromere probes, CEP4 and CEP10, were labeled with DY-651. All fluorochrome conjugates were purchased from Dyomics (Jena, Germany). The FISH probes were combined into two panels: ZNF217, HER2, TP53, CDH1, CEP10, and MYC, COX2, DBC2, CCND1, CEP4. The two panels were consecutively hybridized onto the same cytospins, so that all 10 probes could be enumerated in each nucleus. The miFISH procedure was performed as previously described (Heselmeyer-Haddad, et al. 2012).
Across the 11 samples, 12,000 nuclei were automatically imaged with a fluorescence microscope and a 20x oil immersion objective (BX63, Olympus, Tokyo, Japan) equipped with custom optical filters (Chroma, Bellow Falls, VT, USA) with a motorized stage and custom scanning and analysis software (BioView, Rehovot, Israel). For the consecutive hybridizations, the coverslip was removed and the slides were washed in 2xSSC, stripped in 70%FA/2xSSC at 80°C for one minute, dehydrated and air-dried. The slides were then re-hybridized with panel 2 prior to a second scan. Images for subsequent hybridizations were automatically overlaid for the same target nuclei. Nuclei and signal counts for all 10 FISH probes were presented in a custom gallery overview (BioView), which allows for manual correction of the automated counts. Enumeration was performed in a consecutive manner. Nuclei were excluded from analysis if (i) they overlapped with another nucleus, (ii) the nucleus was damaged or incomplete or (iii) at least one probe signal was not clearly visible. For nine cases 400 interphase nuclei were evaluated; for cases A3 and A4 300 nuclei were evaluated due to a lower number of cells available that met the three inclusion/exclusion criteria.
Determining clonal signal patterns and instability indices
Excel spreadsheets of signal counts were automatically recorded and exported for subsequent analysis. These spreadsheets contained signal counts for each nucleus analyzed for the two centromere probes (CEP10 and CEP4) and the eight gene probes, and were sorted by chromosome order. Every row of the 10 probe signals represents a signal pattern. Any patterns observed more than once were subsequently grouped together, and the count for each pattern was recorded in a separate column. The signal pattern consisting of two signals for every probe, which could be stromal or immune cells, was not included in the analysis. The most common signal pattern in every cell population was determined as the major signal pattern clone. The instability index was calculated by dividing the number of observed signal patterns by the numbers of enumerated nuclei and then multiplying by 100.
Determining gain and loss patterns
Each nucleus analyzed by miFISH was assigned an integer ploidy value to infer gains and losses of probe signals. The ploidy assignment for each nucleus was informed by the average of either all 10 FISH probes (cases D2-D5, and A1, A3, A4 and A6) or a subset of the probes leaving out markers with amplifications or losses that biased the average (cases D1 (DBC2, CDH1, TP53 and MYC not included), A2 (MYC and CCND1 not included), A5 (DBC2, CDH1 and TP53 not included in the average)). Ploidy values were assigned to each signal pattern by expert (K.H.-H.) annotation based on the average values, using gene counts and knowledge of which genes were oncogenes versus tumor suppressors to resolve difficult assignments. The ploidy assignments matched in general the DNA histogram measurements, showing mainly diploid nuclei for the diploid cases, mainly triploid nuclei for cases A2 and A5, and A6, mainly pentaploid for A4 and mixed populations of diploid and triploid nuclei for the cases A1 and A3. The DNA histogram for A6 showed also a diploid cell population. However, the diploid cells detected in this case by miFISH showed two copies for every FISH probe and were therefore not included in the miFISH analysis as explained above.
We subsequently applied a program that compares the gene signal counts to the ploidy of each cell, which allowed us to translate the signal count of each probe into either “gained” (G), “lost” (L), or, if the signal count equals the ploidy value, into neutral (N). For example, a gain of MYC and loss of TP53, with all other gene probes neutral, would be described as NNGNNLNN. Output files list the gene probes in order of their chromosome location, consolidate nuclei with the same G, L, N pattern and can be sorted by frequency. These files are the basis of the color displays shown in Figure 1 and Additional File 2, which give an overview of the clone distributions and the gain and loss percentages for each gene within a case.
Phylogenetic tree inference
Tree models of tumor progression were computed using the software FISHtrees 3.1 in the weighted, ploidyless mode(Chowdhury, et al. 2015), which models gains and losses of single genes, gains and losses of single chromosomes, and genome doubling as distinct events with different probabilities. The probe set includes two probes on chromosome 8 (DBC2 and MYC) and two probes on chromosome 17 (HER2 and TP53). An increase of 1 in both probes on the same chromosome or a decrease of 1 in both probes on the same chromosome are interpreted as the single event of a gain or loss of one copy of that chromosome, respectively.
Targeted next generation sequencing
For each case, DNA was extracted from a representative area of a 50 μm section using proteinase K digestion as previously described (Killian, et al. 2014). Targeted next generation sequencing was performed with a capture assay, termed OncoVar, which was designed to sequence coding exons of 563 cancer related genes (Boikos, et al. 2016). The resulting paired-end libraries were sequenced on Illumina NextSeq 500 sequencers (Illumina, San Diego, CA, USA).
Sequencing data processing and analysis
Our data processing and variant calling procedure mainly followed the Best Practices workflow recommended by the Broad Institute. Briefly, the raw sequencing reads were mapped to human genome build 19 by Burrows-Wheeler Aligner (Li and Durbin 2009) followed by local realignment using the GATK suite from the Broad Institute and duplicated reads were marked by Picard tools. The UnifiedGenotyper from the Broad Institute was used to call variants (Cingolani, et al. 2012). Multiple annotation databases, including dbNSFP (Liu, et al. 2011), dbSNP 147 (NCBI) (Sherry, et al. 2001), ESP6500 (NHLBI Exome Sequencing Project), and the COSMIC database (Forbes, et al. 2017) were used to annotate and predict the effects of variants.
The following filtering criteria were used to drop a fraction of the variant calls: 1) did not pass variant caller filters; 2) fraction of alternative reads <= 5%; 3) reference read depth <= 5 and alternative read depth <= 3; 4) QUAL <30 5) MAPQ score < 55 6) low impact according to dbNSFP. The fifth criterion was relaxed for two PIK3CA variants with >200 occurrences in COSMIC. They have MAPQ = 48.1 and 54.1 respectively and were visually validated by several people independently (Liu, et al. 2013). Then, we did two types of allele frequency filtering. First, variants that identified as common SNPs in the NCBI dbSNP version 147 were removed from the variant list. Second, variants with allele frequency (AF), overall allele frequency in ESP (ESP_AF_GLOBAL), or minor allele frequencies (ESP6500 MAF_EA) over 0.001 in the Exome Aggregation Consortium (ExAC, release 3.1) were removed as well. All the identified SNVs and indels were validated visually using Integrative Genomics Viewer (IGV, Broad Institute).
Statistics
Two-tailed t-tests were used to calculate p-values for comparisons between diploid and aneuploid tumors.
Results
The degree of aneuploidy, defined as deviations from a diploid genome and determined by quantitative measurements of the nuclear DNA content, profoundly influences disease outcome of patients with breast cancer (Auer, et al. 1984). Here, we aimed to (i) understand patterns of aneuploidy by copy number analysis of multiple gene loci in single cells, to (ii) quantify the extent of ITH, and to (iii) identify gene mutation spectra associated with aneuploidy and poor survival.
Clinical data
The clinical data, including age at diagnosis, clinical tumor stage and tumor size, estrogen receptor (ER) and progesterone receptor (PR) receptor status, the occurrence of local relapse and distant metastases during follow-up, and survival, together with the results of the miFISH and sequence analyses are summarized in Table 1.
Table 1.
Summary of clinical data, miFISH results and mutation analysis
| Clinical Data | miFISH Analysis | Targated equencing Analysis | ||||||||||||||||||||
|---|---|---|---|---|---|---|---|---|---|---|---|---|---|---|---|---|---|---|---|---|---|---|
| Case No. | Age (yrs) |
pre- or post- menopausal |
Clinical T Stage |
Tumor Size (mm2) |
ER Status |
PR Status |
Lymph Node Status (pos. nodes in nodes resected) |
Local relapse |
Distant mets1 |
Distant mets2 |
Alive/Dead after 20 years (months alive after diagnosis) |
Overall Survival in days |
Instability Index |
% cells with major signal pattern |
Major signal patterns in following order Ploidy-COX2-DBC2-MYC-CCND1-CDH1-TP53-HER2-ZNF217 |
Gains | Losses |
TP53 mutation |
Mutated genes and their mutation sites | Tumor cell frequency % |
Mean target coverage |
|
| Diploid | D1 | 66 | Post | T1 | 7 | Pos. | P os. | Neg. (0/10) | 0 | 0 | 0 | Alive | 8058 | 21.5 | 49.3 | 1-2-2-4-2-1-1-2-2 | MYC | DBC, CD 2 1, TP53 H | No | ERBB2 (V777L), FDF6 (Y148*), PIK3CA (H1047R) | 70 | 175.78 |
| D2 | 72 | Post | T1 | 7 | Neg. | Neg. | Neg. (0/9) | 0 | 0 | 0 | Dead by CCVD (180) | 5479 | 15.3 | 67.0 | 2-2-2-2-3-2-1-3-2 | CCND1, HER2 | TP53 | No | BCOR (R342*), PIK3CA (R108del) | 70 | 393.45 | |
| D3 | 45 | Pre | T1 | 20 | Pos. | Pos. | Neg. (0/15) | ipsilateral br e ast | 0 | 0 | Alive | 8012 | 11.8 | 75.3 | 2-4-2-2-1-1-2-2-1 | COX2 | CDH1, TP53, HER2 | No | FLCN (R194W), PIK3CA (H1047R), PTPRD (R995H) | 50 | 381.16 | |
| D4 | 62 | Post | T2 | 18 | Neg. | Neg. | Neg. (0/3) | 0 | 0 | 0 | Alive | 7886 | 7.8 | 84.5 | 2-2-2-2-2-2-1-3-2 | HER2 | TP53 | No | ATP7B (Q1210frameshift), FGFR4 (V510M) | 70 | 79.23 | |
| D5 | 69 | Post | T1 | 11 | Pos. | Pos. | Neg. (0/11) | 0 | 0 | 0 | Alive | 7886 | 14.3 | 72.3 | 2-2-2-2-2-1-2-2-2 | CDH1 | No | ABL1 (P918L), CSF1R (W1 9*), MYB (T758M), 5 PIK3CA (E545K) | 50 | 35.36 | ||
| Averages and Totals | 62.8 | 12.6 | 3/5 | 3/5 | 0/5 | 1/5 | 0/5 | 0/5 | None Dead by BC | 7464 | 14.1 | 69.7 | 1 | 1.8 | 0/5 | average no. of mutations: 2.8 | 213.00 | |||||
| Aneuploid | A1 | 40 | Pre | T2 | 30 | Neg. | Neg. | Neg. (0/11) | 0 | 0 | 0 | Alive | 8049 | 35.5 | (44.4) 4.8 | (2-3-2-4-2-2-1-1-2) 3-2-2-10-3-4-2-2-5 |
COX2, MYC, CDH1, ZNF217 | COX2,DBC2, TP53, HER2 | Yes | EPH86 (S172_173dup), SCN5A (R1195C), TP53 (G154frameshift) | 40 | 165.04 |
| A2 | 60 | Post | T2 | 30 | Pos. | Pos. | Pos. (1/3) | lymph node s | bones | liver | Dead by BC (0 2 1) | 3090 | 44.8 | 13.0 | 3-3-2-12-6-2-2-4-4 | MYC, CCND1, HER2, ZNF217 | DBC2, CDH1, TP53 | Yes | EPHA6 (R268C), FGFR4 (R411frameshift), TP53 (R209frameshift) | 6 0 | 54. 3 7 | |
| A3 | 53 | Post | T2 | 27 | Pos. | Neg. | Pos. (14/18) | 0 | 0 | 0 | Dead by BC (19) | 584 | 39.0 | (37.0) 11.8 | (2-2-2-2-2-1-2-2-2) 3-4-4-4-2-2-1-2-3 |
COX2, DBC2, MYC | CCND1, CDH1, TP53, HER2 | Yes | AKT1 (E17K), CDH1 (Q23*), PDE4DIP (D1912N), TP53 (Q192*) | 25 | 204.97 | |
| A4 | 49 | Pre | T2 | 20 | Pos. | Pos. | Neg. (0/4) | ipsilateral breast | mediastinum | 0 | Dead by BC (58) | 1782 | 82.0 | 9.3 | 5-6-2-8-8-5-3-3-8 | COX2, MYC, CCND1, ZNF217 | DBC2, TP53, HER2 | Yes | BRCA1 (Q12frameshift), LRP1B (G4525V), PIK3CA (E542K), TP53 (Q16frameshift) | 50 | 127.93 | |
| A5 | 64 | Post | T 2 | 25 | s Po. | Neg. | Pos. (1/10) | 0 | 0 | 0 | l A i e v | 789 6 | 49.3 | 15.5 | 3-4-1-4-3-2-2-4-2 | COX2, MYC HER2, | DBC, C 2 H1 D, TP53, ZNF217 | Yes | A FF3 (T 1 F) AT2 6 9, N (D251N) NF1, (L2671frameshift),TP53 (R213L) | 40 | 179.93 | |
| A6 | 46 | Post | T2 | 15 | Neg. | Neg. | Neg. (0/10) | lymph d no es | 0 | 0 | Dead by BC (167) | 5112 | 36.5 | 11.3 | 3-6-2-4-3-2-2-3-3 | COX2, MYC | DBC2, CDH1, TP53 | Yes | ORM2 (F144frameshift), TP53 (R196*) | 25 | 41.15 | |
| Averages and Totals | 52.0 | 24.5 | 4/6 | 2/6 | 3/6 | 3/6 | 2/6 | 1/5 | 4 Dead by BC | 4419 | 47.9 | 11.0 | 3.3 | 3.5 | 6/6 | average no. of mutations: 3.3 | 128.90 | |||||
ER: Estrogen Receptor
PR: Progesterone Receptor
CCVD: Chronic Cardiovascular Disease
BC: Breast Cancer
The age reflects the age at diagnosis.
All local relapses and distant metastases during follow-up were documented.
Instability index is calculated as number of signal patterns × 100/number of cells analyzed.
Major signal patterns: Copy numbers higher than the ploidy (first number) are bolded (gains), copy numbers lower.
Percentages for the diploid and aneuploid signal pattern clones in cases A1 and A3 are calculated separately within the diploid and the aneuploid cell populations of these cases.
Gains and losses tabulated in this table were derived from all major signal patterns listed for the case.
True mutations were filtered from sequencing data as being listed in Cosmic or frameshift or stop mutations.
Quantification of DNA ploidy
Five of the tumors of the 11 patients included in the study showed a diploid DNA content, six were aneuploid (therefore, the case numbers of diploid tumors are preceded by D, aneuploid ones by A). Representative examples of the respective DNA histograms (cases D4, A3 and A5) are shown in Figure 1. DNA histograms were classified as diploid and aneuploid according to Auer et al. (Auer, et al. 1984). which matched the ploidy assignment by miFISH as described in the Material and Methods section. The DNA histograms for the remaining cases are shown in Additional File 1.
Analysis of ITH by miFISH
In recent years, ITH has become recognized as a critical inherent feature of cancer. ITH is associated with tumor evolution, treatment resistance, disease recurrence and metastasis (Aparicio and Caldas 2013; Burrell, et al. 2013; Duesberg, et al. 2011; Heselmeyer-Haddad, et al. 2012; Marusyk, et al. 2012; McGranahan and Swanton 2015). To assess to what extent quantitative differences in the nuclear DNA content are correlated with ITH, we have developed an interphase multicolor FISH technique (miFISH) that allows visualization of up to 20 loci in individual tumor cells. This approach is based on determining the copy numbers of individual genes relevant for the tumor type (Heselmeyer-Haddad, et al. 2012).
In this study, we targeted eight breast cancer relevant genes: COX2 (chromosome arm 1q), DBC2 (8p), MYC (8q), CCND1 (11q), CDH1 (16q), TP53 (17p), HER2 (17q), and ZNF217 (20q). These genes were selected because they map to chromosome arms frequently subject to copy number alterations in breast cancer, as previously determined by comparative genomic hybridization (Kallioniemi, et al. 1994; Ried, et al. 1995). Probes that target the centromeres of chromosomes 4 and 10 were included to provide additional information to help assess the general ploidy of the cells. The FISH analyses matched well with the quantitative DNA content measurements (Figure 1).
Diploid tumors had a lower instability index than aneuploid tumors. Specifically, the instability indices in diploid tumors ranged from 7.8 to 21.5 (average 14.1) and in aneuploid tumors from 35.5 to 82.0 (average 47.9), revealing a profound difference (p=0.004). Diploid tumors had on average 2.8 copy number changes, while the number in aneuploid tumors increased to 8.0 (p=0.0001) (Table 2). There was an almost equal distribution between copy number gains and copy number losses in the aneuploid tumors. The diploid tumors showed slightly more losses than gains. The relative lower degree of instability was also clearly reflected in the percentage of cells with a major signal pattern clone (defined as the percentage of cells with identical copy numbers for all gene probes), which ranged in diploid tumors from 49.3 to 84.5 (average 69.7) versus 4.8 to 15.5 (average 11.0) in aneuploid tumors (p=0.0003). Using this measurement of clonality, the degree of ITH in aneuploid tumors is more than 6 times higher than in diploid tumors.
Table 2.
Comparison of gain and loss frequencies for diploid and aneuploid breast cancers (BC).
| No. of lesions with >15% of cells with specific marker gain or loss | ||
|---|---|---|
| Marker | Diploid BC (n=5) |
Aneuploid BC (n=6) |
| COX2 gain | 1/5 | 5/6 |
| COX2 loss | 0/5 | 3/6 |
| DBC2 gain | 0/5 | 1/6 |
| DBC2 loss | 1/5 | 5/6 |
| MYC gain | 1/5 | 6/6 |
| CCND1 gain | 1/5 | 3/6 |
| CCND1 loss | 0/5 | 2/6 |
| CDH1 gain | 0/5 | 2/6 |
| CDH1 loss | 3/5 | 5/6 |
| TP53 loss | 4/5 | 6/6 |
| HER2 gain | 2/5 | 2/6 |
| HER2 loss | 1/5 | 3/6 |
| ZNF217 gain | 0/5 | 3/6 |
| ZNF217 loss | 0/5 | 2/6 |
| Total no. of changes | 14 | 48 |
| Average no. of changes/lesion | 2.8 | 8.0 |
The results of the enumeration of 300 or 400 individual nuclei per case are presented as color displays in Figure 1 for one representative diploid case (D4, Figure 1A) and two aneuploid cases (A5 and A3, Figure 1B, C). In the diploid case D4, 86% of the cells had the same imbalance clone (defined by the pattern of G(gain), L(loss), and N(neutral) compared to the ploidy of the cell, as explained in Materials and Methods) with a loss of TP53 and a gain of HER2, and 84.5% of the cells had identical signal counts for all probes with two copies for six genes, one copy for TP53 and three copies for HER2. This pattern is consistent with the formation of an isochromosome 17q, one of the most common cytogenetic abnormalities in breast carcinomas (Mertens, et al. 1994). A minor clone of 3% of the population revealed an exclusive loss of TP53, while 11% of the cells had a more diverse pattern of gains and losses. However, the loss of TP53 and gain of HER2 was maintained even in those cells with higher chromosomal instability. In contrast, the aneuploid tumor A5 showed a major imbalance clone in only 27% of the cells with all genes gained or lost except for CCND1 and with only 15.5% of the cells showing the same signal pattern clone. However, as in case D4, despite this high degree of chromosomal instability and ITH, frequent gains and losses were maintained throughout the subclones and the more heterogeneous population. The color display of Case A3 is presented in Figure 1C. In this case, we observed two major clones in 21% and 20% of cells. One clone was diploid and only showed copy number losses of CDH1 (21%), whereas the second clone was triploid and exhibited additional losses of CCND1 and the entire chromosome 17, along with gains of COX2 and a pattern consistent with the copy number gain of the entire chromosome 8 (20%). Color displays for all other cases are shown in Additional File 2.
Case D1 revealed a pattern consistent with the formation of an isochromosome 8q in 67% of cells, an isochromosome also previously reported in the literature (Mertens, et al. 1994), accompanied by losses of CDH1 and TP53. Case D2 showed an isochromosome 17q and a gain of CCND1 as the major clone pattern in 67% of cells (an isochromosome 17q was also present in case D4 as the sole event in 86% of cells). In case D3, the gain of COX2 and losses of CDH1 and the entire chromosome 17 occurred in 77% of cells, whereas case D5 was characterized by exclusive loss of CDH1 in 73% of cells.
The clone patterns were strikingly different in the aneuploid cancers: case A1 revealed, similarly to case A3, a diploid and a triploid/hypotetraploid population. The diploid population is responsible for a large clone with copy number increases of COX2 and MYC, accompanied by losses of chromosome 17 (38%) and for a smaller clone (7%) that had the same pattern as the large clone, but no gain of COX2. The triploid/hypotetraploid cell population displayed two clones (7% and 6%), which had the MYC gain and the loss of chromosome 17 in common with the diploid clone, but showed a loss of COX2, and gains of CDH1 and ZNF217. One of these clones distinguished itself by an additional loss of DBC2. The rest of the cells consisted of minor clones with a variation of the patterns described above and showed relatively high heterogeneity. Case A2 revealed a major imbalance clone in 60% of cells, with losses of DBC2, CDH1 and TP53, and gains of MYC, CCND1, HER2 and ZNF217. Only COX2 was not subject to copy number change. Case A4 displayed changes for all genes in around 30% of the cells. The major imbalance clone comprised of only 27% of cells for which CDH1 was the only gene that was copy number neutral. This case was the most unstable (instability index 82.0) which is consistent with the fact that this was also the case with the highest ploidy value (pentaploid). Case A6 had a major clone in 43% of the population defined by gains of COX2 and MYC, and losses of DBC2, CDH1 and TP53. The minor clones displayed almost identical patterns to the one observed in the major clone, however, with slight variations, e.g. no gain of COX2 or an additional gain of CCND1 and/or loss of ZNF217.
The genes that were most frequently subject to copy number gains were MYC and COX2 (1/5 and 1/5 diploid cases, and 6/6 and 5/6 aneuploid cases, respectively), while TP53 and CDH1 were most commonly lost (4/5 and 3/5 in diploid cases, and 6/6 and 5/6 in aneuploid cases, respectively) (see Table 2). Of note, TP53 was lost in almost all samples with the exception of one diploid case (D5) which was characterized by a very clonal loss of CDH1. The difference in frequencies of MYC copy number gains between diploid and aneuploid tumors was statistically significant (p=0.01).
We display the trajectory of tumor evolution graphically in Figure 2. We show examples in which the tumor evolution in a diploid tumor follows a rather simple path (case D4), or paths that display a greatly increased complexity in aneuploid tumors (cases A3 and A5). In the first case, the tumor is dominated by a pattern consistent with an isochromosome 17q (D4) and only a low percentage of cells deviate from the major clone (cell populations connected by an arrow only change by a single gene probe). The second case, (A5), reveals a major clone in 27% of cells, and numerous minor clones which deviated by copy number changes consistent with chromosomal gains and losses from the major clone or its derivatives. In another aneuploid tumor with a diploid and triploid cell population (A3) 21% of the cells differed from a diploid copy number count only by the loss of CDH1 (16q) However, the triploid cell population displayed gains of COX2 (1q) and the entire chromosome 8, along with losses of CCND1 (11q), CDH1 (16q), and the entire chromosome 17 with some subclones harboring either additional gains or losses of ZNF217 (20q). Also, the diploid cell population had a variety of minor subclones sporting different single gains or losses. Interestingly, we observed one near-tetraploid cell with a loss of CDH1(16q) and CCND1 (11q) which could be the potential intermediate between the diploid and triploid cell population.
Figure 2.
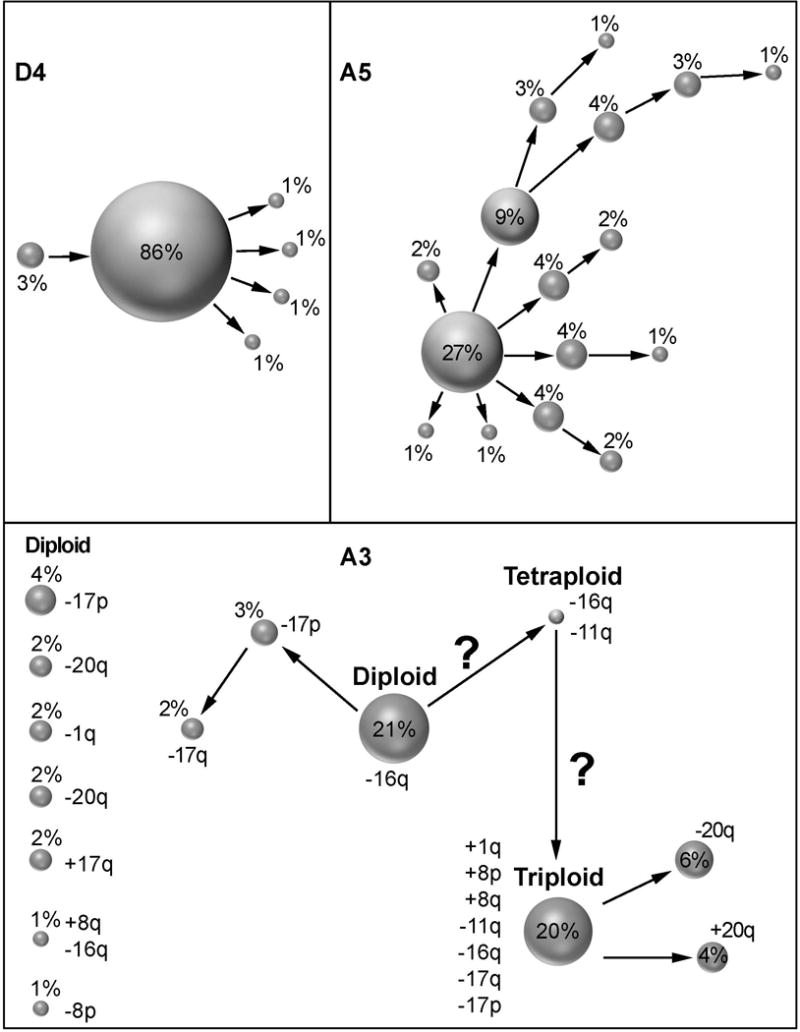
Patterns of clonal evolution of cases D4 (A), A5 (B) and A3 (C). We show the percentage of dominant imbalance clones and their derivations. Clones derived by a single gain or loss change are connected by arrows. In (C) we also denote specific gain and loss patterns to the right of each clone. Clones that are not connected by arrows must have undergone more than one gain or loss change. Note the greatly increased genomic instability in aneuploid cases (B, C).
FISHtrees analysis of clonal diversity in diploid and aneuploid tumors
We used the software FISHtrees version 3.1 (Gertz, et al. 2016), which infers phylogenetic trees based on the FISH data and thereby allows the reconstruction of clonal relationships (Figure 3 shows an example of FISHtrees output). As expected, we observed fewer nodes and less branching in the diploid cases, which reflects the lower instability indices. The FISH trees of the aneuploid tumors were often very complex with a multitude of nodes (reflecting different signal patterns) in different tree levels and with substantial branching reflecting the higher burden of copy number changes and heterogeneity. An example of a FISHtrees analysis is provided in Figure 3 for case A3, which consisted of a mixture of diploid and triploid cell populations. In the FISHtrees analysis, we could identify one near-tetraploid cell that most likely emerged after genome duplication and potentially gave rise to the triploid clone observed in around 40% of the tumor cell population. The FISH tree highlights the major diploid clone (large blue node) and the diploid cell of origin (small blue node) of the near-tetraploid intermediate (pink) that progressed via additional losses to a triploid cell clone. Further diversification then resulted in a complex branch for the triploid cell population of this case (green nodes).
Figure 3.
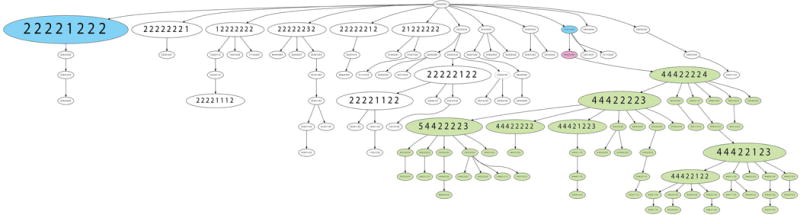
FISHtrees analysis of case A3. The FISHtrees analysis shows the clonal evolution of tumor A3. Details of the analysis are described in Materials & Methods. FISH patterns are depicted in the following gene order COX2, DBC2, MYC, CCND1, CDH1, TP53, HER2, ZNF217. The size of the nodes reflects the frequency of the patterns in the cell population. The blue labeled nodes indicate the presence of the major diploid clone (pattern 22221222) and a smaller diploid clone (pattern 22212222) from which a genome duplication (labeled in pink, pattern 44422444) might have possibly originated leading in turn to the emergence of a triploid clone (pattern 44422224) and its progeny, labeled in green.
Landscape of gene mutations
To assess the protein-altering mutations, in the tumor samples we used targeted sequence analysis of 563 cancer-related genes (see Materials and Methods (Boikos, et al. 2016)). Table 1 lists the mutated genes detected in each case. The specific mutations for each gene and their functional annotations are shown in Additional File 3. The mutation frequency was not significantly different in diploid versus aneuploid tumors (on average 2.8 mutations per case in the diploid tumors, compared to 3.3 in the aneuploid tumors). Across all tumors, TP53 was the most commonly mutated gene. Notably, TP53 mutations were exclusively observed in all aneuploid tumors, while none of the diploid tumors revealed mutations of this tumor suppressor (p=0.002). Mutations in PIK3CA were observed in four diploid cases (D1, D2, D3, D5) and one aneuploid case (A4). We detected single mutations in various genes, including AKT1, BRCA1, CDH1, ERBB2 and NF1.
In summary, we quantitatively measured the nuclear DNA content of 11 breast cancer samples from patients with good or poor prognosis. The genetic consequences of crude DNA ploidy levels in the tumor population were determined by miFISH and revealed both a higher number of chromosomal gains and losses and an even more profound increase of ITH. The mutation frequency in diploid and aneuploid tumors was similar, however, TP53 mutations occurred exclusively in aneuploid tumors in our collective. Aneuploidy, TP53 mutations, higher numbers of chromosomal gains and losses and, most strikingly, increased ITH, correlated with overall survival.
Discussion
To understand the consequences of crude aneuploidy in the context of genomic instability on a single cell level and with respect to its effect on ITH of the tumor cell population, we conducted a comprehensive molecular cytogenetic analysis of gene copy number changes, mapped the degree of ITH, and determined the spectrum of gene mutations in a set of breast cancers with greatly different disease outcome.
Differences between diploid and aneuploid tumors
We assessed the following clinical and genetic parameters in diploid versus aneuploid tumors: patient age at diagnosis, tumor size, hormone receptor status, lymph node positivity, the occurrence of local relapse and distant metastases, overall survival, chromosomal instability index (number of signal patterns x100 divided by the number of cells), presence of major clones (determined by FISH), and mutations in a set of 563 cancer associated genes (Boikos, et al. 2016). The mean age at time of diagnosis of the patients with diploid tumors was 62.8 years versus 52 years for patients with aneuploid tumors. This is consistent with a generally poorer prognosis for younger breast cancer patients (El Saghir, et al. 2006). The mean tumor size in patients with diploid tumors was 12.6 mm2 compared to 24.5 mm2 in aneuploid tumors. Of note, patients with a similar tumor size fared very differently depending on the ploidy of their lesions. The two patients with the smallest tumor size in the aneuploid group (15 and 20 mm2, cases A6 and A4) both succumbed to breast cancer, while the two patients with the largest diploid tumors (18 and 20 mm2, cases D4 and D3) were both still alive after 20 years, indicating that other factors than tumor size play an important role for patient outcome.
Lymph node status in all diploid tumors was negative, while 50% of aneuploid tumors had positive lymph nodes. Local relapse occurred in 1/5 patients with a diploid tumor but in 3/6 patients with aneuploid tumors. We did not observe any distant metastases in diploid tumors, whereas 2/6 aneuploid patients were positive. All of the patients with diploid tumors were either alive after a 20-year follow-up period or died of causes other than breast cancer, while 4/6 patients with aneuploid tumors succumbed to breast cancer (mean survival 86.4 months). Half of these patients presented with distant metastases (Table 1). The correlation of these clinical parameters with overall survival is consistent with the literature (Soerjomataram, et al. 2008).
The most pronounced genetic difference between the diploid and aneuploid tumors was the instability index calculated based on differential FISH signal patterns observed per 100 nuclei, which was on average 3.4 times higher in aneuploid tumors. Heterogeneity is also reflected by the percentage of cells with identical signal count patterns in the tumor cell population (i.e., clones). Comparing the size of the major signal pattern clones, the degree of ITH was 6.3 times higher in the aneuploid tumors. This could be interpreted such that the degree of “genomic nimbleness” greatly facilitates the propensity to acquire a tumor genotype conducive for rapid proliferation, for the development of metastatic disease, and for the development of treatment resistance. This is consistent with the results from one of our previous studies in which we measured overall genomic instability and ITH in matched DCIS and IDC samples (Heselmeyer-Haddad, et al. 2012). In that study, we observed increased ITH often already in the DCIS lesion. We also detected copy number increase of MYC as a major determinant of progression from DCIS to IDC. In the present study, we observed MYC copy number gains in all aneuploid tumors, yet in only 1/5 diploid tumors.
The difference in the degree of chromosomal instability and ITH in the tumors analyzed here can be readily appreciated from Figure 1A-C, Figure 2A-C for cases D4, A3 and A5. The cells in the diploid case D4 deviate very little from their key aberration of an isochromosome 17q, resulting in a very clonal population with low ITH. In contrast, the aneuploid case A5 sports a multitude of small clones all deriving from a highly aberrant major clone resulting in a high degree of heterogeneity. The aneuploid case A3, however, appears to be a hybrid between these two. It might have originated from a diploid cancer with the sole loss of CDH1, and then acquired additional hits after genome duplication. We actually observed one near-tetraploid cell with two copies of CDH1 and two copies of CCND1 (Figures 1C, 2C and 3). Such a genome duplication could be the link between the diploid clone and the triploid clone and therefore could indicate a tetraploid intermediate with consequent chromosomal losses (Giaretti 1994; Kuznetsova, et al. 2015). The possible evolution of the triploid cell population is shown in the FISHtrees analysis (Figure 3). It seems surprising that both clones can coexist in this tumor. Why would the diploid clone with just a simple loss of CDH1 not be outcompeted by a triploid clone with a full spectrum of gains and losses? Similar observations can be made in other cases. D3, e.g., showed a major clone in 77% of the cells with gain of COX2, losses of CDH1 and a loss of chromosome 17 (both HER2 and TP53). However, a minor clone in 8% of the population had a gain of HER2, yet did not have a gain of COX2. This could be interpreted as such that the gain of chromosome arm 1q (containing COX2) might play a more important role in the progression of this tumor compared to copy number increases of HER2 (on chromosome arm 17q). On the other hand, the HER2 gained clone could have developed recently and might therefore not have had sufficient time to outcompete the current major clone. Similarly, 73% of cells in D5 showed only losses of CDH1, while minor clones in 2% of the populations had either an additional loss of TP53 or a gain of MYC. Such a pattern would in principle be beneficial for the growth of breast cancer, however, these clones were either not fitter in the cancer cell population or, did not have the time yet to outcompete the dominant clone. The pattern in D4, on the other hand, suggests that an isochromosome 17q is more advantageous in the population (86%) when compared to just a loss of TP53 (3%). Surprisingly, we observed a signal pattern in four cases indicative of a loss of the entire chromosome 17 (D3, A1, A3, and A4). This leads to the interpretation that the loss of TP53 might be more relevant than the gain of HER2, or could be a reflection of the fact that the loss of a chromosome (i.e., a numerical aberration) is easier to achieve than the creation of an isochromosome (which requires structural changes).
In terms of the overall mutation frequency per case, the differences were less pronounced compared to chromosomal copy number changes. In fact, aneuploid tumors had on average 3.3 mutations, while diploid tumors showed 2.8 mutations per case. One striking distinction, however, is that all aneuploid tumors carried inactivating (frameshift or premature stop codon) mutations of TP53 (see Additional File 3), which were not observed in diploid tumors. In addition to mutations, all aneuploid tumors showed losses of this tumor suppressor, indicating that the development of crude aneuploidy apparently requires the loss of function of TP53 (Table 1).
In summary, increased intratumor heterogeneity measured by miFISH, and the presence of MYC amplification and TP53 mutations are correlated with tumor ploidy and aggressiveness. This could explain the poor prognosis of patients with genomically unstable tumors. We submit that quantitative measurements of ITH by miFISH analysis, detection of MYC amplification, and TP53 mutation analysis could improve treatment stratification in patients with breast cancer.
Supplementary Material
Acknowledgments
This research was supported in part by the Intramural Research Program of the National Institutes of Health, NCI and NLM. JO received a PROMOS scholarship from the German Academic Exchange Service. RM was supported by a Mildred Scheel postdoctoral scholarship of the German Cancer Aid (Deutsche Krebshilfe). ND was supported by a Ph.D. fellowship of the Ad Infinitum Foundation. RS was funded by U.S. National Institutes of Health award 1R21CA216452 and by Pennsylvania Dept. of Health Grant GBMF4554 #4100070287. The Pennsylvania Department of Health specifically disclaims responsibility for any analyses, interpretations or conclusions. The OncoVar libraries were sequenced in the CCR Sequencing Facility in Frederick (Dr. Tran). The authors would like to thank Görel Söderblom and Dr. Roland Sennerstam for the retrieval of archived tissue material and patient data, Dr. Anders Höög for the pathology review of tissue blocks, and Inger Bodin for cutting sections. We also thank Annette Lischka for retrieving and compiling clinical patient data, and Buddy Chen for the preparation of figures.
Abbreviations
- miFISH
multiplex interphase Fluorescence in situ Hybridization
- ITH
intratumor heterogeneity
Footnotes
Submission of Data to Genetics Databases
The sequencing data are available on the BioProject database under ID PRJNA399503.
References
- Aparicio S, Caldas C. The implications of clonal genome evolution for cancer medicine. N Engl J Med. 2013;368(9):842–851. doi: 10.1056/NEJMra1204892. [DOI] [PubMed] [Google Scholar]
- Auer GU, Eriksson E, Azavedo E, Caspersson T, Wallgren A. Prognostic significance of nuclear DNA content in mammary adenocarcinomas in humans. Cancer Res. 1984;44:394–396. [PubMed] [Google Scholar]
- Bettaieb A, Paul C, Plenchette S, Shan J, Chouchane L, Ghiringhelli F. Precision medicine in breast cancer: reality or utopia? J Transl Med. 2017;15(1):139. doi: 10.1186/s12967-017-1239-z. [DOI] [PMC free article] [PubMed] [Google Scholar]
- Boikos SA, Pappo AS, Killian JK, LaQuaglia MP, Weldon CB, George S, Trent JC, von Mehren M, Wright JA, Schiffman JD, Raygada M, Pacak K, Meltzer PS, Miettinen MM, Stratakis C, Janeway KA, Helman LJ. Molecular subtypes of KIT/PDGFRA wild-type gastrointestinal stromal tumors: a report from the National Institutes of Health gastrointestinal stromal tumor clinic. JAMA Oncol. 2016;2(7):922–928. doi: 10.1001/jamaoncol.2016.0256. [DOI] [PMC free article] [PubMed] [Google Scholar]
- Burrell RA, McGranahan N, Bartek J, Swanton C. The causes and consequences of genetic heterogeneity in cancer evolution. Nature. 2013;501(7467):338–345. doi: 10.1038/nature12625. [DOI] [PubMed] [Google Scholar]
- Chowdhury SA, Gertz EM, Wangsa D, Heselmeyer-Haddad K, Ried T, Schaffer AA, Schwartz R. Inferring models of multiscale copy number evolution for single-tumor phylogenetics. Bioinformatics. 2015;31(12):i258–267. doi: 10.1093/bioinformatics/btv233. [DOI] [PMC free article] [PubMed] [Google Scholar]
- Cingolani P, Platts A, Wang le L, Coon M, Nguyen T, Wang L, Land SJ, Lu X, Ruden DM. A program for annotating and predicting the effects of single nucleotide polymorphisms, SnpEff: SNPs in the genome of Drosophila melanogaster strain w1118; iso-2; iso-3. Fly (Austin) 2012;6(2):80–92. doi: 10.4161/fly.19695. [DOI] [PMC free article] [PubMed] [Google Scholar]
- Cornelisse CJ, van de Velde CJ, Caspers RJ, Moolenaar AJ, Hermans J. DNA ploidy and survival in breast cancer patients. Cytometry. 1987;8(2):225–234. doi: 10.1002/cyto.990080217. [DOI] [PubMed] [Google Scholar]
- Duesberg P, Mandrioli D, McCormack A, Nicholson JM. Is carcinogenesis a form of speciation? Cell Cycle. 2011;10(13):2100–2114. doi: 10.4161/cc.10.13.16352. [DOI] [PubMed] [Google Scholar]
- El Saghir NS, Seoud M, Khalil MK, Charafeddine M, Salem ZK, Geara FB, Shamseddine AI. Effects of young age at presentation on survival in breast cancer. BMC Cancer. 2006;6:194. doi: 10.1186/1471-2407-6-194. [DOI] [PMC free article] [PubMed] [Google Scholar]
- Ellsworth RE, Decewicz DJ, Shriver CD, Ellsworth DL. Breast cancer in the personal genomics era. Curr Genomics. 2010;11(3):146–161. doi: 10.2174/138920210791110951. [DOI] [PMC free article] [PubMed] [Google Scholar]
- Fallenius AG, Auer GU, Carstensen JM. Prognostic significance of DNA measurements in 409 consecutive breast cancer patients. Cancer. 1988;62(2):331–341. doi: 10.1002/1097-0142(19880715)62:2<331::aid-cncr2820620218>3.0.co;2-8. [DOI] [PubMed] [Google Scholar]
- Forbes SA, Beare D, Boutselakis H, Bamford S, Bindal N, Tate J, Cole CG, Ward S, Dawson E, Ponting L, Stefancsik R, Harsha B, Kok CY, Jia M, Jubb H, Sondka Z, Thompson S, De T, Campbell PJ. COSMIC: somatic cancer genetics at high-resolution. Nucleic Acids Res. 2017;45(D1):D777–D783. doi: 10.1093/nar/gkw1121. [DOI] [PMC free article] [PubMed] [Google Scholar]
- Gertz EM, Chowdhury SA, Lee WJ, Wangsa D, Heselmeyer-Haddad K, Ried T, Schwartz R, Schaffer AA. FISHtrees 3.0: tumor phylogenetics using a ploidy probe. PLoS One. 2016;11(6):e0158569. doi: 10.1371/journal.pone.0158569. [DOI] [PMC free article] [PubMed] [Google Scholar]
- Giaretti W. A model of DNA aneuploidization and evolution in colorectal cancer. Lab Invest. 1994;71(6):904–910. [PubMed] [Google Scholar]
- Habermann JK, Doering J, Hautaniemi S, Roblick UJ, Bundgen NK, Nicorici D, Kronenwett U, Rathnagiriswaran S, Mettu RK, Ma Y, Kruger S, Bruch HP, Auer G, Guo NL, Ried T. The gene expression signature of genomic instability in breast cancer is an independent predictor of clinical outcome. Int J Cancer. 2009;124(7):1552–1564. doi: 10.1002/ijc.24017. [DOI] [PMC free article] [PubMed] [Google Scholar]
- Harris LN, Ismaila N, McShane LM, Andre F, Collyar DE, Gonzalez-Angulo AM, Hammond EH, Kuderer NM, Liu MC, Mennel RG, Van Poznak C, Bast RC, Hayes DF, American Society of Clinical O Use of biomarkers to guide decisions on adjuvant systemic therapy for women with early-stage invasive breast cancer: American Society of Clinical Oncology Clinical Practice Guideline. J Clin Oncol. 2016;34(10):1134–1150. doi: 10.1200/JCO.2015.65.2289. [DOI] [PMC free article] [PubMed] [Google Scholar]
- Heselmeyer-Haddad K, Berroa Garcia LY, Bradley A, Ortiz-Melendez C, Lee WJ, Christensen R, Prindiville SA, Calzone KA, Soballe PW, Hu Y, Chowdhury SA, Schwartz R, Schäffer AA, Ried T. Single-cell genetic analysis of ductal carcinoma in situ and invasive breast cancer reveals enormous tumor heterogeneity yet conserved genomic imbalances and gain of MYC during progression. Am J Pathol. 2012;181(5):1807–1822. doi: 10.1016/j.ajpath.2012.07.012. [DOI] [PMC free article] [PubMed] [Google Scholar]
- Howlader N, Noone AM, Krapcho M, Miller D, Bishop K, Kosary CL, Yu M, Ruhl J, Tatalovich Z, Mariotto A, Lewis DR, Chen HS, Feuer EJ, C KA, editors. SEER Cancer Statistics Review. National Cancer Institute; Bethesda, MD: 1975-2014. based on November 2016 SEER data submission, posted to the SEER web site, April 2017. [Google Scholar]
- Kallioniemi A, Kallioniemi OP, Piper J, Tanner M, Stokke T, Chen L, Smith HS, Pinkel D, Gray JW, Waldman FM. Detection and mapping of amplified DNA sequences in breast cancer by comparative genomic hybridization. Proc Natl Acad Sci U S A. 1994;91(6):2156–2160. doi: 10.1073/pnas.91.6.2156. [DOI] [PMC free article] [PubMed] [Google Scholar]
- Killian JK, Miettinen M, Walker RL, Wang Y, Zhu YJ, Waterfall JJ, Noyes N, Retnakumar P, Yang Z, Smith WI, Jr, Killian MS, Lau CC, Pineda M, Walling J, Stevenson H, Smith C, Wang Z, Lasota J, Kim SY, Boikos SA, Helman LJ, Meltzer PS. Recurrent epimutation of SDHC in gastrointestinal stromal tumors. Sci Transl Med. 2014;6(268):268ra177. doi: 10.1126/scitranslmed.3009961. [DOI] [PMC free article] [PubMed] [Google Scholar]
- Kronenwett U, Huwendiek S, Ostring C, Portwood N, Roblick UJ, Pawitan Y, Alaiya A, Sennerstam R, Zetterberg A, Auer G. Improved grading of breast adenocarcinomas based on genomic instability. Cancer Res. 2004;64(3):904–909. doi: 10.1158/0008-5472.can-03-2451. [DOI] [PubMed] [Google Scholar]
- Kuznetsova AY, Seget K, Moeller GK, de Pagter MS, de Roos JA, Durrbaum M, Kuffer C, Muller S, Zaman GJ, Kloosterman WP, Storchova Z. Chromosomal instability, tolerance of mitotic errors and multidrug resistance are promoted by tetraploidization in human cells. Cell Cycle. 2015;14(17):2810–2820. doi: 10.1080/15384101.2015.1068482. [DOI] [PMC free article] [PubMed] [Google Scholar]
- Kwa M, Makris A, Esteva FJ. Clinical utility of gene-expression signatures in early stage breast cancer. Nat Rev Clin Oncol. 2017 doi: 10.1038/nrclinonc.2017.74. [DOI] [PubMed] [Google Scholar]
- Li H, Durbin R. Fast and accurate short read alignment with Burrows-Wheeler transform. Bioinformatics. 2009;25(14):1754–1760. doi: 10.1093/bioinformatics/btp324. [DOI] [PMC free article] [PubMed] [Google Scholar]
- Liu X, Jian X, Boerwinkle E. dbNSFP: a lightweight database of human nonsynonymous SNPs and their functional predictions. Hum Mutat. 2011;32(8):894–899. doi: 10.1002/humu.21517. [DOI] [PMC free article] [PubMed] [Google Scholar]
- Liu X, Jian X, Boerwinkle E. dbNSFP v2.0: a database of human non-synonymous SNVs and their functional predictions and annotations. Hum Mutat. 2013;34(9):E2393–2402. doi: 10.1002/humu.22376. [DOI] [PMC free article] [PubMed] [Google Scholar]
- Marusyk A, Almendro V, Polyak K. Intra-tumour heterogeneity: a looking glass for cancer? Nat Rev Cancer. 2012;12(5):323–334. doi: 10.1038/nrc3261. [DOI] [PubMed] [Google Scholar]
- McGranahan N, Swanton C. Biological and therapeutic impact of intratumor heterogeneity in cancer evolution. Cancer Cell. 2015;27(1):15–26. doi: 10.1016/j.ccell.2014.12.001. [DOI] [PubMed] [Google Scholar]
- Mertens F, Johansson B, Mitelman F. Isochromosomes in neoplasia. Genes Chromosomes Cancer. 1994;10(4):221–230. doi: 10.1002/gcc.2870100402. [DOI] [PubMed] [Google Scholar]
- Paik S, Shak S, Tang G, Kim C, Baker J, Cronin M, Baehner FL, Walker MG, Watson D, Park T, Hiller W, Fisher ER, Wickerham DL, Bryant J, Wolmark N. A multigene assay to predict recurrence of tamoxifen-treated, node-negative breast cancer. N Engl J Med. 2004;351(27):2817–2826. doi: 10.1056/NEJMoa041588. [DOI] [PubMed] [Google Scholar]
- Ried T, Just KE, Holtgreve-Grez H, du Manoir S, Speicher MR, Schröck E, Latham C, Blegen H, Zetterberg A, Cremer T, Auer G. Comparative genomic hybridization of formalin-fixed, paraffin-embedded breast tumors reveals different patterns of chromosomal gains and losses in fibroadenomas and diploid and aneuploid carcinomas. Cancer Res. 1995;55(22):5415–5423. [PubMed] [Google Scholar]
- Senkus E, Kyriakides S, Ohno S, Penault-Llorca F, Poortmans P, Rutgers E, Zackrisson S, Cardoso F, Committee EG. Primary breast cancer: ESMO Clinical Practice Guidelines for diagnosis, treatment and follow-up. Ann Oncol. 2015;26(Suppl 5):v8–30. [Google Scholar]
- Sherry ST, Ward MH, Kholodov M, Baker J, Phan L, Smigielski EM, Sirotkin K. dbSNP: the NCBI database of genetic variation. Nucleic Acids Res. 2001;29(1):308–311. doi: 10.1093/nar/29.1.308. [DOI] [PMC free article] [PubMed] [Google Scholar]
- Soerjomataram I, Louwman MW, Ribot JG, Roukema JA, Coebergh JW. An overview of prognostic factors for long-term survivors of breast cancer. Breast Cancer Res Treat. 2008;107(3):309–330. doi: 10.1007/s10549-007-9556-1. [DOI] [PMC free article] [PubMed] [Google Scholar]
- Torre LA, Bray F, Siegel RL, Ferlay J, Lortet-Tieulent J, Jemal A. Global cancer statistics, 2012. CA Cancer J Clin. 2015;65(2):87–108. doi: 10.3322/caac.21262. [DOI] [PubMed] [Google Scholar]
- van ‘t Veer LJ, Dai H, van de Vijver MJ, He YD, Hart AA, Mao M, Peterse HL, van der Kooy K, Marton MJ, Witteveen AT, Schreiber GJ, Kerkhoven RM, Roberts C, Linsley PS, Bernards R, Friend SH. Gene expression profiling predicts clinical outcome of breast cancer. Nature. 2002;415(6871):530–536. doi: 10.1038/415530a. [DOI] [PubMed] [Google Scholar]
Associated Data
This section collects any data citations, data availability statements, or supplementary materials included in this article.