

Abstract
Brain maturation through adolescence has been the topic of recent studies. Previous works have evaluated changes in morphometry and also changes in functional connectivity. However, most resting‐state fMRI studies have focused on static connectivity. Here we examine the relationship between age/maturity and the dynamics of brain functional connectivity. Utilizing a resting fMRI dataset comprised 421 subjects ages 3–22 from the PING study, we first performed group ICA to extract independent components and their time courses. Next, dynamic functional network connectivity (dFNC) was calculated via a sliding window followed by clustering of connectivity patterns into 5 states. Finally, we evaluated the relationship between age and the amount of time each participant spent in each state as well as the transitions among different states. Results showed that older participants tend to spend more time in states which reflect overall stronger connectivity patterns throughout the brain. In addition, the relationship between age and state transition is symmetric. This can mean individuals change functional connectivity through time within a specific set of states. On the whole, results indicated that dynamic functional connectivity is an important factor to consider when examining brain development across childhood.
1. INTRODUCTION
It is well‐established that even during rest the spatiotemporal organization of the brain reveals information about different functional domains, such as motor function (Biswal, Yetkin, Haughton, & Hyde, 1995). Brain structure also undergoes structural change through maturation with the neonate brain being a quarter the size of an adult brain. While the size of the brain grows rapidly reaching 85% of the weight of an adult brain by age three additional structural changes occur throughout childhood. For example, (Giedd, 2008) found that cortical gray matter (e.g., thickness) peaks in children and generally decreases throughout adolescence. On the other hand, it was shown that children have less myelination compared to adults (Klingberg, Vaidya, Gabrieli, Moseley, & Hedehus, 1999). An important question then, is how functional brain networks/domains change during maturation. Answering this question is increasingly important, as many mental illnesses are now understood to be neurodevelopmental disorders in the sense that the root of the disease process begins in childhood. Recent studies have focused primarily on altered static functional connectivity in patients with psychiatric disorders, and have identified significant changes. A recent study performed one of the first whole brain dynamic connectivity analyses in a group of subjects diagnosed with autism and identified changes in multiple control networks (de Lacy, Doherty, King, Rachakonda, & Calhoun, 2017). Supekar et al. (2013) linked brain hyper connectivity to Autism spectrum disorder although other studies have reported reduced functional connectivity in autism (Just, Cherkassky, Keller, & Minshew, 2004). For a recent review, please see Hull, Jacokes, Torgerson, Irimia, and Van Horn (2016).
Over the past decade, several studies have examined the development of brain networks during both task and resting states (for a recent review, see Stevens, 2016). Two main themes emerged from these findings. First, many papers have reported that during maturation short range networks get weaker, while long range networks get stronger. In other words, brain circuitry moves from segregation to integration (Allen et al., 2011; Dosenbach et al., 2010; Fair et al., 2008; Lopez‐Larson, Anderson, Ferguson, & Yurgelun‐Todd, 2011). It has been reported that while short range networks are dominant in infants (Damaraju et al., 2010; Gao et al., 2011), short‐range networks tend to weaken while long range networks strengthen as individuals move toward adulthood (Kelly et al., 2009; Supekar, Musen, & Menon, 2009). Second, many studies have examined the weakening or strengthening of specific networks. For example, Anderson, Ferguson, Lopez‐Larson, and Yurgelun‐Todd (2011) studied interactions between default mode and attention control networks and found decreasing correlation between these two networks with age. In another study functional connectivity between the ventral tegmental area with limbic regions and default mode network was found to be stronger in older subjects (Tomasi & Volkow, 2014). Farrant et al. reported that children show greater connectivity between ventral frontal cortex and salience network when compared to adults (Farrant & Uddin, 2015). In addition to studies that identified a general trend between two networks, some studies have determined that different regions of a network experience different changes with age, for example, Yang et al. showed that precuneus‐dorsal posterior cingulate cortex shows a stronger relationship with age compared to default mode network (Yang et al., 2014). Apart from these two themes, some papers have recently studied changes in the hierarchical modular structure of networks through adolescence. Fransson, Aden, Blennow, and Lagercrantz (2011) showed that cortical hubs and their respective networks are mostly seen in primary sensory and motor areas in infants. In another study, it was found that while the functional hubs are mostly stable from late childhood to early adulthood links between these hubs continue to develop (Hwang, Hallquist, & Luna, 2013). Modularity has been defined as “the extent to which a network can be decomposed into internally integrated, yet globally segregated communities” (Betzel et al., 2014).
One shortcoming of studies examining maturation of brain networks is that most of them have utilized only static connectivity measures with fMRI over a 5–10 min rest scan. However, multiple studies have demonstrated that various aspects of connectivity between different parts of the brain can change within a single scanning session (Calhoun, Miller, Pearlson, & Adali, 2014; Chang & Glover, 2010; Hutchison, Womelsdorf, Gati, Everling, & Menon, 2013b; Preti, Bolton, Van, & Ville, 2016; Sakoglu et al., 2010). Various studies have now shown that time‐varying estimated within short scan sessions is highly replicable (Abrol et al., 2017) and also predictive of individual subject brain disorders (Rashid et al., 2016; Vergara, Mayer, Damaraju, & Calhoun, 2017). Of the studies that have used dynamic connectivity to examine brain maturation, one (Qin et al., 2015) showed that an individual's chronological age can be predicted accurately using brain dynamics variability. In another study, a dynamic connectivity measure was defined and it was shown that this measure is more stable for older subjects (Sato et al., 2015) within cognitive control and default‐mode networks. Similar to this study, Hutchison and Morton (2015) also examined the dynamics of the brain through development, but their number of subjects was low (N = 51) compared to our study.
Brain development itself is a highly dynamic process that impacts different parts of the cortex across development, with sensory cortices developing first, followed by posterior association regions, and finally by frontal cognitive control regions. Although multiple studies have examined subjects in the older age range, for example, 85 years old (Zuo et al., 2010), there have been fewer studies of the younger age range, and very few studies have included participants younger than 7 years old (Song, Zhu, Li, Wang, & Liu, 2015; Supekar et al., 2009). By including younger participants, the effect of age on brain circuitry can be examined more thoroughly, especially in regard to the early developmental trajectory. To our knowledge, only one functional connectivity study has included participants as young as 4 years of age; however, the total number of participants was relatively low (N = 58) in that study (Gabard‐Durnam et al., 2014).
To address the aforementioned limitations of previous studies, in this study, we use data from the large Pediatric Imaging, Neurocognition and Genetics (PING) cohort, which included a broad age range of participants (3–21 years) who were imaged using resting state fMRI (rsfMRI). The data were decomposed into maximally independent components using group independent component analysis (GICA; (Calhoun & Adali, 2012; Calhoun, Adali, Pearlson, & Pekar, 2001)). A subset of components were then selected and grouped into functional domains. After calculating dynamic functional network connectivity (dFNC) in the form of time varying correlation matrices, k‐means clustering was used to extract patterns of connectivity that were present to differing degrees across individuals and ages.
2. METHODS
2.1. Subjects and preprocessing
The data used for this study were part of the Pediatric Imaging, Neurocognition, and Genetics (PING) dataset (http://ping.chd.ucsd.edu). All experimental procedures were approved by human research protections programs and institutional review boards of all universities involved in this project, and all participants or their legal guardian gave informed consent. Participants were screened for any medical conditions that may have impacted development such as major developmental, psychiatric, or neurological disorders and/or brain injury. Participants were told not to close their eyes throughout the scanning session. For this specific study, only participants with complete rsfMRI scans were used. This resulted in 421 participants between 3 and 21 years old (mean = 13.9, SD = 5.0, 216 male). For more detailed information about data acquisition in the PING study, see Jernigan et al. (2016). Because of the multisite nature of the study, data were collected using several different scanning protocols. TRs were one of 2, 2.5, or 3 s. This resulted in different scan lengths (390 or 600 s). To account for these variable parameters in this study, all data were resampled to the shortest TR and then time series were cropped to the minimum scan length (minimum scan length after resampling).
The preprocessing used here was part of a pipeline developed at the Mind Research Network (MRN), which uses the SPM software as follows. First, to allow the signal to reach a stable state, the first 4 volumes were discarded. Then, the images were realigned using an approach which minimizes bias towards global brain activity (Freire, Roche, & Mangin, 2002) and slice timing correction was performed using the middle slice as the reference. Using a nonlinear registration, EPI data were spatially normalized to Montreal Neurological Institute space and interpolated to a voxel size of 3 mm × 3 mm × 3 mm (an approach which has been shown to work better than a linear coregistration to the T1 image followed by nonlinear T1 normalization (Calhoun et al., 2017)). Visual inspection of the images showed good registration with the template. Spatial smoothing was then performed with a Gaussian kernel (FWHM = 10 mm). Finally, data were intensity normalized to have a voxel wise mean of 100. This step has been shown to improve the test–retest reliability of GICA (Allen, Erhardt, Eichele, Mayer, & Calhoun, 2010).
2.2. Group ICA analysis
Spatially independent sources in the form of component maps with their respective time series were extracted from the data using the group ICA method implemented in the GIFT toolbox (http://mialab.mrn.org/software/gift). Group ICA is a data driven method that can be used to achieve a data driven parcellation of brain activation. The pipeline used here is based on the one employed by (Allen et al., 2014) which decomposed data into 100 components. First, preprocessed data for each subject were passed through PCA for subject specific dimension reduction; retaining 120 principle components for each subject (following an earlier recommendation that the first level model order should be greater than the second level model order; Erhardt et al., 2011). Next, subject data were appended along the time dimension and this single matrix was passed through another PCA for group level dimension reduction; for this step, 100 components were retained. After that, ICA was run using the infomax algorithm. The ICA algorithm was run 10 times, clustered via ICASSO (http://research.ics.aalto.fi/ica/icasso/) and the most central solution was utilized to ensure stability. Using the GIG‐ICA back‐reconstruction approach (Du et al., 2016, 2015), subject specific spatial maps and time courses were extracted (Erhardt et al., 2011). After visually checking all 100 components, those with a peak in white matter, ventricles, brain stem, or cerebellum, or those with a spatial map and time course dominated by high frequency fluctuations (likely due to motion or physiologic effects), were removed. After this step, 48 components remained and were utilized for further analysis. The 48 components were then visually grouped into 8 functional domains based on the literature (Allen et al., 2014).
Subjects used for this study have different TRs and number of volumes; therefore, prior to postprocessing, the component time courses were resampled temporally to the shortest TR (2 s) and cropped to the shortest volume number (shortest after resampling). To further reduce the impact of different artifacts on the data, all components were passed through despiking, detrending (linear, cubic, and quadratic), regression (to regress out motion using the 12 estimated motion parameters and their temporal derivatives (Allen et al., 2011)), and low pass filtered (0.15 Hz). For despiking, the 3dDespike algorithm implemented in AFNI was used. This algorithm replaces outliers in components time courses with a third‐order spline fit.
Next, a sliding window approach was used to calculate dFNC as implemented in GIFT (Allen et al., 2014). A window size of 30 TRs (60 s) was used to follow the recommendation that, to effectively capture dynamic information, a window length between 30 and 60 s should be used (Damaraju et al., 2014; Hutchison et al., 2013a). A tapered window was created by convolving a Gaussian (σ = 3) with a rectangular function. For each window, a full correlation matrix was calculated. The graphical LASSO method was then used to regularize the covariance matrices; it has been shown that this method can reduce the effect of noise caused by the low number of timepoints (Friedman, Hastie, & Tibshirani, 2008). This resulted in data dimensions of 155 (number of sliding windows) × 1128; due to the symmetric nature of correlation matrices, only half of off‐diagonal elements are unique for each matrix (i.e., 48 × (48 − 1)/2 = 1128 unique elements).
To examine the reoccurring FC patterns, k‐means clustering (using the Manhattan distance metric) was used on the time‐varying covariance matrices to cluster into 5 states. The number of clusters was chosen based on the elbow criterion of the cluster validity index (calculated by dividing within cluster distance by between cluster distances). As mentioned previously, we had 1128 features for each data set. Dwell time was defined as the average number of timepoints each subject remained in each state once entering that state. Transition matrix was defined as the number of times a subject transitioned from one state to another. This resulted in an asymmetric 5 × 5 matrix for each subject.
Subjects with a framewise displacement above 3 mm for more than 10% of their total volume numbers were omitted from further analysis. In addition, subjects diagnosed with attention‐deficit/hyperactivity disorder (ADHD) or learning impairments based on the questionnaires completed by the parents (for minors), or the participants themselves (>18 years old), were removed. This resulted in 389 participants being included in all post processing analysis. As we have used GIG‐ICA for back reconstruction, the impact of omitted subjects has very little effect on the ICA results (Du & Fan, 2013).
For dynamic connectivity, partial correlations were used between age and both dwell time and each element of transition matrix, separately. We controlled for motion, sex, and scanning site in all these correlations. To account for multiple comparisons, both analyses were FDR corrected at p < .01.
3. RESULTS
As mentioned previously, group ICA was used to extract maximally independent components of resting brain activity. The 48 nonartefactual components were first selected from the group data and dynamic connectivity matrices were calculated for each subject separately using a sliding tapered window approach. Using k‐means clustering, the dynamic connectivity matrices were clustered into 5 states. Then partial correlations were calculated between age and both state dwell time and the state transition matrix.
No difference was found between mean age of male and female subjects (p = .23). But a significant difference was found between mean framewise displacement between males and females (p = .046), with males moving more than females.
Figure 1 depicts all 48 components grouped into 8 domains of interest: auditory (AUD), cognitive control (CC), default mode (DM), limbic (LIM), salience (SAL), subcortical (SC), somatomotor (SM), and visual (VIS). These network groupings were identified manually based on previous work (Allen et al., 2014).
Figure 1.
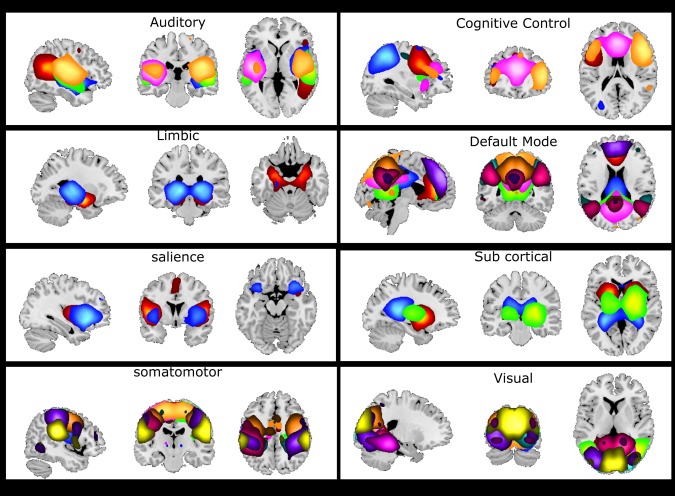
Functional domain spatial maps. Forty‐eight selected components were visually inspected and grouped into 8 functional domains based on the literature. Some of these components span across several functional domains. These components were assigned to the most prominent domain. Each component is shown with a specific color in each domain [Color figure can be viewed at http://wileyonlinelibrary.com]
Following network groupings, dFNC was clustered into 5 states and then the average amount of time each subject remained in each state was calculated (i.e., dwell time). Each state can be represented by its centroids as seen in Figure 2 (intradomain connectivity) and Figure 3 (inter‐domain connectivity). In both figures, only component pairs with absolute correlation above 0.6 are shown (for simplicity). For comparison purposes, static connectivity is shown at the same threshold in Figure 4. As can be seen in Figures 2, 3, 4, no negative correlation was stronger than −0.6. It is typical for connectivity matrices to have stronger positive elements compared to negative ones. This pattern has been reported in prior studies (Allen et al., 2014; Hutchison & Morton, 2015).
Figure 2.
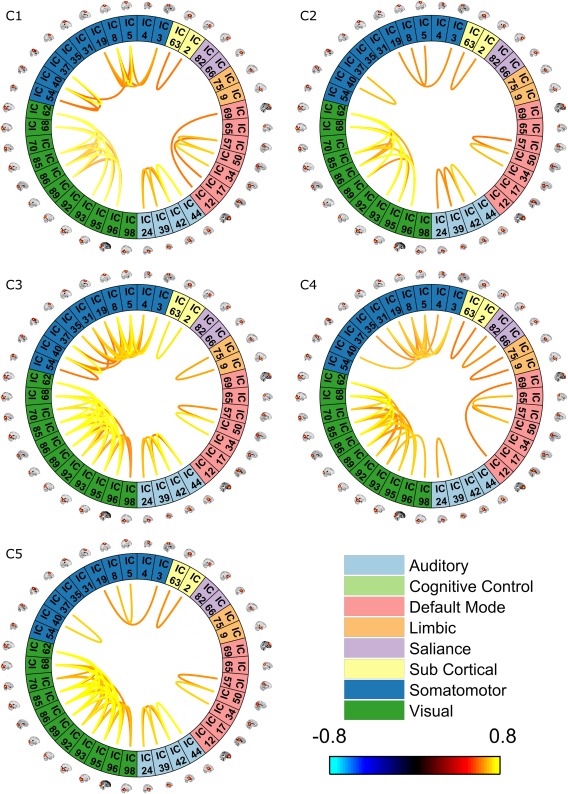
Intradomain cluster centroids. Clustering dynamic connectivity for all participants resulted in 5 clusters and their representive matrix. These matrices were then thresholded (0.6). Only intradomain correlations are shown [Color figure can be viewed at http://wileyonlinelibrary.com]
Figure 3.
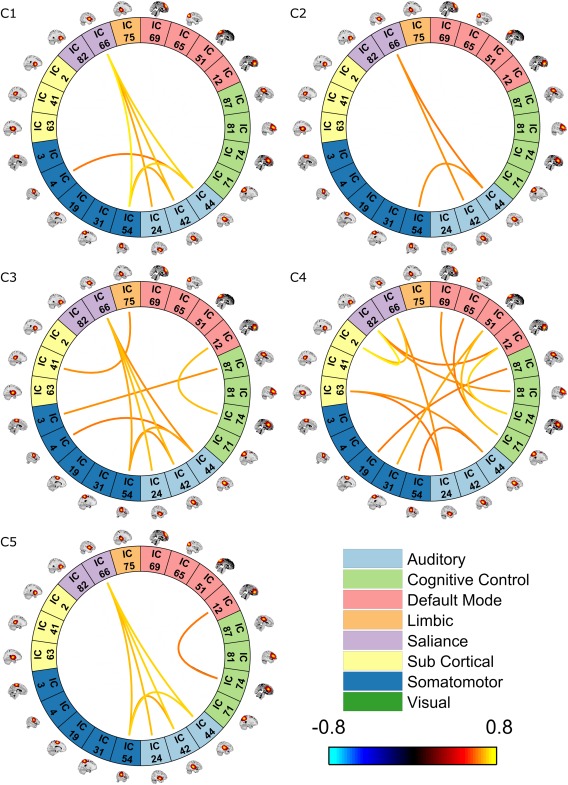
Interdomain cluster centroids. Clustering dynamic connectivity for all participants resulted in 5 clusters and their representive matrix. These matrices were then thresholded (0.6). Only interdomain correlations are shown [Color figure can be viewed at http://wileyonlinelibrary.com]
Figure 4.
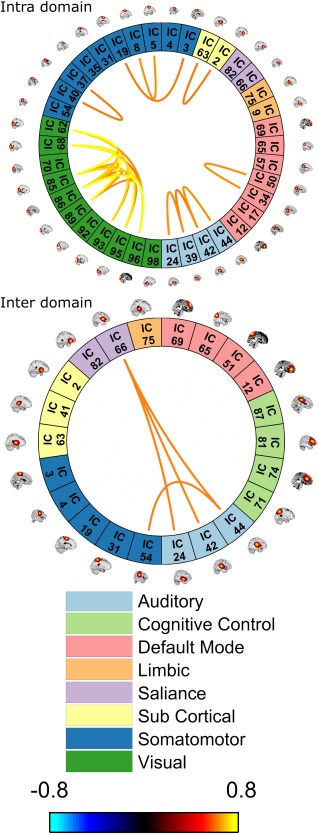
Static functional connectivity. For comparison with dynamic connectivity, the static connectivity matrix was thresholded at 0.6 (the same as that used for dynamic connectivity clusters). The intradomain connectivities are shown at the top, with the interdomain connectivities below [Color figure can be viewed at http://wileyonlinelibrary.com]
Results depicting the correlation of dwell time with age are shown in Figure 5. The correlation is significant for all states except state 5 after correcting for multiple comparisons (FDR corrected p < .01). As can be seen, there was a significant negative correlation between age and dwell time in states 2 and 4, meaning that older participants spend less time in these two states than younger participants. As there was intradomain connectivity for visual areas present in all states, we refrain from mentioning this for each state individually. State 2 had weaker connectivity between all 48 components overall compared to the other states. In other words, both inter‐ and intradomain connectivity between different networks was the weakest in this state compared to all other states. Moreover, dynamic interdomain connectivity in state 2 was very similar to static connectivity (Figure 4). In state 4, there was strong intradomain connectivity in the salience domain in addition to significant connectivity between the salience domain and each of the three sub cortical, default mode and cognitive control domains. The connection between cognitive control and default mode network were also stronger and more complex in this state compared to all other states. Finally, it is interesting to note that all states had almost all of the links present in state 2 except state 4 (including both inter‐ and intradomain connections).
Figure 5.
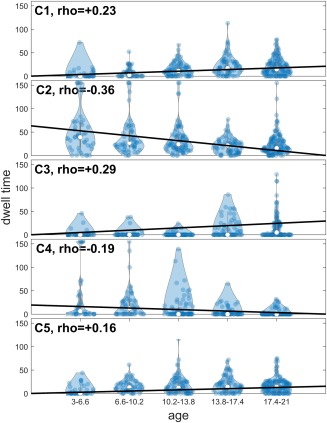
The partial correlation between age and mean dwell time for each state. Correlation between age and mean dwell time was calculated while controlling for mean framewise displacement, gender, and scanning site. The age bins are only for demonstration and had no impact on the analysis [Color figure can be viewed at http://wileyonlinelibrary.com]
There was a significant positive correlation between age and the dwell time of states 1 and 3. Basically, older participants tended to stay in these states more than younger participants. State 3 had the most complex intradomain connectivity compared to all other states, as the somatomotor domain was almost completely intra‐connected in this state. Similar to State 4, this state had a connection to the limbic domain (which is absent from the other 3 states). State 3 also had a complex inter‐domain connectivity, although it was slightly less complex than state 4. Last, there was a strong connection between sub cortical and limbic domain, which was exclusive to this state, and a link between the somatomotor and cognitive control domains. Compared to all other states, state 1 had the most intraconnected default mode domain. This state was very similar to state 2 when looking at interdomain links (although the links are stronger in this state compared to state 2), and interestingly all of its interdomain links were present in states 3 and 5, suggesting a core of auditory, somatomotor, and salience networks were preserved amidst the dynamical reconfiguration of the interdomain connections. No negative correlation was strong enough to pass the threshold.
Last, results showed that 6 correlations between age and the state transition matrix were significant after correcting for multiple comparisons (FDR corrected p < .01). Participant's age was negatively correlated with state transition between states 4–2 and 2–4, which indicted that older participants changed from state 2 to 4 and 4 to 2 less than younger participants. In contrast, age was correlated positively with state transition from state 1 to 3, 3 to 1, 5 to 1, and 2 to 3. It is also interesting that the correlation between age and state transition resulted in an almost symmetric matrix (Figure 6). That is, the relationship between age and number of transitions from state a to b resembles the relationship between age and number of transition from state b to a.
Figure 6.
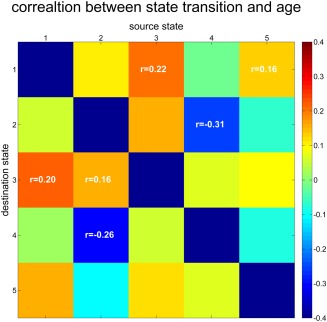
Correlation between age and state transition. The number of state transitions was calculated for each state pair and then correlated with age controlling for gender, mean framewise displacement, and scanning site. Results were corrected for multiple comparison with FDR (p = .01) and only significant correlations are displayed in this figure [Color figure can be viewed at http://wileyonlinelibrary.com]
4. DISCUSSION
As mentioned in the introduction, there has been a considerable amount of research studying the effect of maturation on brain connectivity. Many studies have been performed based on the assumption that brain connectivity is static, with only a few studies having explored the dynamics of brain connectivity and these studies generally had a small number of participants compared to today's standards. In this study, we used a relatively large number of participants with a broad age range across childhood, adolescence, and early adulthood, combined with a data‐driven ICA approach, and examined the effect of age on time‐varying brain connectivity in novel ways.
Many of our findings are in line with the previous literature in this field. As found in several studies using the same method (Allen et al., 2014; Hutchison & Morton, 2015), there was a state that closely resembled the mean functional connectivity (FC; i.e., static connectivity). Interestingly, this average (or canonical) state's dwell time shows a strong negative correlation with age, meaning that older participants (young adults) remain in this state less than young children. Although we were able to find this relatively strong age effect on state 2 dwell times, Hutchison and Morton (2015) did not show this effect. Our results suggest that through maturation the differences between participants tended to increase and depart more and more from a canonical connectivity pattern (i.e., as subjects get older the variability in their networks increase; Vakorin, Lippe, & McIntosh, 2011). This may be directly related to the effect of environmental influences that are known to impact long‐term outcomes, including differences in socioeconomic status, trauma, and social factors. It is also important to note that some neurodevelopmental disorders may emerge in adolescence because of variability induced by environmental influences.
Interestingly, there were several links both between and within domains that were present in almost all states but with different strengths. This can be interpreted in two ways. First, we can conclude that network organization in humans does not include only static or only dynamic connections. It is a combination of both these at the same time. In addition, we can conclude that organization of human connectivity patterns do not change drastically through development, but that the integration of these networks shifts across the age spectrum. This view is in line with what is reported in Marek, Hwang, Foran, Hallquist, and Luna (2015).
We also found that age was negatively correlated with the dwell time of states that show strong connectivity between cognitive control and default mode domains (Hutchison & Morton, 2015). This connection might suggest a more effortful link between the default mode network and some of the nondefault cognitive control networks. However, this speculation needs further confirmation.
Additionally, older participants remained in the more intra connected default mode domain longer than younger participants (State 1). Similar to our results, Fair et al. (2008) reported that older participants tended to have a more intra‐connected default mode network. In our study, the default mode links that appeared only in state 1 were a lot like the network identified by Supekar et al. (2010), which was stronger in young adults.
As mentioned previously, correlation between age and state transition number resulted in an almost symmetric matrix. Essentially subjects transition between a pair of states equally. Basically, the number of times a participant leaves State a for State b is very similar to the times he/she goes back to State b from State a. The actual correlation value between age and transition number is likely caused by the relationship between number of occurrences of those states and participant age.
Last, we found that older participants remain longer in states which have a very strong connection in the somatomotor domain. This is in line with what has been reported previously (Zuo et al., 2010), and may reflect continued maturation of this system as participants acquire more motor‐based skills with increasing age.
5. LIMITATIONS
Perhaps the biggest limitation when studying maturation using fMRI is that motion is highly correlated with age (Power, Barnes, Snyder, Schlaggar, & Petersen, 2012). Although we have tried to reduce the impact of motion on our results, first by omitting subjects with excessive motion, and then by utilizing both first and second‐level strategies for controlling motion correction, the impact of motion on our results cannot be completely ruled out. Another limitation is that a cross sectional study (like this study) does not provide the same information as a longitudinal one. We are planning future analyses to follow‐up these results with longitudinal data. In addition to the mentioned limitations, we have used a single MNI atlas in our preprocessing to spatially normalize all subjects to a common space. This atlas is not recommended for very young children (i.e., 3 years old), but because using multiple atlases for normalization within a single study would introduce artificial age‐related difference we used the MNI atlas for normalization of all subjects and manually checked to ensure the normalization results were of high quality.
6. CONCLUSION
These results provide evidence of age‐related effects primarily impacting the strength of the connections, instead of the organization of connections. From our results, we conclude that older participants (young adults) tend to transition between states, which are different from the states the young children operate between. In sum, we demonstrated that maturation impacts the time varying aspect of functional connectivity, consistent with prior results determining age effects on static connectivity patterns. Most importantly, our results suggest that analyzing brain connectivity assuming only static or dynamic connectivity conveys only part of the picture, and thus methods are needed to extract both types of networks simultaneously.
ACKNOWLEDGMENTS
This work was funded in part by National Institute of Health grants P20GM103472/5P20RR021938, R01EB005846, 1R01DA040487 and RC2DA029475 and the National Science Foundation grants 1539067 and 1631819. PING is funded by the National Institute on Drug Abuse and the Eunice Kennedy Shriver National Institute of Child Health & Human Development. PING data are disseminated by the PING Coordinating Center at the Center for Human Development, University of California, San Diego.
Faghiri A, Stephen JM, Wang Y‐P, Wilson TW, Calhoun VD. Changing brain connectivity dynamics: From early childhood to adulthood. Hum Brain Mapp. 2018;39:1108–1117. 10.1002/hbm.23896
Funding information National Institute of Health, Grant/Award Numbers: P20GM103472/5P20RR021938, R01EB005846, 1R01DA040487, and RC2DA029475; National Science Foundation, Grant/Award Numbers: 1539067 and 1631819; National Institute on Drug Abuse; Eunice Kennedy Shriver National Institute of Child Health & Human Development
REFERENCES
- Abrol, A. , Damaraju, E. , Miller, R. L. , Stephen, J. M. , Claus, E. D. , Mayer, A. R. , & Calhoun, V. D. (2017). Replicability of time‐varying connectivity patterns in large resting state fMRI samples. NeuroImage, 163, 160–176. [DOI] [PMC free article] [PubMed] [Google Scholar]
- Allen, E. , Erhardt, E. , Eichele, T. , Mayer, A. , & Calhoun, V. (2010). Comparison of pre‐normalization methods on the accuracy and reliability of group ICA results.
- Allen, E. A. , Damaraju, E. , Plis, S. M. , Erhardt, E. B. , Eichele, T. , & Calhoun, V. D. (2014). Tracking whole‐brain connectivity dynamics in the resting state. Cerebral Cortex, 24, 663–676. [DOI] [PMC free article] [PubMed] [Google Scholar]
- Allen, E. A. , Erhardt, E. B. , Damaraju, E. , Gruner, W. , Segall, J. M. , Silva, R. F. , … Calhoun, V. D. (2011). A baseline for the multivariate comparison of resting‐state networks. Frontiers in Systems Neuroscience, 5, 2. [DOI] [PMC free article] [PubMed] [Google Scholar]
- Anderson, J. S. , Ferguson, M. A. , Lopez‐Larson, M. , & Yurgelun‐Todd, D. (2011). Connectivity gradients between the default mode and attention control networks. Brain Connectivity, 1, 147–157. [DOI] [PMC free article] [PubMed] [Google Scholar]
- Betzel, R. F. , Byrge, L. , He, Y. , Goni, J. , Zuo, X. N. , & Sporns, O. (2014). Changes in structural and functional connectivity among resting‐state networks across the human lifespan. NeuroImage, 102 Pt 2, 345–357. [DOI] [PubMed] [Google Scholar]
- Biswal, B. , Yetkin, F. Z. , Haughton, V. M. , & Hyde, J. S. (1995). Functional connectivity in the motor cortex of resting human brain using echo‐planar MRI. Magnetic Resonance in Medicine, 34, 537–541. [DOI] [PubMed] [Google Scholar]
- Calhoun, V. D. , & Adali, T. (2012). Multisubject independent component analysis of fMRI: A decade of intrinsic networks, default mode, and neurodiagnostic discovery. IEEE Reviews in Biomedical Engineering, 5, 60–73. [DOI] [PMC free article] [PubMed] [Google Scholar]
- Calhoun, V. D. , Adali, T. , Pearlson, G. D. , & Pekar, J. J. (2001). A method for making group inferences from functional MRI data using independent component analysis. Human Brain Mapping, 14, 140–151. [DOI] [PMC free article] [PubMed] [Google Scholar]
- Calhoun, V. D. , Miller, R. , Pearlson, G. , & Adali, T. (2014). The chronnectome: Time‐varying connectivity networks as the next frontier in fMRI data discovery. Neuron, 84, 262–274. [DOI] [PMC free article] [PubMed] [Google Scholar]
- Calhoun, V. D. , Wager, T. D. , Krishnan, A. , Rosch, K. S. , Seymour, K. E. , Nebel, M. B. , … Kiehl, K. (2017). The impact of T1 versus EPI spatial normalization templates for fMRI data analyses. Human Brain Mapping, 38, 5331–5342. [DOI] [PMC free article] [PubMed] [Google Scholar]
- Chang, C. , & Glover, G. H. (2010). Time‐frequency dynamics of resting‐state brain connectivity measured with fMRI. NeuroImage, 50, 81–98. [DOI] [PMC free article] [PubMed] [Google Scholar]
- Damaraju, E. , Allen, E. A. , Belger, A. , Ford, J. M. , McEwen, S. , Mathalon, D. H. , … Calhoun, V. D. (2014). Dynamic functional connectivity analysis reveals transient states of dysconnectivity in schizophrenia. NeuroImage Clinics, 5, 298–308. [DOI] [PMC free article] [PubMed] [Google Scholar]
- Damaraju, E. , Phillips, J. R. , Lowe, J. R. , Ohls, R. , Calhoun, V. D. , & Caprihan, A. (2010). Resting‐state functional connectivity differences in premature children. Frontiers in Systems Neuroscience, 4, [DOI] [PMC free article] [PubMed] [Google Scholar]
- de Lacy, N. , Doherty, D. , King, B. H. , Rachakonda, S. , & Calhoun, V. D. (2017). Disruption to control network function correlates with altered dynamic connectivity in the wider autism spectrum. NeuroImage Clinics, 15, 513–524. [DOI] [PMC free article] [PubMed] [Google Scholar]
- Dosenbach, N. U. , Nardos, B. , Cohen, A. L. , Fair, D. A. , Power, J. D. , Church, J. A. , … Schlaggar, B. L. (2010). Prediction of individual brain maturity using fMRI. Science (New York, N.Y.), 329, 1358–1361. [DOI] [PMC free article] [PubMed] [Google Scholar]
- Du, Y. , Allen, E. A. , He, H. , Sui, J. , Wu, L. , & Calhoun, V. D. (2016). Artifact removal in the context of group ICA: A comparison of single‐subject and group approaches. Human Brain Mapping, 37, 1005–1025. [DOI] [PMC free article] [PubMed] [Google Scholar]
- Du, Y. , & Fan, Y. (2013). Group information guided ICA for fMRI data analysis. NeuroImage, 69, 157–197. [DOI] [PubMed] [Google Scholar]
- Du, Y. , Pearlson, G. D. , Liu, J. , Sui, J. , Yu, Q. , He, H. , … Calhoun, V. D. (2015). A group ICA based framework for evaluating resting fMRI markers when disease categories are unclear: Application to schizophrenia, bipolar, and schizoaffective disorders. NeuroImage, 122, 272–280. [DOI] [PMC free article] [PubMed] [Google Scholar]
- Erhardt, E. B. , Rachakonda, S. , Bedrick, E. J. , Allen, E. A. , Adali, T. , & Calhoun, V. D. (2011). Comparison of multi‐subject ICA methods for analysis of fMRI data. Human Brain Mapping, 32, 2075–2095. [DOI] [PMC free article] [PubMed] [Google Scholar]
- Fair, D. A. , Cohen, A. L. , Dosenbach, N. U. , Church, J. A. , Miezin, F. M. , Barch, D. M. , … Schlaggar, B. L. (2008). The maturing architecture of the brain's default network. Proceedings of the National Academy of Sciences of the United States of America, 105, 4028–4032. [DOI] [PMC free article] [PubMed] [Google Scholar]
- Farrant, K. , & Uddin, L. Q. (2015). Asymmetric development of dorsal and ventral attention networks in the human brain. Developmental Cognitive Neuroscience, 12, 165–174. [DOI] [PMC free article] [PubMed] [Google Scholar]
- Fransson, P. , Aden, U. , Blennow, M. , & Lagercrantz, H. (2011). The functional architecture of the infant brain as revealed by resting‐state fMRI. Cerebral Cortex (New York, N.Y.: 1991), 21, 145–154. [DOI] [PubMed] [Google Scholar]
- Freire, L. , Roche, A. , & Mangin, J. F. (2002). What is the best similarity measure for motion correction in fMRI time series? IEEE Transactions on Medical Imaging, 21, 470–484. [DOI] [PubMed] [Google Scholar]
- Friedman, J. , Hastie, T. , & Tibshirani, R. (2008). Sparse inverse covariance estimation with the graphical lasso. Biostatistics (Oxford, England), 9, 432–441. [DOI] [PMC free article] [PubMed] [Google Scholar]
- Gabard‐Durnam, L. J. , Flannery, J. , Goff, B. , Gee, D. G. , Humphreys, K. L. , Telzer, E. , … Tottenham, N. (2014). The development of human amygdala functional connectivity at rest from 4 to 23 years: A cross‐sectional study. NeuroImage, 95, 193–207. [DOI] [PMC free article] [PubMed] [Google Scholar]
- Gao, W. , Gilmore, J. H. , Giovanello, K. S. , Smith, J. K. , Shen, D. , Zhu, H. , & Lin, W. (2011). Temporal and spatial evolution of brain network topology during the first two years of life. PLoS One, 6, e25278. [DOI] [PMC free article] [PubMed] [Google Scholar]
- Giedd, J. N. (2008). The teen brain: Insights from neuroimaging. The. Journal of Adolescent Health: Official Publication of the Society for Adolescent Medicine, 42, 335–343. [DOI] [PubMed] [Google Scholar]
- Hull, J. V. , Jacokes, Z. J. , Torgerson, C. M. , Irimia, A. , & Van Horn, J. D. (2016). Resting‐state functional connectivity in autism spectrum disorders: A review. Frontiers in Psychiatry, 7, 205. [DOI] [PMC free article] [PubMed] [Google Scholar]
- Hutchison, R. M. , & Morton, J. B. (2015). Tracking the brain's functional coupling dynamics over development. The Journal of Neuroscience: The Official Journal of the Society for Neuroscience, 35, 6849–6859. [DOI] [PMC free article] [PubMed] [Google Scholar]
- Hutchison, R. M. , Womelsdorf, T. , Allen, E. A. , Bandettini, P. A. , Calhoun, V. D. , Corbetta, M. , … Chang, C. (2013a). Dynamic functional connectivity: Promise, issues, and interpretations. NeuroImage, 80, 360–378. [DOI] [PMC free article] [PubMed] [Google Scholar]
- Hutchison, R. M. , Womelsdorf, T. , Gati, J. S. , Everling, S. , & Menon, R. S. (2013b). Resting‐state networks show dynamic functional connectivity in awake humans and anesthetized macaques. Human Brain Mapping, 34, 2154–2177. [DOI] [PMC free article] [PubMed] [Google Scholar]
- Hwang, K. , Hallquist, M. N. , & Luna, B. (2013). The development of hub architecture in the human functional brain network. Cerebral Cortex (New York, N.Y.: 1991), 23, 2380–2393. [DOI] [PMC free article] [PubMed] [Google Scholar]
- Jernigan, T. L. , Brown, T. T. , Hagler, D. J., Jr. , Akshoomoff, N. , Bartsch, H. , Newman, E. , … Genetics, S. (2016). The Pediatric Imaging, Neurocognition, and Genetics (PING) data repository. NeuroImage, 124, 1149–1154. [DOI] [PMC free article] [PubMed] [Google Scholar]
- Just, M. A. , Cherkassky, V. L. , Keller, T. A. , & Minshew, N. J. (2004). Cortical activation and synchronization during sentence comprehension in high‐functioning autism: Evidence of underconnectivity. Brain: A Journal of Neurology, 127, 1811–1821. [DOI] [PubMed] [Google Scholar]
- Kelly, A. M. , Di Martino, A. , Uddin, L. Q. , Shehzad, Z. , Gee, D. G. , Reiss, P. T. , … Milham, M. P. (2009). Development of anterior cingulate functional connectivity from late childhood to early adulthood. Cerebral Cortex, 19, 640–657. [DOI] [PubMed] [Google Scholar]
- Klingberg, T. , Vaidya, C. J. , Gabrieli, J. D. , Moseley, M. E. , & Hedehus, M. (1999). Myelination and organization of the frontal white matter in children: A diffusion tensor MRI study. Neuroreport, 10, 2817–2821. [DOI] [PubMed] [Google Scholar]
- Lopez‐Larson, M. P. , Anderson, J. S. , Ferguson, M. A. , & Yurgelun‐Todd, D. (2011). Local brain connectivity and associations with gender and age. Developmental Cognitive Neuroscience, 1, 187–197. [DOI] [PMC free article] [PubMed] [Google Scholar]
- Marek, S. , Hwang, K. , Foran, W. , Hallquist, M. N. , & Luna, B. (2015). The contribution of network organization and integration to the development of cognitive control. PLoS Biology, 13, e1002328. [DOI] [PMC free article] [PubMed] [Google Scholar]
- Power, J. D. , Barnes, K. A. , Snyder, A. Z. , Schlaggar, B. L. , & Petersen, S. E. (2012). Spurious but systematic correlations in functional connectivity MRI networks arise from subject motion. NeuroImage, 59, 2142–2154. [DOI] [PMC free article] [PubMed] [Google Scholar]
- Preti, M. G. , Bolton, T. A. , Van, D. , & Ville, D. (2016). The dynamic functional connectome: State‐of‐the‐art and perspectives. NeuroImage. [DOI] [PubMed] [Google Scholar]
- Qin, J. , Chen, S. G. , Hu, D. , Zeng, L. L. , Fan, Y. M. , Chen, X. P. , & Shen, H. (2015). Predicting individual brain maturity using dynamic functional connectivity. Frontiers in Human Neuroscience, 9, 418. [DOI] [PMC free article] [PubMed] [Google Scholar]
- Rashid, B. , Arbabshirani, M. R. , Damaraju, E. , Cetin, M. S. , Miller, R. , Pearlson, G. D. , & Calhoun, V. D. (2016). Classification of schizophrenia and bipolar patients using static and dynamic resting‐state fMRI brain connectivity. NeuroImage, 134, 645–657. [DOI] [PMC free article] [PubMed] [Google Scholar]
- Sakoglu, U. , Pearlson, G. D. , Kiehl, K. A. , Wang, Y. M. , Michael, A. M. , & Calhoun, V. D. (2010). A method for evaluating dynamic functional network connectivity and task‐modulation: Application to schizophrenia. Magnetic Resonance Materials in Physics, Biology and Medicine, 23, 351–366. [DOI] [PMC free article] [PubMed] [Google Scholar]
- Sato, J. R. , Biazoli, C. E., Jr. , Salum, G. A. , Gadelha, A. , Crossley, N. , Satterthwaite, T. D. , … Bressan, R. A. (2015). Temporal stability of network centrality in control and default mode networks: Specific associations with externalizing psychopathology in children and adolescents. Human Brain Mapping, 36, 4926–4937. [DOI] [PMC free article] [PubMed] [Google Scholar]
- Song, Y. , Zhu, Q. , Li, J. , Wang, X. , & Liu, J. (2015). Typical and atypical development of functional connectivity in the face network. The Journal of Neuroscience: The Official Journal of the Society for Neuroscience, 35, 14624–14635. [DOI] [PMC free article] [PubMed] [Google Scholar]
- Stevens, M. C. (2016). The contributions of resting state and task‐based functional connectivity studies to our understanding of adolescent brain network maturation. Neuroscience & Biobehavioral Reviews, 70, 13–32. [DOI] [PubMed] [Google Scholar]
- Supekar, K. , Musen, M. , & Menon, V. (2009). Development of large‐scale functional brain networks in children. PLoS Biology, 7, e1000157. [DOI] [PMC free article] [PubMed] [Google Scholar]
- Supekar, K. , Uddin, L. Q. , Khouzam, A. , Phillips, J. , Gaillard, W. D. , Kenworthy, L. E. , … Menon, V. (2013). Brain hyperconnectivity in children with autism and its links to social deficits. Cell Reports, 5, 738–747. [DOI] [PMC free article] [PubMed] [Google Scholar]
- Supekar, K. , Uddin, L. Q. , Prater, K. , Amin, H. , Greicius, M. D. , & Menon, V. (2010). Development of functional and structural connectivity within the default mode network in young children. Neuroimage, 52, 290–301. [DOI] [PMC free article] [PubMed] [Google Scholar]
- Tomasi, D. , & Volkow, N. D. (2014). Functional connectivity of substantia nigra and ventral tegmental area: Maturation during adolescence and effects of ADHD. Cerebral Cortex, 24, 935–944. [DOI] [PMC free article] [PubMed] [Google Scholar]
- Vakorin, V. A. , Lippe, S. , & McIntosh, A. R. (2011). Variability of brain signals processed locally transforms into higher connectivity with brain development. Journal of Neuroscience, 31, 6405–6413. [DOI] [PMC free article] [PubMed] [Google Scholar]
- Vergara, V. M. , Mayer, A. R. , Damaraju, E. , & Calhoun, V. D. (2017). The effect of preprocessing in dynamic functional network connectivity used to classify mild traumatic brain injury. Brain and Behavior, e00809. [DOI] [PMC free article] [PubMed] [Google Scholar]
- Yang, Z. , Chang, C. , Xu, T. , Jiang, L. , Handwerker, D. A. , Castellanos, F. X. , … Zuo, X. N. (2014). Connectivity trajectory across lifespan differentiates the precuneus from the default network. NeuroImage, 89, 45–56. [DOI] [PMC free article] [PubMed] [Google Scholar]
- Zuo, X. N. , Kelly, C. , Di Martino, A. , Mennes, M. , Margulies, D. S. , Bangaru, S. , … Milham, M. P. (2010). Growing together and growing apart: Regional and sex differences in the lifespan developmental trajectories of functional homotopy. Journal of Neuroscience, 30, 15034–15043. [DOI] [PMC free article] [PubMed] [Google Scholar]