

Abstract
We investigated longitudinal viral clustering among and within subjects in a highly networked cohort of people who inject drugs (PWID). All subjects had estimated dates of infection and two or more E1 sequences (bp 943-1288 relative to H77) with 1 to 14 years of follow up. Two methods (HIV-TRACE and PhyloPart) were used to determine clusters. Genetic distance thresholds were determined by comparing intra-and inter-host distances. Additional phylogenetic analysis was performed on subjects with complicated viral histories. At the optimal threshold of 3.9%, HIV-TRACE found 77 clusters and PhyloPart found 63 clusters, of which 27 and 32 contained multiple subjects, respectively. Furthermore, 1/3 of the subjects had sequences in different clusters over the course of the study, including some cases in which a later-sampled sequence matched a cluster detected much earlier in the infection, despite being separated by RNA-negative lab visit and detection of sequences in different clusters. A detailed phylogenetic analysis of four subjects with such patterns showed that in all four cases, the earlier and later variants grouped closely on the tree, and did not group with concurrent sequences from any other subject. These observations suggest that subjects are either experiencing rapid and recurring infection-clearance-reinfection cycles from the same source, or a single transmission event produces a chronic infection that may go undetected and/or co-circulate with different viruses from separate transmission events. Furthermore, our results show the utility of using longitudinal sampling to obtain a more comprehensive view of the viral linkages in high-risk populations.
Keywords: linkage, clustering, epidemiology, phylogenetic, HCV
1. INTRODUCTION
Hepatitis C virus (HCV) causes more mortality in the United States than 59 other reportable infectious diseases combined (1). Moreover, there is an epidemic of acute HCV infection linked to the nationwide opioid epidemic (2). Thus, despite widely publicized new effective treatments, HCV remains a major public health problem (3). The epidemic is particularly devastating in populations of people who inject drugs (PWID), in which an estimated 2/3 of individuals are HCV positive (4), although extensive research is lacking (5).
According to a recent report from the National Academies of Science, Engineering, and Medicine, assessing HCV epidemiological dynamics in populations is important to both design and evaluate HCV control strategies (6). The identification of transmission clusters can support self-reported transmission events, identify putative transmission chains, and reveal mixing between key risk groups and geographic sub-populations (7). Such approaches are commonly used in molecular epidemiological studies of HIV (8-12) and HCV (13-20).
However, tracing HCV transmission events, particularly in high-risk population such as PWID, is more complicated than for HIV for several reasons. One, intra-host HCV evolves in highly structured populations where multiple lineages persist through time (21) although may only be sporadically detected (22, 23). Thus, the viral variants taken from a single time point do not necessarily reflect the true composition of the population (21), even when using high-throughput sequencing (23). Second, unlike HIV, individuals can spontaneously clear HCV infection. Individuals can then become re-infected, either with a different strain, or with a highly similar strain as the initial infection. Either scenario is likely among a highly-networked group participating in high risk behaviors. Concurrent infections with different strains are also possible, although they may be transiently detected. Additionally, in PWID populations, individuals may cease the high-risk behavior and/or experience re-lapse, so that the risk of re-infection is not constant (5).
Some studies may attempt to avoid such complications by using a single time point per individual taken soon after initial seroconversion (15, 17, 19), and longitudinal studies typically only track infection only over a short time frame (e.g. less than 2 years) (14, 20). However, these approaches limit the understanding of the viral dynamics over time within PWID populations.
In this study, we investigated viral patterns among a highly-networked cohort of PWID followed from July 1997 to July 2016. All subjects had at least 2 samples spaced at least one year apart. Our goal was to determine the appropriate definitions of linkage and describe the complex nature of HCV viral evolution in this highly networked population.
2. METHODS
2.1 Ethics Statement
This study was approved by the Institutional Review Board of the Johns Hopkins University (IRB# NA_00046368, Title: CD8 + T cells and the Outcome of viral hepatitis- Monthly Blood Sampling). This study of stored samples and previously collected data and the parent cohort study was conducted according to the ethical standards set forth by the institutional review board of Johns Hopkins University and the Helsinki Declaration of the World Medical Association. All participants were adults who provided written informed consent.
2.2 Subjects
HCV uninfected subjects were enrolled in the “Baltimore Before and After Acute Study of Hepatitis” (BBAASH) cohort, as previously described (24). All were classified as people who inject drugs (PWID) and had estimated dates of infection after entry into the study. At each visit, subjects were counseled to reduce the risk of injection drug use and tested for HCV infection. The study followed hundreds of individuals who were tested for HCV in a protocol designed for monthly follow up and approved by the Johns Hopkins IRB. At time points where HCV RNA testing was positive, HCV sequence data was obtained. The cohort included chronically-infected individuals, as well as individuals who cleared infection, some of whom were subsequently became re-infected. Summary statistics for the subjects analyzed in this study is shown in Table 1.
Table 1.
Description of population evaluated
| Characteristic | Number of subjects |
|---|---|
| 89 | |
| % Female | 42 |
| Race (%) | |
| African American | 16 (17%) |
| Caucasian | 70 (78%) |
| Other | 3 (3%) |
| Mean age at seroconversion (IQRa) in years | 27 (24, 29) |
| Mean year of HCV seroconversion (IQR) | 2003 (2001, 2006) |
| Follow up post HCV seroconversion Av. (range) in years | 4.7 (1, 14) |
| Total C/E1 sequences | 743 |
| Average number of sequences / subject | 8.3 |
IQR inter quartile range
2.3 Genetic Sequence Data and Analysis
For samples that tested RNA positive in the BBASH cohort, bulk sequencing was performed on the HCV E1 gene (H77 nt 943 to 1288 (25). E1 was chosen as it has high variability and is a commonly sampled region. Furthermore, the primer sets have a high amplification efficiency and efficiently amplify across genotypes 1 to 6 (26). For this study, we included 89 subjects who had two or more sequences (range 2-31, median = 7 sequences/person) sampled over a 1-14-year period (average time span = 4.7 years). The final alignment comprised 743 sequences which were generated in real time over a near two-decade period (1997-2016). At time points when a subject had a sequence >5% different from the previous time point, the sample was re-extracted and re-sequenced. All subjects had estimated dates of infection measured as the midpoint between the last negative and first positive HCV serological test.
Clusters were assigned using two methods: HIV-TRACE (11) and PhyloPart (27). Pairwise distances for HIV-TRACE were generated using the tn93 genetic distance model. Clusters were assigned using a range of genetic distance thresholds (1-10%). Phylogenetic trees were inferred using the program PhyML v.3.0 (28) using the general-time reversible nucleotide substitution model with gamma-distributed rate variation among sites. Branch support was assessed using the aLRT method (29). Clusters were assigned with PhyloPart using a range of patristic distance thresholds (1-10%) and >70 bootstrap branch support.
The ROC curve and threshold analysis were performed in R (code available on request). Cluster visualizations were performed with the Tableau software (version 10).
3. RESULTS
3.1 Genetic distance
From the 89 subjects, there were 743 sequences from which a total of 254,106 bases were confidently represented. Overall, the average intra-subject distance ranged from 0%-47%. We then compared the average intra- and inter-subject pairwise distance (Figure 1). The distributions were largely overlapping, with peaks in both distributions occurring at 10%, 35%, 50%, and 65%. The major difference between the two distributions was that <5% distance was observed for 50% of the intra-subject comparisons but only 0.2% of inter-subject comparisons. We then calculated pairwise distances within HCV genotypes or subtypes (Figure 1). Within a genotype or subtype, the average genetic distance was 10% for the inter-subject comparisons and <5% for the intra-subject comparisons. For subtypes 1a vs. 1b, average genetic distance was 35%; 1a/1b vs. 3a was 50%, and 2b vs. any other genotype was 65%. These values correspond to the 4 peaks in the distance distributions. Within the intra-host dataset, there were different HCV genotypes/subtypes detected that, importantly, reflected co- or re-infection.
Figure 1.
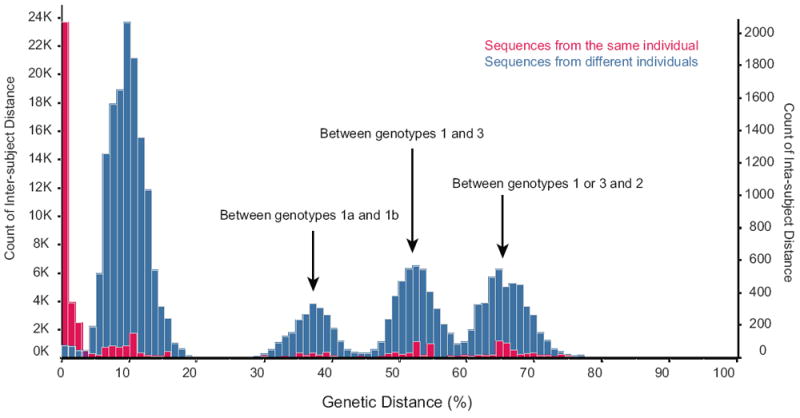
Distributions of intra- (red, right axis) and inter- (blue, left axis) subject genetic distance (x-axis). Measurements are for all pairwise comparisons among 743 sequences of 89 subjects. The subtype comparisons represented by each peak are noted.
3.2 Establishing a genetic distance threshold
To determine viral clusters, we used two approaches: HIV-TRACE, which considers only genetic distance, and PhyloPart, which uses both tree-topology and patristic (branch) distances to assign thresholds. We evaluated the behavior of the two approaches by using a series of genetic distance threshold values (1%-10%). For HIV-TRACE, at the 1% threshold, 90% of sequences fell into a cluster, which quickly increased to 99.6% at 10% (Supplemental Figure 1). For PhyloPart, 85% of sequences fell into a cluster at the 1% threshold, then initially climbed more quickly than HIV-TRACE, but leveled off at 97%. The number of clusters detected by the two programs was similar at the 1% threshold, but fell much more quickly for PhyloPart than for HIV-TRACE until 5% (Supplemental Figure 1). At that point, the number of clusters for PhyloPart plateaued around n=50, while the number of clusters for HIV-TRACE continued to decline. This trend was explained by the maximum number of subjects in any one cluster for each threshold: for PhyloPart, the maximum size showed a distinct increase between 4% and 5%, but stabilized at n=21 subjects. For HIV-TRACE, the maximum number of subjects began to increase exponentially at 4% reaching a high of 77 subjects.
Next, we conducted a receiver operator curve (ROC) analysis to determine the optimal genetic threshold that separated the intra-subject comparisons from the inter-subject comparisons. We performed the analysis for each genotype/subtype separately. The optimal thresholds for the four subtypes were 3.9% (1a), 5.2% (1b), 5.3% (2b), and 5.8% (3a). The area under the curve (AUC) for each subtype was 0.90 (1a), 0.90 (1b), and 0.98 (for both 2b and 3a).
3.3 Composition of viral clusters
We then calculated clusters for each of the four datasets using the optimal genetic distance threshold defined in the ROC analysis for each subtype, as well as using the 1a threshold of 3.9%. We found no difference in cluster assignment between the two thresholds. The only difference found was that 3 and 2 sequences from subtypes 2b and 3a, respectively, were unassigned to any cluster at 3.9%, although those sequences clustered with the rest of the sequences from the same subject at the higher threshold. We therefore combined all sequences and used the threshold of 3.9% in the remaining analysis.
We assigned clusters designations to all sequences using two approaches, HIV-TRACE and PhyloPart. In the first instance, we found 77 clusters, 27 of which contained multiple subjects (Figure 2a). For PhyloPart, we found 63 clusters, 32 of which contained multiple subjects. Slightly fewer sequences were placed in clusters with HIV-TRACE versus PhyloPart (n=710 and 715, respectively).
Figure 2.
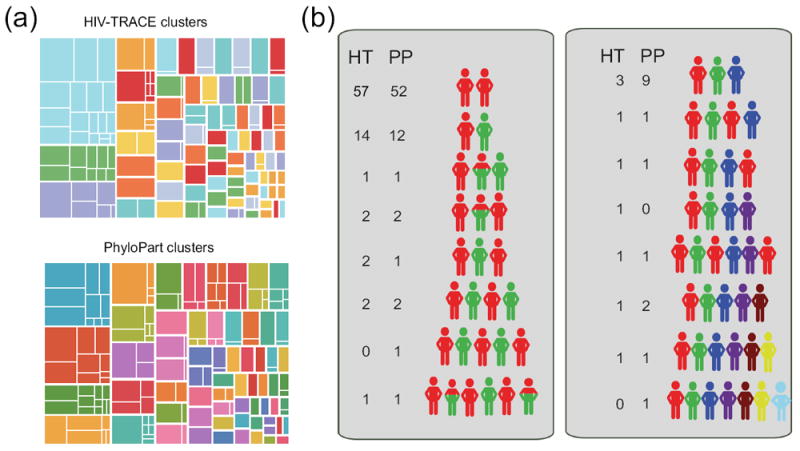
(a) Clusters of 743 sequences at 3.9% genetic distance threshold using HIV-TRACE (top) and PhyloPart (bottom). Each large rectangle represents a cluster that are separated by a thick white line. Smaller rectangles represent the division of clusters into subjects, separated by a thin white line. Sizes of rectangles are scaled by number of sequences contained therein. (b) Longitudinal clustering patterns for 89 subjects. Each colored human figure represents a cluster. The order in which cluster membership was detected is shown schematically. Note that the number of figures is not necessarily equivalent to the total number of samples (i.e. one red figure may represent one or more time points belonging to that cluster). The number next to each set of figures indicates the number of subjects detected as having this pattern by HIV-TRACE (HT) and PhyloPart (PP).
We then investigated how these viral clusters changed over time within an individual (Figure 2b). About two-thirds of the subjects (64% for HIV-TRACE, 58% for PhyloPart), belonged to a single cluster throughout the study. The rest of the subjects belonged to anywhere from 2-6 different clusters over time.
The most common of these scenarios was that a subject belonged to Cluster A at the beginning of infection, and switched to Cluster B later in infection (14/89 and 12/89 for HIV-TRACE and PhyloPart, respectively). The remaining patterns were more complex, including those in which subjects belonging to one cluster early in infection returned to that same cluster much later, and where subjects belonged to two clusters simultaneously. The patterns of infection were largely consistent between the two programs, although PhyloPart tended to detect more clusters for a given subject than did HIV-TRACE.
3.4 Detailed analysis of four subjects
We then examined four subjects in whom an early viral variant re-appeared at a later time point and for whom both programs detected the same pattern (subjects 48, 831, 14, and 403). Each sequence from the four subjects is plotted by the time of the visit for each of the four subjects (Figure 3A-D). Different clusters are separated on the y-axis. Samples plotted at y=0 indicate that no virus was detected at that visit. Interestingly, for three of the four subjects, multiple instances of no detected virus were followed by a subsequent positive sample. However, these instances did not necessarily correspond to a new variant being detected. In subject 48, (Figure 3A) sequences 10 and 11 were separated by a negative sample, but both were in Cluster 10. This pattern was also detected for subject 403 (Figure 3B), in which negative samples were detected between sequences 10 and 11, and between 12 and 13, although sequences 4-15 were all in Cluster 20. For subject 14 (Figure 3C), again negative samples were detected between sequences 2 and 3, both in Cluster 2, and 7 and 8, both in Cluster 44. For the last subject, 831, virus was found at all visits (Figure 3D). In some cases, sequences from consecutive visits were in different clusters (e.g. 403, sequences 15 and 16; 831, sequences 4 and 5). Interestingly as well, the time between detection of different clusters was only weeks or months.
Figure 3.
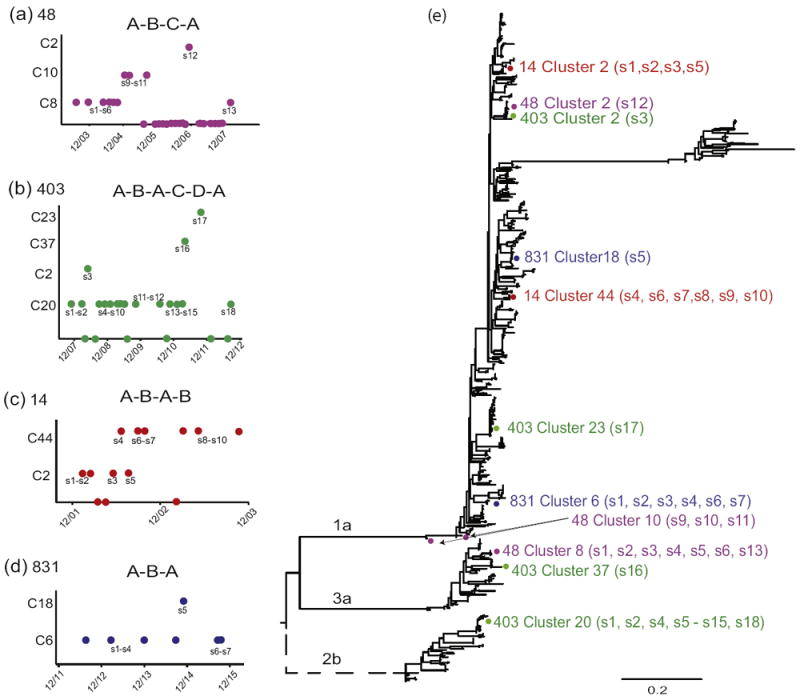
Four subjects are shown: 48 (a), 403 (c) and 14 (c), and 831 (d). Each different cluster is plotted on the y-axis, and the time at which the sample was taken on the x-axis. S=sequence. Dots plotted at 0 on the y-axis indicates a negative viral load at that time. Maximum likelihood phylogenetic tree (e) of all 89 subjects included in the analyses. Colored dots represent sequences of subjects in panels (a)-(d), with one color per subject. Branch lengths are scaled in substitutions per site according to the scale bar at the bottom of the tree. The dotted branch was re-scaled for clarity and actually has a much longer branch length.
To distinguish whether these represented a new infection from the same virus pool (e.g. a group of PWIDs), we inferred a phylogenetic tree using all 743 sequences from the 89 subjects (Figure 3E). The sequences from the four subjects are plotted on the tree. In all cases, sequences from the same subject in the same cluster were highly similar, in some cases identical, even when separated by a negative viral load, detection of a different variant, and/or separated by years in between sampling. The clusters to which subjects belonged at different times were spread out on the tree, and in some cases, were different subtypes, confirming the high genetic distance between those clusters. In some cases, a subjects’ later sequences were part of an earlier detected cluster, although a different cluster was detected in the intervening time (e.g. subject 48, Cluster 8; subject 831, Cluster 6; subject 403, Cluster 20). For both subject 48 and subject 831, all of their sequences were on the same branch excluding any other subject. For subject 403, all Cluster 20 sequences also grouped on the same branch, although with another subject. However, that subject’s sequences were much earlier (2004-2007) than those of subject 403 (2008-2013), thus making re-infection from that other subject less likely (although still possible).
4. DISCUSSION
We investigated a cohort of highly-networked PWID who acquired HCV with estimated dates of infection and had viral sequences from at least two distinct time points over 1 to 14 years. We initially sought to determine a genetic distance threshold for the E1 region of HCV that would efficiently separate intra- and inter-subject distances. Interestingly, the intra- and inter-subject genetic distance distributions largely mirrored each other, with multiple peaks that corresponded to inter-genotype comparisons, reflecting the high genetic diversity within the population as well as multiple infections within the same individual. The major difference was that the bulk of the intra-subject distribution abutted zero, while the bulk of the inter-subject distribution was more evenly distributed among the various peaks. Importantly, this reflects that some subjects are infected with multiple viruses over time, and thus all HCV variants within an individual do not necessarily share a common ancestor. The ROC analysis was consistent with a visual analysis of the overlapping point of the two distributions. Our method, while similar to other studies that use pairwise distances to determine thresholds (20), differs from these in two ways: first, we included samples with a range of up to 14 years apart, taking into consideration longer periods of intra-subject variation. Second, we use a method that produces an exact threshold value.
The intra- and inter-subject HCV pairwise distributions are also noticeably different than those for HIV, in which there is a clear separation in the distributions of intra- and inter-host distances (30). This reflects the higher frequency of multiple infections within the HCV-infected population, and the higher complexity of HCV infection dynamics in populations (21-23).
The difference between the two clustering approaches, namely that HIV-TRACE generates very large clusters at thresholds >4% as compared to PhyloPart, was similar to a trend we previously reported when comparing HIV-TRACE to a different phylogeny-based clustering algorithm (30).
About 1/3 of subjects fell into multiple viral clusters over the course of this infection, which is not unexpected given that patients frequently clear infections and are at high risk for re-infection due to their behavior. One of the most interesting observations, however, was that in some subjects, sequences from an early and late time point were part of the same cluster, with either negative lab results and/or detection of sequences belonging to a different cluster occurring in between them. An important question from a public health perspective is whether this “reappearance” of clusters represents a de novo infection from a similar source (e.g. a drug-injection partner), or whether the subject never cleared the first infection. We attempted to distinguish between these possibilities by investigating the phylogenetic tree. No instance showed evidence of re-infection, i.e. there were not contemporaneous sequences from another subject. Clearly, this could be the result of under-sampling individuals, wherein the transmitting partner was not part of the cohort. However, all subjects were encouraged to refer their injecting partners to the study, thus increasing the chances that direct transmission events would be detected. Furthermore, the time between detection of different clusters was often only a few weeks or months, which would imply an almost immediate re-infection event. In addition, the E1/E2 region reverts to a wildtype phenotype before accumulating mutations specific to the new host immune system (31-33). If these cases were a reinfection from the same source (e.g. needle-sharing partner), it would be expected that the re-infecting virus would be distinct, given the cycle of adapting to different individuals.
Furthermore, the possibility that the same infection lingered over time despite going undetected is supported by previous studies of intra-host HCV that showed that lineages may disappear and re-appear at later time points, even persisting through a liver transplant (34), producing complex phylogenetic trees (13-15). The virus can show a highly structured viral population both phylogenetically (22, 23) and within the liver itself (35-37) and thus the sampled blood virus at a given time point does not necessarily reflect the entirety of the infection (21). Because the present study was not designed to investigate in-depth intra-host evolution, the number of sequences available are not sufficient to exhaustively investigate the population structure within individuals. However, the patterns of viral clustering that we describe are consistent with such structure underling the infections.
To more firmly distinguish among the possibilities, deep sequencing would likely be required. Given that the sequencing methodology used here, Sanger sequencing, is standard in molecular epidemiological studies, our findings have direct relevance to surveillance studies of similar high-risk populations. Ours finding puts into question the results of cross-sectional approaches to assigning clusters based on solely genetic distance, since there could be a good deal of variation that is undetected, thus masking true transmission events. If the observed patterns are instead caused by rapid repeating clearance and reinfection from the same source, this too would have significant implications for public health.
5. CONCLUSION
In high-risk cohorts, such as the cohort of PWID described here, there are numerous opportunities for acute-on-acute infections, co-infections and superinfections. Coupled with the complex intra-host dynamics, inferences of transmission events are far from straightforward. Longitudinal sampling provides a higher degree of resolution.
Supplementary Material
Highlights.
About 1/3 of the subjects had sequences in different clusters over the course of the study.
In some cases a later-sampled sequence matched a cluster detected much earlier in the infection, despite being separated by RNA-negative lab visit and detection of sequences in different clusters.
This study demonstrates the importance of longitudinal sampling to obtain a more comprehensive view of the viral linkages in high-risk populations.
Acknowledgments
We thank the individuals who participated in the BBASH study.
FUNDING
RR and SLL are employed by Bioinfoexperts, LLC, and are supported by NSF SBIR #168053. OL and SCR were supported by The HIV Prevention Trials Network sponsored by the National Institute of Allergy and Infectious Diseases, National Institute of Child Health and Human Development, National Institute of Drug Abuse, National Institute of Mental Health, and Office of AIDS Research of the NIH, DHHS (UM1 AI068613). OL was funded by the Division of Intramural Research, National Institute of Allergy and Infectious Diseases, National Institutes of Health. SCR and AC were funded by the National Institute of Allergy and Infectious Diseases U19 AI088791. The funders had no role in study design, data collection and analysis, decision to publish, or preparation of the manuscript.
ABREVIATIONS
- HCV
hepatitis-C viruses
- ROC
Receiver operator curve
- BBAASH
Baltimore Before and After Acute Study of Hepatitis
- PWID
people who inject drugs
Footnotes
Publisher's Disclaimer: This is a PDF file of an unedited manuscript that has been accepted for publication. As a service to our customers we are providing this early version of the manuscript. The manuscript will undergo copyediting, typesetting, and review of the resulting proof before it is published in its final citable form. Please note that during the production process errors may be discovered which could affect the content, and all legal disclaimers that apply to the journal pertain.
References
- 1.Ly KN, Hughes EM, Jiles RB, Holmberg SD. Rising Mortality Associated With Hepatitis C Virus in the United States, 2003-2013. Clin Infect Dis. 2016;62(10):1287–8. doi: 10.1093/cid/ciw111. [DOI] [PMC free article] [PubMed] [Google Scholar]
- 2.Zibbell JE, Iqbal K, Patel RC, Suryaprasad A, Sanders KJ, Moore-Moravian L, et al. Increases in hepatitis C virus infection related to injection drug use among persons aged </=30 years - Kentucky, Tennessee, Virginia, and West Virginia, 2006-2012. MMWR Morbidity and mortality weekly report. 2015;64(17):453–8. [PMC free article] [PubMed] [Google Scholar]
- 3.Thrift AP, El-Serag HB, Kanwal F. Global epidemiology and burden of HCV infection and HCV-related disease. Nat Rev Gastroenterol Hepatol. 2017;14(2):122–32. doi: 10.1038/nrgastro.2016.176. [DOI] [PubMed] [Google Scholar]
- 4.Nelson PK, Mathers BM, Cowie B, Hagan H, Des Jarlais D, Horyniak D, et al. Global epidemiology of hepatitis B and hepatitis C in people who inject drugs: results of systematic reviews. Lancet. 2011;378(9791):571–83. doi: 10.1016/S0140-6736(11)61097-0. [DOI] [PMC free article] [PubMed] [Google Scholar]
- 5.Larney S, Grebely J, Hickman M, De Angelis D, Dore GJ, Degenhardt L. Defining populations and injecting parameters among people who inject drugs: Implications for the assessment of hepatitis C treatment programs. Int J Drug Policy. 2015;26(10):950–7. doi: 10.1016/j.drugpo.2015.07.010. [DOI] [PubMed] [Google Scholar]
- 6.Romano C, de Carvalho-Mello I, Jamal L, de Melo F, Iamarino A, Motoki M, et al. Social networks shape the transmission dynamics of hepatitis C virus. PLoS One. 2010;5(6):e11170. doi: 10.1371/journal.pone.0011170. [DOI] [PMC free article] [PubMed] [Google Scholar]
- 7.Aldous JL, Pond SK, Poon A, Jain S, Qin H, Kahn JS, et al. Characterizing HIV transmission networks across the United States. Clin Infect Dis. 2012;55(8):1135–43. doi: 10.1093/cid/cis612. [DOI] [PMC free article] [PubMed] [Google Scholar]
- 8.Leigh Brown AJ, Lycett SJ, Weinert L, Hughes GJ, Fearnhill E, Dunn DT, et al. Transmission network parameters estimated from HIV sequences for a nationwide epidemic. J Infect Dis. 2011;204(9):1463–9. doi: 10.1093/infdis/jir550. [DOI] [PMC free article] [PubMed] [Google Scholar]
- 9.Hughes GJ, Fearnhill E, Dunn D, Lycett SJ, Rambaut A, Leigh Brown AJ, et al. Molecular phylodynamics of the heterosexual HIV epidemic in the United Kingdom. PLoS pathogens. 2009;5(9):e1000590. doi: 10.1371/journal.ppat.1000590. [DOI] [PMC free article] [PubMed] [Google Scholar]
- 10.Wertheim JO, Oster AM, Hernandez AL, Saduvala N, Bañez Ocfemia MC, Hall HI. The International Dimension of the U.S. HIV Transmission Network and Onward Transmission of HIV Recently Imported into the United States. AIDS Res Hum Retroviruses. 2016 doi: 10.1089/aid.2015.0272. [DOI] [PMC free article] [PubMed] [Google Scholar]
- 11.Wertheim JO, Leigh Brown AJ, Hepler NL, Mehta SR, Richman DD, Smith DM, et al. The global transmission network of HIV-1. J Infect Dis. 2014;209(2):304–13. doi: 10.1093/infdis/jit524. [DOI] [PMC free article] [PubMed] [Google Scholar]
- 12.Wertheim JO, Kosakovsky Pond SL, Forgione LA, Mehta SR, Murrell B, Shah S, et al. Social and Genetic Networks of HIV-1 Transmission in New York City. PLoS Pathog. 2017;13(1):e1006000. doi: 10.1371/journal.ppat.1006000. [DOI] [PMC free article] [PubMed] [Google Scholar]
- 13.Jacka B, Applegate T, Poon AF, Raghwani J, Harrigan PR, DeBeck K, et al. Transmission of hepatitis C virus infection among younger and older people who inject drugs in Vancouver, Canada. J Hepatol. 2016;64(6):1247–55. doi: 10.1016/j.jhep.2016.02.031. [DOI] [PMC free article] [PubMed] [Google Scholar]
- 14.Olmstead AD, Joy JB, Montoya V, Luo I, Poon AF, Jacka B, et al. A molecular phylogenetics-based approach for identifying recent hepatitis C virus transmission events. Infect Genet Evol. 2015;33:101–9. doi: 10.1016/j.meegid.2015.04.017. [DOI] [PubMed] [Google Scholar]
- 15.Jacka B, Applegate T, Krajden M, Olmstead A, Harrigan PR, Marshall B, et al. Phylogenetic clustering of hepatitis C virus among people who inject drugs in Vancouver, Canada. Hepatology. 2014;60(5):1571–80. doi: 10.1002/hep.27310. [DOI] [PMC free article] [PubMed] [Google Scholar]
- 16.Sacks-Davis R, Daraganova G, Aitken C, Higgs P, Tracy L, Bowden S, et al. Hepatitis C virus phylogenetic clustering is associated with the social-injecting network in a cohort of people who inject drugs. PLoS One. 2012;7(10):e47335. doi: 10.1371/journal.pone.0047335. [DOI] [PMC free article] [PubMed] [Google Scholar]
- 17.Matthews GV, Pham ST, Hellard M, Grebely J, Zhang L, Oon A, et al. Patterns and characteristics of hepatitis C transmission clusters among HIV-positive and HIV-negative individuals in the Australian trial in acute hepatitis C. Clin Infect Dis. 2011;52(6):803–11. doi: 10.1093/cid/ciq200. [DOI] [PMC free article] [PubMed] [Google Scholar]
- 18.Aitken CK, McCaw RF, Bowden DS, Tracy SL, Kelsall JG, Higgs PG, et al. Molecular epidemiology of hepatitis C virus in a social network of injection drug users. J Infect Dis. 2004;190(9):1586–95. doi: 10.1086/424678. [DOI] [PubMed] [Google Scholar]
- 19.Bartlett SR, Jacka B, Bull RA, Luciani F, Matthews GV, Lamoury FM, et al. HIV infection and hepatitis C virus genotype 1a are associated with phylogenetic clustering among people with recently acquired hepatitis C virus infection. Infect Genet Evol. 2016;37:252–8. doi: 10.1016/j.meegid.2015.11.028. [DOI] [PMC free article] [PubMed] [Google Scholar]
- 20.Bretaña NA, Boelen L, Bull R, Teutsch S, White PA, Lloyd AR, et al. Transmission of Hepatitis C Virus among Prisoners, Australia, 2005-2012. Emerg Infect Dis. 2015;21(5):765–74. doi: 10.3201/eid2105.141832. [DOI] [PMC free article] [PubMed] [Google Scholar]
- 21.Rose R, Salemi M, Klenerman P, Pybus OG. A New Evolutionary Model for Hepatitis C Virus Chronic Infection. PLoS Pathog. 2012;8:e1002656. doi: 10.1371/journal.ppat.1002656. [DOI] [PMC free article] [PubMed] [Google Scholar]
- 22.Raghwani J, Rose R, Sheridan I, Lemey P, Suchard MA, Santantonio T, et al. Exceptional Heterogeneity in Viral Evolutionary Dynamics Characterises Chronic Hepatitis C Virus Infection. PLoS Pathog. 2016;12(9):e1005894. doi: 10.1371/journal.ppat.1005894. [DOI] [PMC free article] [PubMed] [Google Scholar]
- 23.Ho CK, Raghwani J, Koekkoek S, Liang RH, Van der Meer JT, Van Der Valk M, et al. Characterization of Hepatitis C Virus (HCV) Envelope Diversification from Acute to Chronic Infection within a Sexually Transmitted HCV Cluster by Using Single-Molecule, Real-Time Sequencing. J Virol. 2017;91(6) doi: 10.1128/JVI.02262-16. [DOI] [PMC free article] [PubMed] [Google Scholar]
- 24.Cox AL, Netski DM, Mosbruger T, Sherman SG, Strathdee S, Ompad D, et al. Prospective evaluation of community-acquired acute-phase hepatitis C virus infection. Clin Infect Dis. 2005;40(7):951–8. doi: 10.1086/428578. [DOI] [PubMed] [Google Scholar]
- 25.Ray SC, Arthur RR, Carella A, Bukh J, Thomas DL. Genetic epidemiology of hepatitis C virus throughout egypt. J Infect Dis. 2000;182(3):698–707. doi: 10.1086/315786. [DOI] [PubMed] [Google Scholar]
- 26.https://hcv.lanl.gov/content/sequence/HCV/primers/primers.html
- 27.Prosperi MC, Ciccozzi M, Fanti I, Saladini F, Pecorari M, Borghi V, et al. A novel methodology for large-scale phylogeny partition. Nat Commun. 2011;2:321. doi: 10.1038/ncomms1325. [DOI] [PMC free article] [PubMed] [Google Scholar]
- 28.Guindon S, Delsuc F, Dufayard J, Gascuel O. Estimating maximum likelihood phylogenies with PhyML. Methods Mol Biol. 2009;537:113–37. doi: 10.1007/978-1-59745-251-9_6. [DOI] [PubMed] [Google Scholar]
- 29.Anisimova M, Gascuel O. Approximate likelihood-ratio test for branches: A fast, accurate, and powerful alternative. Syst Biol. 2006;55(4):539–52. doi: 10.1080/10635150600755453. [DOI] [PubMed] [Google Scholar]
- 30.Rose R, Lamers SL, Dollar JJ, Grabowski MK, Hodcroft EB, Ragonnet-Cronin M, et al. Identifying Transmission Clusters with Cluster Picker and HIV-TRACE. AIDS Res Hum Retroviruses. 2017;33(3):211–8. doi: 10.1089/aid.2016.0205. [DOI] [PMC free article] [PubMed] [Google Scholar]
- 31.Ray SC, Fanning L, Wang XH, Netski DM, Kenny-Walsh E, Thomas DL. Divergent and convergent evolution after a common-source outbreak of hepatitis C virus. J Exp Med. 2005;201(11):1753–9. doi: 10.1084/jem.20050122. [DOI] [PMC free article] [PubMed] [Google Scholar]
- 32.Cox AL, Mosbruger T, Mao Q, Liu Z, Wang XH, Yang HC, et al. Cellular immune selection with hepatitis C virus persistence in humans. J Exp Med. 2005;201(11):1741–52. doi: 10.1084/jem.20050121. [DOI] [PMC free article] [PubMed] [Google Scholar]
- 33.Timm J, Lauer GM, Kavanagh DG, Sheridan I, Kim AY, Lucas M, et al. CD8 epitope escape and reversion in acute HCV infection. J Exp Med. 2004;200(12):1593–604. doi: 10.1084/jem.20041006. [DOI] [PMC free article] [PubMed] [Google Scholar]
- 34.Gray RR, Strickland SL, Veras NM, Goodenow MM, Pybus OG, Lemon SM, et al. Unexpected maintenance of hepatitis C viral diversity following liver transplantation. J Virol. 2012;86(16):8432–9. doi: 10.1128/JVI.00749-12. [DOI] [PMC free article] [PubMed] [Google Scholar]
- 35.Liang Y, Shilagard T, Xiao S, Snyder N, Lau D, Cicalese L, et al. Visualizing hepatitis C virus infections in human liver by two-photon microscopy. Gastroenterology. 2009;137(4):1448–58. doi: 10.1053/j.gastro.2009.07.050. [DOI] [PubMed] [Google Scholar]
- 36.Stiffler JD, Nguyen M, Sohn JA, Liu C, Kaplan D, Seeger C. Focal distribution of hepatitis C virus RNA in infected livers. PLoS One. 2009;4(8):e6661. doi: 10.1371/journal.pone.0006661. [DOI] [PMC free article] [PubMed] [Google Scholar]
- 37.Kandathil AJ, Graw F, Quinn J, Hwang HS, Torbenson M, Perelson AS, et al. Use of laser capture microdissection to map hepatitis C virus-positive hepatocytes in human liver. Gastroenterology. 2013;145(6):1404–13.e1-10. doi: 10.1053/j.gastro.2013.08.034. [DOI] [PMC free article] [PubMed] [Google Scholar]
Associated Data
This section collects any data citations, data availability statements, or supplementary materials included in this article.