Abstract
Cirrhosis represents the end‐stage of any persistent chronically active liver disease. It is characterized by the complete replacement of normal liver tissue by fibrosis, regenerative nodules, and complete fibrotic vascularized septa. The resulting angioarchitectural distortion contributes to an increasing intrahepatic vascular resistance, impeding liver perfusion and leading to portal hypertension. To date, knowledge on the dynamically evolving pathological changes of the hepatic vasculature during cirrhogenesis remains limited. More specifically, detailed anatomical data on the vascular adaptations during disease development is lacking. To address this need, we studied the 3D architecture of the hepatic vasculature during induction of cirrhogenesis in a rat model. Cirrhosis was chemically induced with thioacetamide (TAA). At predefined time points, the hepatic vasculature was fixed and visualized using a combination of vascular corrosion casting and deep tissue microscopy. Three‐dimensional reconstruction and data‐fitting enabled cirrhogenic features to extracted at multiple scales, portraying the impact of cirrhosis on the hepatic vasculature. At the macrolevel, we noticed that regenerative nodules severely compressed pliant venous vessels from 12 weeks of TAA intoxication onwards. Especially hepatic veins were highly affected by this compression, with collapsed vessel segments severely reducing perfusion capabilities. At the microlevel, we discovered zone‐specific sinusoidal degeneration, with sinusoids located near the surface being more affected than those in the middle of a liver lobe. Our data shed light on and quantify the evolving angioarchitecture during cirrhogenesis. These findings may prove helpful for future targeted invasive interventions.
Keywords: 3D reconstruction, cirrhosis, deep tissue microscopy, hepatic vasculature, micro‐CT imaging, morphological analysis, rat liver, vascular corrosion casting
Introduction
Cirrhosis is the common end‐point of any given progressive chronic active liver disease and can evolve into liver insufficiency and clinically significant portal hypertension (PHT; Pinzani et al. 2011). PHT is responsible for the more severe and often lethal complications of cirrhosis such as bleeding oesophageal varices, ascites, renal dysfunction, and hepatic encephalopathy. Because of the combined impact of these complications, PHT remains the most important cause of morbidity and mortality in patients with cirrhosis. Not surprisingly, cirrhosis therefore accounts for approximately 1.03 million deaths per year worldwide (Tsochatzis et al. 2014). Moreover, 31 million disability adjusted life years (DALYs), equivalent to 1.2% of the global DALY burden, are attributed to this chronic condition (Mokdad et al. 2014).
As the common pathway to cirrhosis entails repetitive destruction and regeneration of liver tissue, morphological characteristics of cirrhosis comprise diffuse fibrogenesis and the conversion of the normal liver architecture into structural abnormal regenerative nodules (Anthony et al. 1978).
The morphological remodelling exerts a mechanical impact on each of the large hepatic venous vessels, as these pliant veins, i.e. the portal vein (PV), intrahepatic inferior vena cava (IVC) and hepatic veins (HV), are highly amenable to mechanical compression (Yamamoto et al. 1984; Ismail & Pinzani, 2009; Levy & Yeh, 2015). This architectural distortion contributes to an increased hepatic vascular resistance (IHVR) and is generally accountable for approximately 70% of the increase in portal pressure in liver cirrhosis (Laleman et al. 2005; Hu et al. 2013).
The morphological impact of cirrhosis is also conspicuous at the level of the hepatic microcirculation (Thabut & Shah, 2010). The microvascular phenotype is transformed from highly specialized porous sinusoids into continuous, more rigid capillaries. This process is termed sinusoidal capillarization and is characterized by the uniform defenestration of the endothelial cells and the development of subendothelial basal membranes (Huet et al. 1982; Braet & Wisse, 2002). Furthermore, cirrhosis causes numerous microscopic vessel aberrations, as hepatic arteries (HAs), PVs and HV may become entangled with each other. Various distorted spatial arrangements have been reported for blood vessels of cirrhotic livers, such as sharp bends, anomalous branching patterns, abnormal branching angles and tortuosity. Severe damage (characterized by bridging fibrosis) results in stenosis and eventually loss of vessels. In contrast, new vessels may originate to support the blood supply and venous drainage of the regenerative nodules. The resulting neovasculature is primarily located in the fibrotic regions and bypasses functional liver tissue, thereby aggravating the liver insufficiency (Hano & Takasaki, 2003; Vanheule et al. 2008; Van Steenkiste, 2010; Debbaut, 2013; Kline et al. 2014). In addition, cirrhosis is considered the principal cause of intrahepatic portosystemic shunts (Lutz et al. 2004), although the majority of portosystemic shunts observed in PHT are extrahepatic. These portosystemic shunts develop in an attempt to alleviate the elevated portal pressure (Mori et al. 1987; Alexander et al. 2001; Bodner et al. 2002). Non‐tumorous arterioportal shunts have been described in cirrhosis, as have portal‐to‐portal venous shunts, though the latter are considered rare (Kassissia et al. 1994; Bodner et al. 2002; Bhargava et al. 2011).
Despite the irrefutable contribution of the aforementioned research, knowledge on the pathological alterations of the hepatic (micro)vasculature during the genesis of cirrhosis remains scanty. In this context, animal models are valuable tools to analyse the disease process in the most appropriate way. More specifically, the thioacetamide model is a reproducible model of homogeneous and macronodular cirrhosis and is associated with all the typical features of cirrhosis, including PHT and a hyperdynamic circulatory state (Laleman et al. 2006).
We aimed at quantifying the morphological changes of the hepatic vasculature at different time points during the TAA‐induced cirrhogenesis. Detailed anatomical data of rat livers were obtained using two complementary, recently optimized techniques, namely, vascular corrosion casting (VCC) and deep tissue microscopy (DTM) after immunofluorescence staining (Peeters et al. 2017). A quantitative description of the spatiotemporal impact of cirrhosis on the hepatic vasculature may broaden our understanding of the underlying mechanisms contributing to the increasing IHVR, which eventually leads to complications such as PHT (Laleman et al. 2006).
Materials and methods
Rat model of TAA‐induced cirrhosis
Cirrhogenesis was induced by oral administration of TAA (Sigma‐Aldrich, Bornem, Belgium). Prolonged TAA intoxication causes the stepwise process towards compensated cirrhosis (Laleman et al. 2006). At the start of the protocol, 0.03% TAA concentration was added to the drinking water. Hereafter, TAA concentrations were adapted weekly to keep individual bodyweights within the limits of 250–300 g. The study protocol was approved by the Ethical Committee of the University Hospital Leuven (Belgium).
Male Wistar rats (n = 38) were randomly divided into four groups. Each group consisted of nine animals, except for the fourth group, where two extra animals were allocated to accommodate potential mortality. The animals were kept in cages at a constant temperature and humidity in a 12‐h controlled light/dark cycle, with food and water provided ad libitum. Group 1 served as control group, allowing the baseline description of normal hepatic characteristics. Groups 2–4 underwent TAA intoxication for 6, 12, and 18 weeks, respectively. After 6 weeks of administration, histopathological characteristics corresponded to hepatitis. At 12 weeks, the advanced fibrotic stage was attained and, eventually, after 18 weeks of intoxication, animals showed homogeneous macronodular cirrhosis (Laleman et al. 2006).
At the different time points (0, 6, 12, and 18 weeks), the corresponding group (1–4, respectively) was sacrificed. Five animals of each group (six in the case of group 4) were assigned to micro‐CT (μCT) imaging after VCC to study the macrocirculation. Four animals (five in the case of group 4) were allocated to DTM after immunofluorescence staining to capture the lobule‐scale microcirculation (see Fig. 1).
Figure 1.
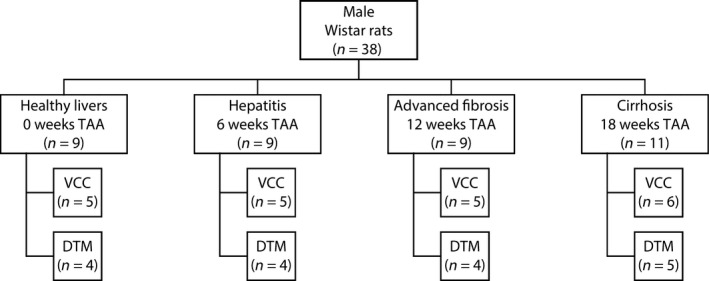
Male Wistar rats were randomly divided into four groups. Each group consisted of nine animals, except for the cirrhosis group, where two extra animals were allocated to accommodate potential mortality. Five animals of each group (six in the case of cirrhosis) were assigned to the combination of vascular corrosion casting (VCC) and micro‐CT imaging to study the macrocirculation. Four animals (five in the case of cirrhosis) were allocated to deep tissue microscopy (DTM) after immunofluorescence staining to capture the microcirculation.
μCT imaging after vascular corrosion casting
The procedure started with anaesthesia by intraperitoneal injection of 130 μL/100 g pentobarbital (Nembutal, Ceva Sante Animale, Brussels, Belgium) and careful exposure of the liver and surrounding vessels. Anticoagulation was performed through intrasplenic administration of heparin (0.3 mL; 5000 μ mL−1; Heparine Leo, Leo Pharma, Lier, Belgium). The PV and abdominal aorta (AA) were injected sequentially and manually with 30 and 20 mL of a polyurethane‐based casting resin, respectively. The resin mixture consisted of PU4ii and hardener (VasQtec, Zurich, Switzerland), ethyl methyl ketone (EMK; Merckx, Darmstadt, Germany) and colour dyes (yellow and blue for the HA and PV systems, respectively). The radiocontrast agent Lipiodol (Guerbet, Roissy‐CdG, France) was added to the AA resin to allow for clear distinction between the venous and arterial vascular trees on μCT images. The thoracic aorta and renal arteries were clamped prior to infusion to direct the resin flow. Immediately after injection, the thoracic caudal vena cava (CVC) and both inlet vessels were clamped to prevent resin leakage. The specimen was allowed to polymerize for 72 h. Afterwards, the liver tissue was macerated in potassium hydroxide (25% KOH) for approximately 5 days. The resulting cast was scanned with X‐ray imaging at a resolution of 40 μm using a high‐resolution μCT scanner developed in‐house (HECTOR, Centre for X‐ray Tomography (UGCT), Ghent University, Belgium; Masschaele et al. 2013). A more elaborate description of the VCC and μCT protocol has been described earlier (Peeters et al. 2017).
Deep tissue microscopy after immunohistochemistry
Animals were anaesthetized by intraperitoneal injection of 130 μL/100 g pentobarbital (Nembutal, Ceva Sante Animale, Brussels, Belgium) and subsequently underwent a perfusion fixation with 4% phosphate‐buffered paraformaldehyde. The liver was excised and cut into 350‐μm‐thick slices by means of a vibratome (Microm HM650V; Thermo Scientific, Waltham, MA, USA). Slices from the top (up to 2 mm from the surface) and mid (4–6 mm from the surface) region of the right medial lobe (RML) were selected for further processing.
The slices were permeabilized following a protocol adapted from Renier et al. (2014). After permeabilization, the samples were immunostained using a generic endothelial marker antibody (RECA‐1; Serotec, Kidlington, UK). The limited antibody penetration and imaging depth inherent to traditional immunohistochemistry (IHC) was tackled by applying an adapted version of the CUBIC (clear, unobstructed brain imaging cocktails and computational analysis) clearing protocol after IHC (Susaki et al. 2014). Subsequent confocal laser scanning (Nikon A1R; Nikon, Tokyo, Japan) using a 40× Plan Fluor air lens with extra‐long working distance (numerical aperture 0.6; working distance 3.6–2.8 mm; Nikon Instruments, Paris, France) provided detailed volumetric datasets of the microcirculation (voxel resolution of 0.63 × 0.63 × 1.4 μm3). The datasets were further processed and analysed using software developed in‐house. For more elaborate details on the DTM protocol, the reader is referred to Peeters et al. (2017).
Data analysis of the macrocirculation
The μCT datasets were processed using the commercial software package mimics (Materialise, Leuven, Belgium). The hepatic vascular trees (HA, PV, and HV) were semi‐automatically segmented, as their grey value ranges differed from one another in the μCT images. The arterially added contrast agent allowed the PV to be distinguished from the HA system, and also assigned a different grey value range to the HV system due to mixing of the injected AA (with contrast agent) and PV resin.
After segmentation, centrelines of the vascular trees were calculated and converted to graph structures using dedicated software (Peeters et al. 2017), which is based on tiquant (Hammad et al. 2014; Friebel et al. 2015). These graphs were used to characterize the branching topology and quantify the geometrical attributes (i.e. branch radius, length, and number of vessels). A diameter‐defined top‐down ordering method was implemented, partially based on the method used by Jiang et al. (1994), to assign generation numbers to the different branches. As opposed to Jiang, the inlet of each vascular tree (HA, PV, and HV) was assigned generation ‘1’ and daughter branches were allocated generation numbers higher than (or equal) to their parent vessel (Peeters et al. 2017).
After data classification, exponential trend lines were fitted to the morphological features (i.e. radius, length, number of vessels) as a function of their generation number. The fitting principle was similar to that of previous studies (Debbaut et al. 2012, 2014), and allowed the cirrhogenic evolution of the parameters studied to be quantified.
Data analysis of the microcirculation
Prior to microvascular segmentation, DTM datasets were post‐processed to reduce lipofuscin‐like autofluorescence, which was abundantly present from 12 weeks of TAA administration onwards. The autofluorescence was recorded separately for every sample. This autofluorescence signal was subsequently subtracted from the signal of the vasculature. Additionally, we applied contrast enhancement, eliminated imaging noise, and reattributed out‐of‐focus components (Luisier et al. 2011; Schindelin et al. 2012).
Segmentation of the microcirculation was executed automatically using software developed in‐house (Peeters et al. 2017). The segmented datasets allowed for accurate 3D reconstructions of the intertwined and interconnected blood vessels. The centrelines were calculated for each blood vessel to extract and quantify various morphological parameters. The radius was measured using a best‐fit diameter approach. This was achieved by measuring the radius in eight radially evenly distributed directions. By averaging over the eight radii, the best‐fit radius was able to account for the ellipsoidal character of blood vessels. Branch lengths were calculated as the cumulative distance between vessel intersections. The tortuosity of a branch was defined as the ratio of the total branch length to the distance between the start and end point of the branch. The 3D porosity of the vascular network was calculated as the total vascular volume divided by the volume of its envelope. More information on the segmentation and analysis pipeline can be found in (Peeters et al. 2017).
Statistical analyses were performed in rstudio (open source software). Non‐parametric Kruskal–Wallis tests were executed with Holm–Bonferroni adjustment to assess the sinusoidal remodelling during cirrhogenesis. Differences with a P‐value below 0.05 were considered statistically significant. Post hoc pairwise multiple comparison used the Conover–Iman test, which is robust for small sample sizes.
Results
Rat livers were excised and cast at different time points during cirrhogenesis, as depicted in Fig. 2(A,B). The macroscopic expression of the liver clearly evolved from normal over an irregular ‘salt & pepper’‐like appearance (6 weeks) to an emerging nodular (12 weeks) and eventually macronodular liver at 18 weeks. These changing appearances were accurately captured by the casting procedure, as nodules appeared at the liver surface from 12 weeks onwards.
Figure 2.
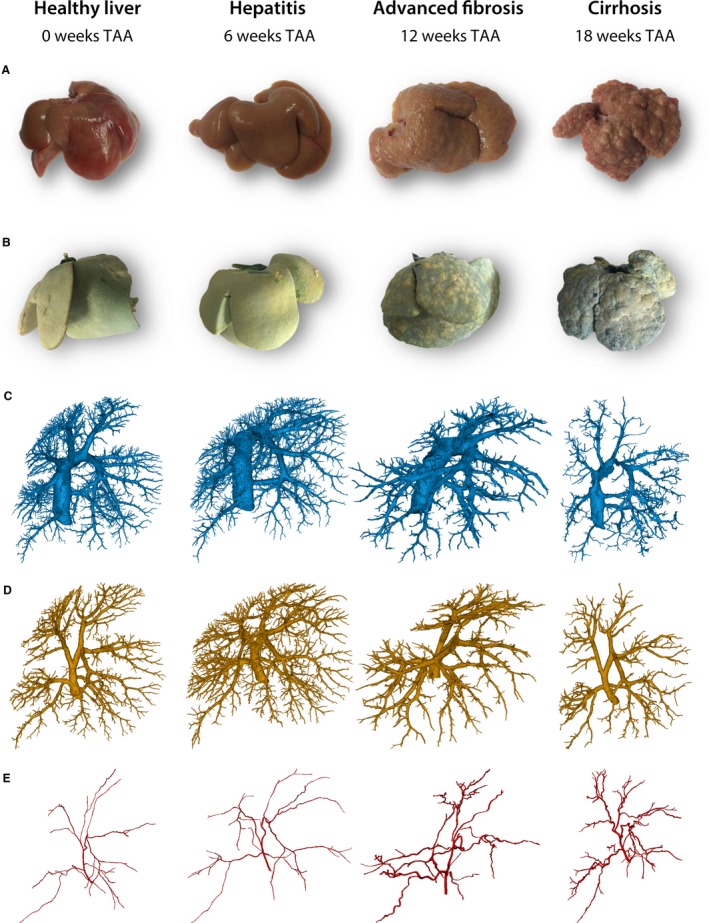
(A) Rat livers were excised at different time points during cirrhogenesis. The macroscopic expression of the liver transformed from normal over an irregular ‘salt & pepper’‐like appearance at 6 weeks to an emerging nodular liver at 12 weeks and eventually macronodular liver at 18 weeks. (B) Vascular replicas obtained using vascular corrosion casting. Blue pigmented resin was injected via the portal vein (PV) and yellow dye was added to the arterial resin. (C–E) Macroscopic 3D reconstructions of the hepatic veins, the PV, and the hepatic artery, respectively.
Macrocirculation
Cirrhosis mainly affects the hepatic venous vessels
For each time point, two liver casts were processed down to a 3D reconstruction of all vascular trees (HA, PV, and HV; Fig. 2C–E). From 12‐week intoxication onwards, the continuously growing regenerative nodules started to compress their surroundings mechanically. The pliant HV branches were largely affected by this mechanical compression, and even appeared to collapse, as evidenced from the scanned casts (Fig. 3A). In the cirrhotic stage, the PV system was also affected by the nodular compression, albeit to a lesser extent, and several portosystemic shunt vessels were detected, connecting the trunk of PV with the CVC (Fig. 3B, colour‐coded in magenta). Furthermore, we observed that HA branches became more tortuous due to cirrhosis, as sudden sharp bends appeared which were not observed in the control group (Fig. 3C). However, the HA cross‐sections remained unaffected by the nodular compression, most likely because arterial vessel walls include a thick muscle layer.
Figure 3.
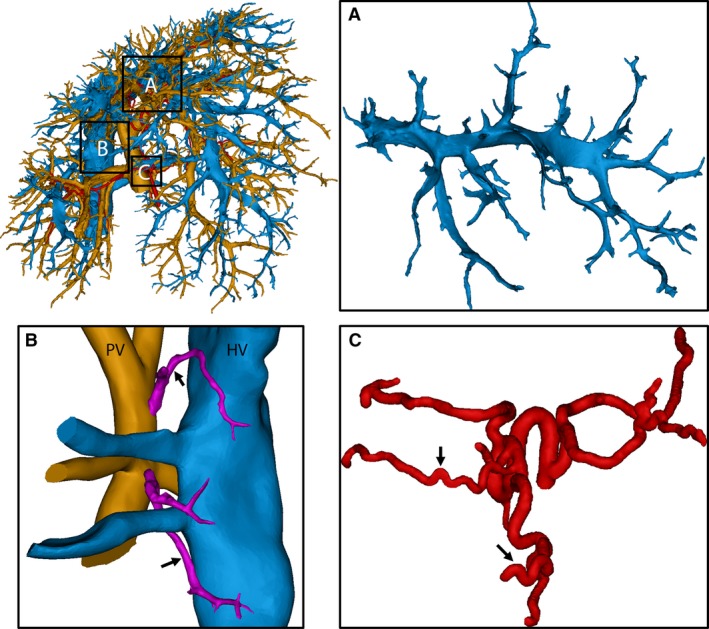
3D reconstruction of the macrocirculation of a cirrhotic rat liver (18 weeks). (A) The amendable hepatic veins (HV) in the middle medial lobe were significantly compressed by regenerative nodules and some branches even appeared to collapse. (B) Portosystemic shunts were detected (arrows), shunting directly from the root of the portal vein (PV) into the HV (caudal vena cava). Branching trees from the PV and HV were cut to provide a better view of the shunts. (C) Due to cirrhosis, arterial branches became more tortuous, resulting in sudden sharp bends (arrows).
Regenerative nodules mechanically compress the hepatic venous trees
The vascular trees were classified according to their diameter‐defined branching topology. Due to the restricted μCT resolution (40 μm), fewer blood vessel generations were measured for the HA systems, as HA branches normally have smaller diameters than venous branches. For each generation, the mean radius, length, and number of vessels were measured (Fig. 4).
Figure 4.
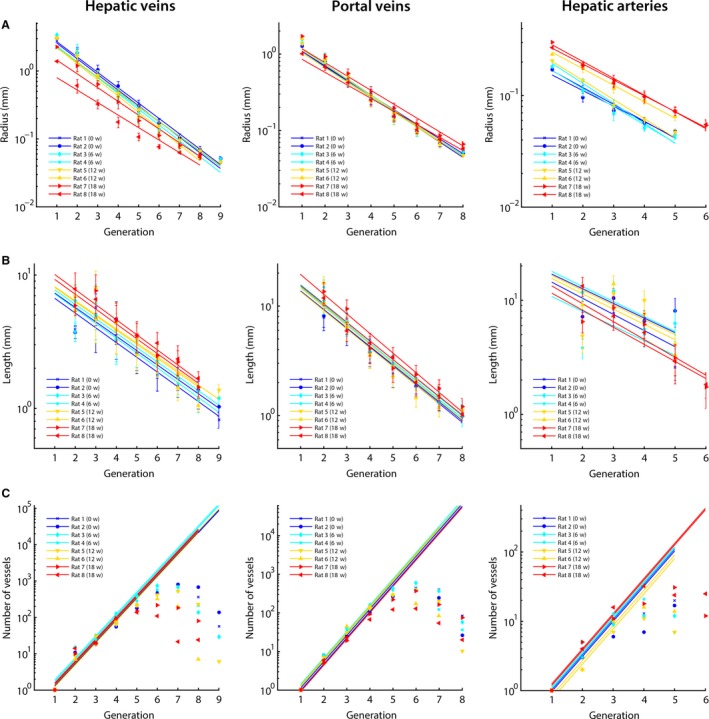
The hepatic macrovascular trees – hepatic veins (HV), portal vein (PV), and hepatic artery (HA) – were classified according to their diameter‐defined branching topology. For each liver intoxicated with thioacetamide during different weeks (0, 6, 12, and 18 weeks), (A) the mean radius, (B) the mean length, and (C) the number of vessels were measured as a function of the generation number and exponential trend lines were fitted. For the number of vessels, trends lines were fitted based on the first four generations of the PV and HV (and three for the HA). In this way, an inaccuracy of the number of vessels due to under‐segmentation was limited. The trend lines clearly illustrate the impact of cirrhosis on the HV, with mean diameters nearly halving across the first generations due to the mechanical compression of regenerative nodules and fibrous tissue. The HA, on the other hand, dilated with increasing intoxication time. We did not observe any trends during cirrhogenesis for the number of vessels and length as function of the generation number.
At the 6‐week time point, all vascular trees (HA, PV, and HV) appeared unaffected, as their morphological parameters (i.e. radii, length, and number vessels) were comparable to control values. From the 12‐week time point, when regenerative nodules began to grow in expansive manner, radii of the HV gradually decreased. Illustrative is the significant decline of the CVC radius, dropping from 3.01 mm (healthy) to 1.39 mm (most severe case of cirrhosis; see Supporting Information Table S1).
The PV system was less affected by cirrhosis. The PV inlet radius marginally dilated from 1.28 mm (rats 1 and 2) to 1.71 mm (rat 7) with increasing intoxication time. However, in rat 8 (presumably a more advanced cirrhotic stage), the PV inlet radius narrowed to 1.01 mm (shown in Supporting Information Table S2). Furthermore, a clear widening of the arterial tree was measured during cirrhogenesis, as the HA inlet radius dilated from 1.71 × 10⁻¹ mm (rat 2) to 3.01 × 10⁻¹ mm (rat 7; depicted in Supporting Information Table S3).
We did not observe any trends during cirrhogenesis for the number of vessels and length as a function of the generation number. The mean lengths did not even show clear‐cut declining trends in the first generation(s), but did start to decrease in later generations. Moreover, the length of the first generation was underestimated, as it was partially cut during resection of the liver. Hence, the length of the first generation was not considered when fitting the trend lines in Fig. 4(B).
Microcirculation
Cirrhogenesis instigates remodelling of the microcirculation
For each time point, 10 to maximally 13 DTM samples (randomly selected from four livers with a minimum of two samples/liver) were post‐processed, 3D reconstructed, and subjected to pairwise comparison (Fig. 5A,B). For the 12‐ and 18‐week samples, we differentiated between sinusoids in regenerative nodules and shunt vessels in the fibrotic septa, both constituting the microcirculation. This was achieved by pre‐imaging the slices at a lower resolution (2.48 μm; ×10 magnification), allowing the visual recognition of nodules and vascularized septa. Samples of their respective microcirculation were subsequently gathered by scanning both structures separately at a higher resolution (0.63 μm; ×40 magnification).
Figure 5.
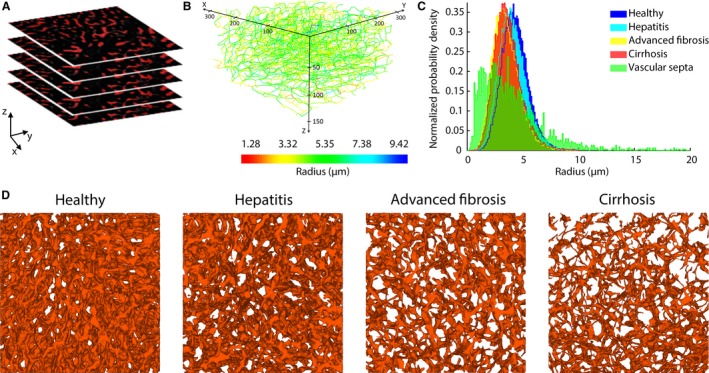
(A) Example of a stack of 2D images acquired through deep tissue microscopy (DTM) after immunohistochemistry. (B) The dataset was automatically processed to segment the sinusoidal network and convert it to a graph. Here, the network graph is coloured according to the mean radius of the branches. The graph allowed other morphological parameters to be extracted, including the length, tortuosity, and porosity. (C) Histograms of the sinusoidal radii during the different cirrhogenic stages. The values visibly shift to the left, when progressing from a normal to cirrhotic liver. At 12 and 18 weeks, we differentiated between the sinusoids in regenerative nodules and the microvascular vessels in the vascular septa. These vascular septa comprised a substantial number of smaller vessels, but also a considerable number of large shunt vessels (diameter > 10 μm). (D) 3D reconstructions of the intricate sinusoidal network obtained with DTM (140‐μm‐thick samples) for the different time points. The porosity (= volume of blood vessels per volume unit) of the depicted samples steadily declined from 19% (normal) to 16% (hepatitis) to 9% (advanced fibrosis) to 7% (cirrhosis).
Histograms of the sinusoidal radii during disease progression are depicted in Fig. 5C. The mean radius decreased from 4.41 ± 0.23 μm in the control animals to 3.91 ± 0.47 μm at week 18 (P = 0.0006). In addition, the porosity (i.e. the sinusoidal volume per unit of volume) steadily declined from 20.45 ± 1.92% (control) to 11.33 ± 3.06% (week 18; P < 10−5; see Fig. 5D). The sinusoidal tortuosity and length increased slightly but significantly (P < 10−4) during cirrhogenesis, going from 1.12 ± 0.01 to 1.19 ± 0.05 and 18.71 ± 0.83 μm to 24.52 ± 4.39 μm, respectively from week 0 to week 18 (see Fig. 6).
Figure 6.
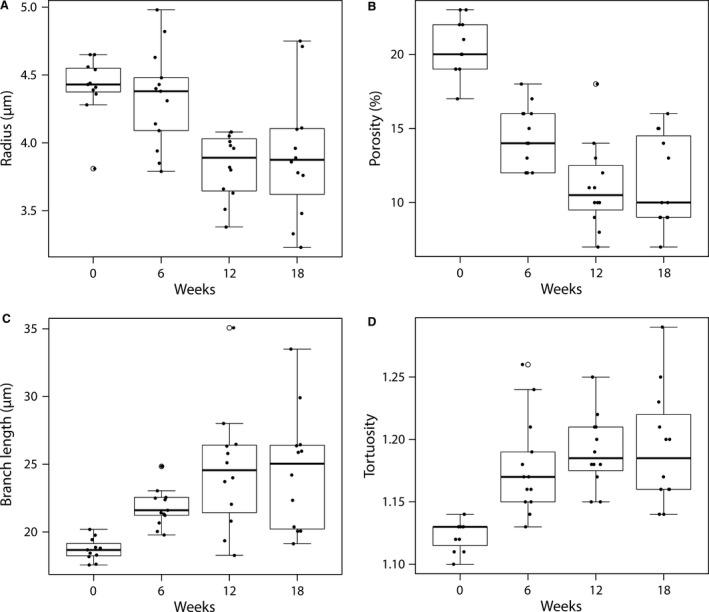
Boxplots for (A) the radius, (B) the porosity, (C) the branch length, and (D) the tortuosity of the microcirculation as function of TAA intoxication time. The radius and porosity differed significantly between healthy (week 0) and cirrhotic livers (week 18; P < 0.05). Both parameters decreased gradually during the cirrhogenic progression, and as such contributed to the increased intrahepatic vascular resistance. On the other hand, the sinusoidal tortuosity and length increased only slightly, though still significantly, when going from healthy to cirrhotic livers.
Cirrhosis specifically affects the sinusoidal network zone
Samples sectioned near the top (n ≥ 5) were compared with samples located in the middle of the RML (n ≥ 5). We found that sinusoids situated in the core of the lobe typically had larger radii and appeared less affected by the cirrhogenic process compared with those near the surface (Fig. 7). Pairwise comparison of the 18‐week samples demonstrated significantly different radii in these two zones (P = 0.048). Variations between the porosity of mid‐ and top‐located samples existed but did not vary significantly. Similar observations were made for the branch length and tortuosity.
Figure 7.
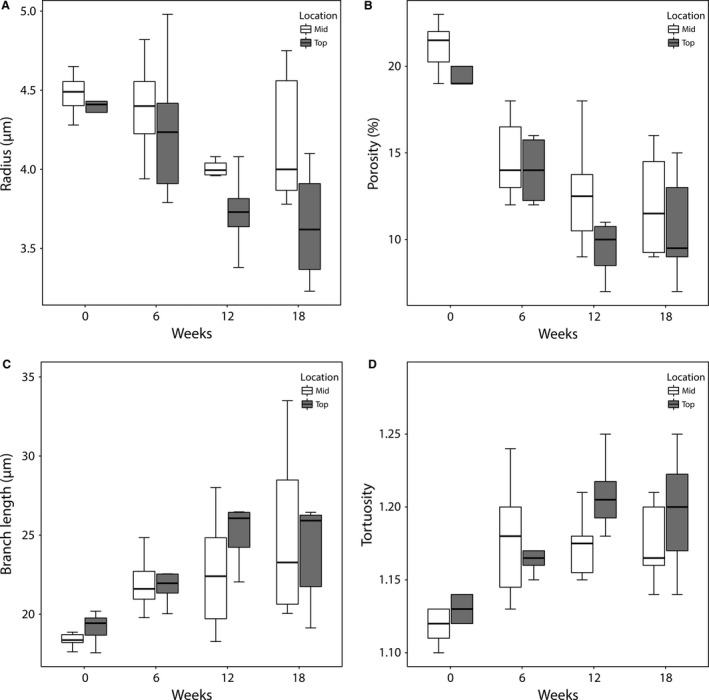
Boxplots for (A) the radius, (B) the porosity, (C) the branch length, and (D) the tortuosity of the microcirculation as function of TAA intoxication time and location within the lobe. Slices (350 μm) were taken near the top (up to 2 mm from the surface) and mid (4–6 mm from the surface) region of the right medial lobe (RML). Sinusoids situated in the core of the lobe appeared to be less affected by the cirrhogenic process, as their mean radii and porosity were typically larger than those near the surface. When comparing the 18‐week intoxicated samples pairwise, the radii differed significantly between the top and mid region (P = 0.048).
Cirrhosis is characterized by the formation of highly vascularized fibrous septa
We analysed several samples consisting primarily of vascular septa in the case of cirrhosis (n = 3) and compared their radial histogram with those of cirrhotic sinusoids (Fig. 5D). The skewed distribution of the vascular septa indicated the presence of very large blood vessels (radius > 10 μm) acting as intrahepatic shunts. The septa also comprised a substantial amount of smaller intertwined blood vessels, which probably originated to support blood supply. Both vessel types were embedded in fibrotic tissue and thus were separated from the hepatocytes. They acted as bypasses guiding the blood flow directly from the portal tract into the central vein.
Discussion
To the best of our knowledge,the present study is the first to analyse the main remodelling events of the hepatic vascular architecture during TAA cirrhogenesis in rat. Solely using static techniques (VCC and DTM), we were able to study and quantify the dynamic transition of this pathological process. At four discrete time points during the progression toward cirrhosis, VCC and DTM were used to capture, 3D reconstruct, and morphologically analyse the intricate hepatic vasculature across multiple length scales. Our data demonstrated various anatomical abnormalities attributable to cirrhosis, which are likely to underlie the increase of total IHVR as previously characterized haemodynamically in this model and at the same given time points (Laleman et al. 2006).
With VCC, we examined the circulatory changes at the macrolevel. From 12 weeks of TAA intoxication onwards, regenerative nodules started to grow in an expansive manner. It is commonly assumed that this tissue growth exerts a compressive force on the surrounding blood vessels (Fig. 3). This compression narrowed the pliant venous systems (PV and HV); we found that HVs were especially impacted by this compression, with collapsed vessel segments severely impeding hepatic outflow (Fig. 4). The mean diameters of the HV across the first generations nearly halved. As resistance of a vessel scales inversely with its radius to the fourth power following Poiseuille's law, it is not surprising that an increase of the total IHVR was documented in TAA‐induced cirrhotic livers (Laleman et al. 2006).
Furthermore, the HA dilated with increasing intoxication time. The diameter of the PV most likely increased up until the moment the mechanical impact of the regenerative nodules outweighed the internal portal pressure and forced the PV to narrow, as observed in rat 8 (more advanced stage of cirrhosis). While the morphology of the PV system appeared only slightly affected by cirrhosis, the progressive narrowing of the HV vasculature most likely increased the overall IHVR and, hence, impeded portal flow. This impediment may have retrogradely increased the pressure in the PV through congestion, leading to PHT (Laleman et al. 2006). PHT is the earliest and most prominent complication observed in patients with cirrhosis. Many of the lethal complications related to cirrhosis commence in the setting of worsening PHT (Pinzani et al. 2011).
At the microscopic level, sinusoidal remodelling was abundantly present. Capillarization and the impaired intrahepatic balance between vasodilators and vasoconstrictors presumably caused the diameters and number of sinusoids to decrease (Thabut & Shah, 2010). We observed that from 12 weeks onwards, the microvascular porosity and sinusoidal radii significantly differed from control data at week 0 (Figs 5D and 6A,B). Even though macrocirculatory changes were still limited, PHT was already measured at 12 weeks, as documented earlier in the animal model (Laleman et al. 2006). This suggests that the increase of the IHVR is initiated at the microlevel and is further aggravated by alterations at the macroscale later on. At 18 weeks, PHT became associated with a hyperdynamic circulatory state (another pathophysiological hallmark of cirrhosis), which may have contributed further to the increasing portal pressure (Laleman et al. 2006).
At 18 weeks of TAA intoxication, the presence of complete fibrous vascularized septa, encapsulating the growing regenerative nodules, has been reported (Laleman et al. 2006). In the present work, we observed that these portal‐portal and portal‐central septa comprised a considerable amount of small vessels as well as larger intrahepatic shunt vessels (Fig. 5C). Additionally, intrahepatic portosystemic shunts were detected between the trunk of the PV and CVC (Fig. 3C). Although these shunts may represent anatomical variations, we hypothesize that they spontaneously developed in an attempt to alleviate the elevated portal pressures. Consequently, large amounts of blood are shunted directly into the systemic circulation without contact with the hepatocytes, incapacitating, as such, synthetic and detoxification liver functions. We only observed these portosystemic shunts in cirrhotic rat livers, most likely due to the presence of severe PHT. The formation of abnormal portosystemic collaterals is not uncommon in patients with cirrhosis (Wu et al. 2015). In rare cases, cirrhotic patients may even experience the recanalization of the umbilical vein, acting as a decompressive portosystemic shunt (Aagaard et al. 1982).
Although the workflow of this study is straightforward, some aspects are very labour‐intensive and time‐consuming. This is particularly the case for the segmentation of the μCT datasets of the vascular corrosion casts, which is the reason only two liver casts were fully segmented for each cirrhogenic stage. Therefore, the reported numerical data must be considered only to be indicative. Moreover, liver casts should ideally be μCT‐scanned at a sufficiently high resolution to allow the HA to be reconstructed accurately up to the same generation as the PV. As diameters of HA branches are typically smaller than PV branches, this was technically impossible with the current computational capabilities. As a consequence, the number of HA vessels for higher generation was most likely underestimated, as smaller ramifying branches remained undetected. Because the HA runs in parallel with the PV, we can only assume that the number of vessels should be at least equal to or even higher (due to PV being flanked by more than one parallel HA vessels) than the PV (Debbaut et al. 2014).
The hypothesis that the casting resin caused significant tissue shrinkage was discredited (Krucker et al. 2006; Meyer et al. 2007; Debbaut et al. 2014). We presumed that the known shrinkage of the cast resin was compensated by the pressure exerted during the injection of the polymer. Although we did not measure the injection pressure, we ensured that all livers were cast in a consistent way according to a standardized protocol. Moreover, as the intrahepatic vascular resistance progressively increased during cirrhogenesis and livers were of varying sizes, maintaining a uniform injection pressure for all livers would most likely not have sufficed to perfuse all liver lobes adequately, or could have even destroyed others. For this reason, the resin was injected manually by a continuous pressure, which was assured through the air buffer in the syringe, until resin emerged from the vena cava inferior. In addition, the heat generated during PU4ii polymerization was negligible.
Conclusion
The degenerative adaptation of the rat hepatic vasculature was assessed and quantified during the genesis of TAA‐induced cirrhosis. At four predefined time points, two experimental techniques (VCC and DTM) were used to capture and reconstruct the rat‐specific hepatic vasculature across different scales, ranging from the largest blood vessels down to the sinusoids. The complementarity of both techniques provided a comprehensive overview of the detrimental impact of cirrhosis on the vasculature. Moreover, our data shed light on the irreversible component behind the progressive increase of the IHVR, which was haemodynamically characterized earlier at similar time points and in the same model (Laleman et al. 2006). The combined impact of this work, both haemodynamically and angioarchitecturally, might be of interest for targeted liver interventions pharmaceutically, surgically, and angiographically.
Supporting information
Table S1. The macroscopic hepatic veins were classified according to their diameter‐defined branching topology at different time points during cirrhogenesis.
Table S2. The macroscopic portal veins were classified according to their diameter‐defined branching topology at different time points during cirrhogenesis.
Table S3. The macroscopic hepatic arteries were classified according to their diameter‐defined branching topology at different time points during cirrhogenesis.
Acknowledgements
This work was supported by the Agency for Innovation by Science and Technology in Flanders (Strategic Basic Research IWT 131446) and the University of Antwerp (TTBOF/29267), and was in part funded via a BASL Research Grant.
References
- Aagaard J, Jensen LI, Sorensen T, et al. (1982) Recanalized umbilical vein in portal hypertension. Am J Roentgenol 139, 1107–1110. [DOI] [PubMed] [Google Scholar]
- Alexander B, Cottam H, Naftalin R (2001) Hepatic arterial perfusion regulates portal venous flow between hepatic sinusoids and intrahepatic shunts in the normal rat liver in vitro . Pflugers Arch 443, 257–264. [DOI] [PubMed] [Google Scholar]
- Anthony PP, Ishak KG, Nayak NC, et al. (1978) The morphology of cirrhosis. Recommendations on definition, nomenclature, and classification by a working group sponsored by the World Health Organization. J Clin Pathol 31, 395–414. [DOI] [PMC free article] [PubMed] [Google Scholar]
- Bhargava P, Vaidya S, Kolokythas O, et al. (2011) Pictorial review. Hepatic vascular shunts: embryology and imaging appearances. Br J Radiol 84, 1142–1152. [DOI] [PMC free article] [PubMed] [Google Scholar]
- Bodner G, Peer S, Karner M, et al. (2002) Nontumorous vascular malformations in the liver: color Doppler ultrasonographic findings. J Ultrasound Med 21, 187–197. [DOI] [PubMed] [Google Scholar]
- Braet F, Wisse E (2002) Structural and functional aspects of liver sinusoidal endothelial cell fenestrae: a review. Comp Hepatol 1, 1–17. [DOI] [PMC free article] [PubMed] [Google Scholar]
- Debbaut C (2013) Multi‐Level Modelling of Hepatic Perfusion in Support of Liver Transplantation Strategies. Ghent: Ghent University. [DOI] [PubMed] [Google Scholar]
- Debbaut C, de Wilde D, Casteleyn C, et al. (2012) Modeling the impact of partial hepatectomy on the hepatic hemodynamics using a rat model. IEEE Trans Biomed Eng 59, 3293–3303. [DOI] [PubMed] [Google Scholar]
- Debbaut C, Segers P, Cornillie P, et al. (2014) Analyzing the human liver vascular architecture by combining vascular corrosion casting and micro‐CT scanning: a feasibility study. J Anat 224, 509–517. [DOI] [PMC free article] [PubMed] [Google Scholar]
- Friebel A, Neitsch J, Johann T, et al. (2015) TiQuant: software for tissue analysis, quantification and surface reconstruction. Bioinformatics 31, 3234–3236. [DOI] [PubMed] [Google Scholar]
- Hammad S, Hoehme S, Friebel A, et al. (2014) Protocols for staining of bile canalicular and sinusoidal networks of human, mouse and pig livers, three‐dimensional reconstruction and quantification of tissue microarchitecture by image processing and analysis. Arch Toxicol 88, 1161–1183. [DOI] [PMC free article] [PubMed] [Google Scholar]
- Hano H, Takasaki S (2003) Three‐dimensional observations on the alterations of lobular architecture in chronic hepatitis with special reference to its angioarchitecture for a better understanding of the formal pathogenesis of liver cirrhosis. Virchows Arch 443, 655–663. [DOI] [PubMed] [Google Scholar]
- Hu LS, George J, Wang JH (2013) Current concepts on the role of nitric oxide in portal hypertension. World J Gastroenterol 19, 1707–1717. [DOI] [PMC free article] [PubMed] [Google Scholar]
- Huet PM, Goresky CA, Villeneuve JP, et al. (1982) Assessment of liver microcirculation in human cirrhosis. J Clin Invest 70, 1234–1244. [DOI] [PMC free article] [PubMed] [Google Scholar]
- Ismail MH, Pinzani M (2009) Reversal of liver fibrosis. Saudi J Gastroenterol 15, 72–79. [DOI] [PMC free article] [PubMed] [Google Scholar]
- Jiang ZL, Kassab GS, Fung YC (1994) Diameter‐defined Strahler system and connectivity matrix of the pulmonary arterial tree. J Appl Physiol 76, 882–892. [DOI] [PubMed] [Google Scholar]
- Kassissia I, Brault A, Huet PM (1994) Hepatic artery and portal vein vascularization of normal and cirrhotic rat liver. Hepatology 19, 1189–1197. [PubMed] [Google Scholar]
- Kline TL, Knudsen BE, Anderson JL, et al. (2014) Anatomy of hepatic arteriolo‐portal venular shunts evaluated by 3D micro‐CT imaging. J Anat 224, 724–731. [DOI] [PMC free article] [PubMed] [Google Scholar]
- Krucker T, Lang A, Meyer EP (2006) New polyurethane‐based material for vascular corrosion casting with improved physical and imaging characteristics. Microsc Res Tech 69, 138–147. [DOI] [PubMed] [Google Scholar]
- Laleman W, Landeghem L, Wilmer A, et al. (2005) Portal hypertension: from pathophysiology to clinical practice. Liver Int 25, 1079–1090. [DOI] [PubMed] [Google Scholar]
- Laleman W, Vander Elst I, Zeegers M, et al. (2006) A stable model of cirrhotic portal hypertension in the rat: thioacetamide revisited. Eur J Clin Invest, 36, 242–249. [DOI] [PubMed] [Google Scholar]
- Levy ADMK, Yeh BM (2015) Gastrointestinal Imaging. Oxford UK: Oxford University Press. [Google Scholar]
- Luisier F, Blu T, Unser M (2011) Image denoising in mixed Poisson‐Gaussian noise. IEEE Trans Image Process 20, 696–708. [DOI] [PubMed] [Google Scholar]
- Lutz J, Knoess N, Coakley FV, et al. (2004) Intrahepatic portal‐to‐portal venous shunts in cirrhosis: a potential mimic of hepatocellular carcinoma. J Comput Assist Tomogr 28, 520–522. [DOI] [PubMed] [Google Scholar]
- Masschaele B, Dierick M, van Loo D, et al. (2013) HECTOR: a 240 kV micro‐CT setup optimized for research. J Phys: Conf Ser 463, 012012. [Google Scholar]
- Meyer EP, Beer GM, Lang A, et al. (2007) Polyurethane elastomer: a new material for the visualization of cadaveric blood vessels. Clin Anat 20, 448–454. [DOI] [PubMed] [Google Scholar]
- Mokdad AA, Lopez AD, Shahraz S, et al. (2014) Liver cirrhosis mortality in 187 countries between 1980 and 2010: a systematic analysis. BMC Med 12, 1–24. [DOI] [PMC free article] [PubMed] [Google Scholar]
- Mori H, Hayashi K, Fukuda T, et al. (1987) Intrahepatic portosystemic venous shunt: occurrence in patients with and without liver cirrhosis. AJR Am J Roentgenol 149, 711–714. [DOI] [PubMed] [Google Scholar]
- Peeters G, Debbaut C, Laleman W, et al. (2017) A multilevel framework to reconstruct anatomical 3D models of the hepatic vasculature in rat livers. J Anat 230, 471–483. [DOI] [PMC free article] [PubMed] [Google Scholar]
- Pinzani M, Rosselli M, Zuckermann M (2011) Liver cirrhosis. Best Pract Res Clin Gastroenterol 25, 281–290. [DOI] [PubMed] [Google Scholar]
- Renier N, Wu Z, Simon DJ, et al. (2014) iDISCO: a simple, rapid method to immunolabel large tissue samples for volume imaging. Cell 159, 896–910. [DOI] [PubMed] [Google Scholar]
- Schindelin J, Arganda‐Carreras I, Frise E, et al. (2012) Fiji: an open‐source platform for biological‐image analysis. Nat Methods 9, 676–682. [DOI] [PMC free article] [PubMed] [Google Scholar]
- Susaki EA, Tainaka K, Perrin D, et al. (2014) Whole‐brain imaging with single‐cell resolution using chemical cocktails and computational analysis. Cell 157, 726–739. [DOI] [PubMed] [Google Scholar]
- Thabut D, Shah V (2010) Intrahepatic angiogenesis and sinusoidal remodeling in chronic liver disease: new targets for the treatment of portal hypertension? J Hepatol 53, 976–980. [DOI] [PubMed] [Google Scholar]
- Tsochatzis EA, Bosch J, Burroughs AK (2014) Liver cirrhosis. Lancet 383, 1749–1761. [DOI] [PubMed] [Google Scholar]
- Van Steenkiste C (2010) The Role of the Placental Growth Factor (PIGF) in the Pathophysiology of Portal Hypertension and Cirrhosis. Ghent: Ghent University. [Google Scholar]
- Vanheule E, Geerts AM, van Huysse J, et al. (2008) An intravital microscopic study of the hepatic microcirculation in cirrhotic mice models: relationship between fibrosis and angiogenesis. Int J Exp Pathol 89, 419–432. [DOI] [PMC free article] [PubMed] [Google Scholar]
- Wu Q, Shen L, Chu J, et al. (2015) Characterization of uncommon portosystemic collateral circulations in patients with hepatic cirrhosis. Oncol Lett 9, 347–350. [DOI] [PMC free article] [PubMed] [Google Scholar]
- Yamamoto T, Kobayashi T, Phillips MJ (1984) Perinodular arteriolar plexus in liver cirrhosis. Scanning electron microscopy of microvascular casts. Liver 4, 50–54. [DOI] [PubMed] [Google Scholar]
Associated Data
This section collects any data citations, data availability statements, or supplementary materials included in this article.
Supplementary Materials
Table S1. The macroscopic hepatic veins were classified according to their diameter‐defined branching topology at different time points during cirrhogenesis.
Table S2. The macroscopic portal veins were classified according to their diameter‐defined branching topology at different time points during cirrhogenesis.
Table S3. The macroscopic hepatic arteries were classified according to their diameter‐defined branching topology at different time points during cirrhogenesis.


