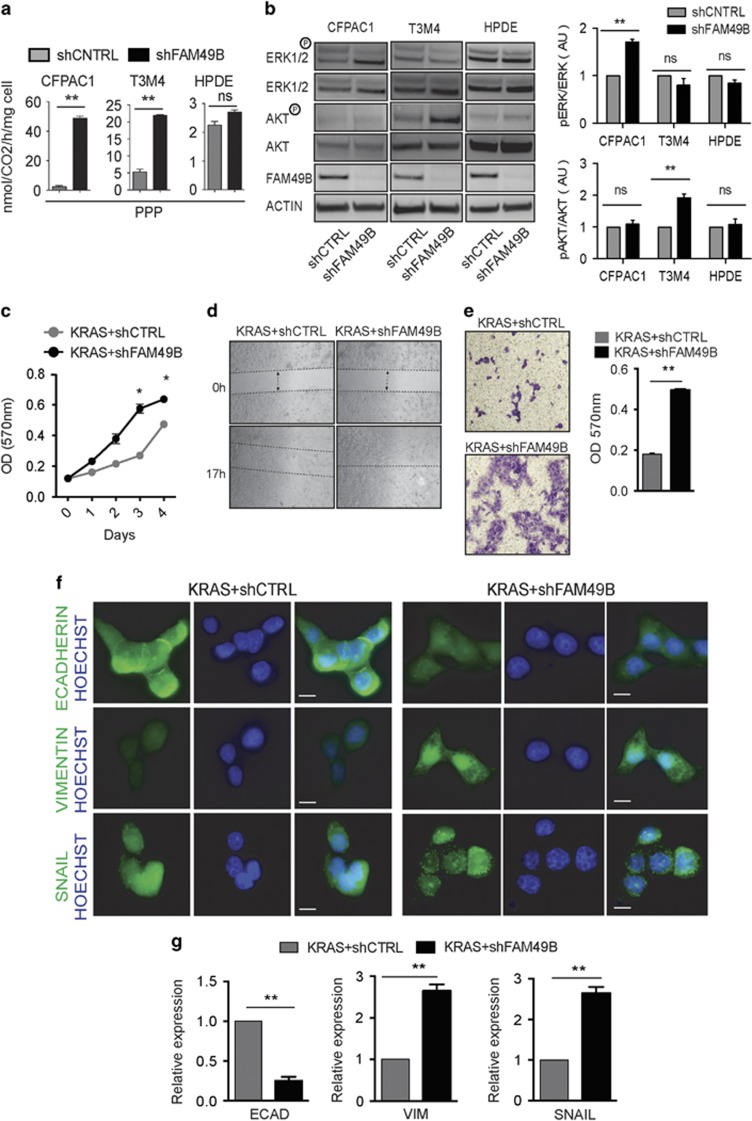
Figure 7.
FAM49B downregulation enhances KRAS tumorigenesis. (a) Analysis of PPP flux in the shCTRL and shFAM49B CFPAC1, T3M4 cell lines. Data are shown as the mean±s.e.m. of three independent experiments. (b) ERK1/2 and AKT phosphorylation in shCTRL or shFAM49B cells was assessed by SDS–PAGE/ WB. Actin was used as a loading control. (c) shCTRL (gray circles) and shFAM49B (black circles) HPDE KRAS cell proliferation was evaluated by MTT assay. Data are shown as the mean±s.e.m. OD at 570 nm of three independent experiments. (d) Wound-healing assays of shCTRL and shFAM49B HPDE KRAS cells. The dotted lines indicate the wound edge at 0 h. Migration of individual cells over 18–24 h, which was represented as wound closure percentage bars representing the mean±s.d. of three experiments, was tracked using ImageJ. (e) Statistical analysis of the results of Matrigel invasion assays of shCTRL and shFAM49B cells. The results are expressed as the mean±s.e.m. of three independent experiments. (f) Cells co-stained with antibodies to various markers of EMT (green) and cell nuclei stained with Hoechst (blue), as demonstrated by immunofluorescence scale bar represent 10-μm. (g) Expression of various EMT markers, as demonstrated by real-time PCR in shCTRL and shFAM49B HPDE KRAS cells. Actin was used as a reference gene. All graphs illustrate the mean results of three independent experiments±s.e.m. (*P<0.05, **P<0.001, ***P<0.0001, Student’s t-test).

