

Abstract
Purpose: To compare the efficiency of an aerobic physical training program prescribed according to either velocity associated with maximum oxygen uptake (vVO2max) or peak running speed obtained during an incremental treadmill test (Vpeak_K) in mice.
Methods: Twenty male Swiss mice, 60 days old, were randomly divided into two groups with 10 animals each: 1. group trained by vVO2max (GVO2), 2. group trained by Vpeak_K (GVP). After the adaptation training period, an incremental test was performed at the beginning of each week to adjust training load and to determine the amount of VO2 and VCO2 fluxes consumed, energy expenditure (EE) and run distance during the incremental test. Mice were submitted to 4 weeks of aerobic exercise training of moderate intensity (velocity referring to 70% of vVO2max and Vpeak_K) in a programmable treadmill. The sessions lasted from 30 to 40 min in the first week, to reach 60 min in the fourth week, in order to provide the mice with a moderate intensity exercise, totaling 20 training sessions.
Results: Mice demonstrated increases in VO2max (ml·kg−1·min−1) (GVO2 = 49.1% and GVP = 56.2%), Vpeak_K (cm·s−1) (GVO2 = 50.9% and GVP = 22.3%), EE (ml·kg−0,75·min−1) (GVO2 = 39.9% and GVP = 51.5%), and run distance (cm) (GVO2 = 43.5% and GVP = 33.4%), after 4 weeks of aerobic training (time effect, P < 0.05); there were no differences between the groups.
Conclusions: Vpeak_K, as well as vVO2max, can be adopted as an alternative test to determine the performance and correct prescription of systemized aerobic protocol training to mice.
Keywords: treadmill, incremental test, running, training programs, exercise test
Introduction
The prescription of physical training in mice presents a great challenge owing to the large variety of available testing protocols (Kemi et al., 2002; Ferreira et al., 2007; Ayachi et al., 2016). In particular, running protocols are often used in research involving small rodents because they generally allow the intensity and volume of physical training to be manipulated more easily (Kregel et al., 2007).
Most of the available protocols are adapted from those applied and already tested for prescribed training in humans (Ayachi et al., 2016). Therefore, some variables used to predict human performance, such as maximal oxygen uptake (VO2max), velocity associated with its occurrence (vVO2max), thresholds related to blood lactate response (lactate threshold, anaerobic threshold, and maximal lactate steady state [MLSS]), and maximum running speed (Vpeak) (Morgan et al., 1989; Bassett and Howley, 2000; Stratton et al., 2009) have also been used in several animals studies with the aim of reproducing the models already developed to evaluate and monitor training performance and prescription in humans (Carvalho et al., 2005; Ferreira et al., 2007; Manoel et al., 2017).
The most classical training prescription method for aerobic training in humans is based on tests using VO2max (ACSM, 2011), which represents the highest rate at which oxygen is extracted in the lungs, transported, and used by the body during maximal exercise (Bassett and Howley, 2000), however, it cannot considered the best predictor of performance (Noakes et al., 1990). In order to more accurately predict endurance performance, vVO2max has emerged and is defined as the minimum velocity at which VO2max is reached in an incremental exercise protocol (Daniels et al., 1984; Morgan et al., 1989; Billat et al., 1994, 1999; Buchheit et al., 2010; Rodrigues et al., 2017).
Although VO2max and vVO2max are consolidated variables to predict performance and to monitor and prescribe aerobic training, their determination requires the use of gas analyzers and a team of researchers familiarized with such instruments, periodic calibration, and high cost. This is true whether the tests are performed in humans or rodents (Fernando et al., 1993; Wisløff et al., 2001). Therefore, reliable and less costly alternatives have been tested and validated for training prescription, such as peak running speed (Vpeak), defined as the maximum velocity reached during an incremental test (Machado et al., 2013). This parameter is strongly correlated with endurance performance in human runners (di Prampero, 1986; Wisløff et al., 2001; Machado et al., 2007; Marcaletti et al., 2011) and presents a good correlation with VO2max.
However, a comparison of training prescriptions and monitoring according to vVO2max and Vpeak has not been performed and validated in mice. Such a study may help in reducing the cost and increasing the practicality of training prescription in this animal model. With the above in mind, the aim of this study was to compare the efficiency of an aerobic physical training program prescribed according to either vVO2max or Vpeak_K in mice. Our hypothesis was that Vpeak_K, as well as vVO2max, can be used for training prescription to mice, with the advantage of not requiring expensive equipment.
Materials and methods
Animals and experimental design
Twenty Swiss male mice, 60 days old, acquired from the State University of Maringá (UEM), were maintained in individual polypropylene cages, lined with shavings and cleaned weekly, in an automated room for photoperiod control light-dark cycle 12/12-h at 20 ± 24°C. The mice were allowed to feed (Nuvilab Cr1®) and drink water ad libitum and food intake and body weight were measured weekly and at the end of the experiment. All procedures were previously approved by the Ethics Committee in Animal Research of the State University of Maringá (UEM) (Maringá, Paraná, Brazil) (protocol n° 033/2014).
Mice were randomly divided into two groups with 10 animals each: a group trained by vVO2max (GVO2) and another group trained by Vpeak_K (GVP). Mice were submitted to familiarization and adaptation to running exercise on a treadmill for 3 days, at an initial velocity of 8 cm·s−1 until reaching 16 cm·s−1, with an initial duration of 20 min until reaching 30 min.
Incremental test
The same incremental test was used for the determination of VO2max, vVO2max, and Vpeak_K, assessed on a motorized treadmill (Panlab®, Barcelona, Spain), adapted from the protocol proposed by Machado et al. (2013) in humans. The warm-up period lasted 5-min at 10 cm·s−1, with an initial velocity of 19 cm·s−1, followed by an increase of 9 cm·s−1, every 3 min until exhaustion, which was characterized by the animal incapacity to keep running in the final third of the streak for more than 10 s (Kregel et al., 2007), 0° slope. The speed unit used was cm·s−1 (Kurauti et al., 2016) and the training load was adjusted at the beginning of each training week and the group mean used to determine training intensity.
Determination of VO2max and VVO2max
During the incremental test, gas chamber was collected to determine the VO2max by an air flow control system that allows fine regulation by the LE450 Panlab® gas analyzer (Barcelona, Spain) to determine the amount of VO2 and VCO2 fluxes consumed, energy expenditure (EE) and run distance during the incremental test; the equipment was calibrated weekly. Before initiating the maximal incremental test, mice remained at rest for 5 min to determine the resting VO2 (VO2rep) (Billat et al., 2005; Machado et al., 2013). VO2max was expressed in values related to body mass from an allometric adjustment equal to 1 (Taylor et al., 1955, 1981).
Exercise intensity data and VO2max were recorded every second (METABOLISM software, Pan Lab/Harvard Instruments, Spain) and monitored by an external researcher who visually determined the highest VO2 reached during the test considered the VO2max (McLaughlin et al., 2010), measured at an average of 5-s intervals. Therefore, vVO2max was determined as the minimal velocity at which the highest VO2max occurred (Billat et al., 1994, 1999).
Determination of Vpeak_K
Vpeak was considered the peak running speed obtained during the incremental treadmill test (Machado et al., 2013); if the last stage during the test was not completed, the Vpeak_K was calculated on the part-time achieved using the equation proposed by Kuipers et al. (2003): Vpeak_K = (V + t/T x speed increase), where V is the corresponding velocity of the last completed stage (cm·s−1), t the time (s) of the uncompleted step and, T the completed step (180 s).
Training protocol
Mice were submitted to 4 weeks of aerobic exercise training in a programmable treadmill (Inbrasport, Porto Alegre, Brazil) adapted with a support to accommodate 10 mice simultaneously. The training intensity was established at 70% of the maximum speed reached during the incremental test for the determination of the variables, vVO2max and Vpeak_K, for the GVO2 and GVP groups, respectively. The 70% maximum speed of training correspond to a moderate exercise session since it presents a high correlation with VO2max. (Manoel et al., 2017). Training sessions began at 6 a.m. (lights on), consisting of 1 session per day, 5 times a week (Monday to Friday). The sessions lasted from 30 to 40 min in the first week, from 35 to 50 min in the second week, and 50 to 60 min in the third week, reaching 60 min in the fourth week, in order to submit mice to a moderate intensity exercise, totaling 20 training sessions; the weekly test was considered a training session.
Data analysis
The sample size was calculated using the G-power software (v.3.1.9.2) (Faul et al., 2007), which demonstrated the necessity of a sample of 11 mice per group for the main variable Vpeak_K; the average effect size was set at 0.25, P < 0.05 and 80% power for ANOVA analysis with effect and interaction. All statistical analyses were performed using the Statistica software (v.10, StatSoft Inc., Tulsa, OK, USA). Data are presented as mean ± standard deviation (SD). Shapiro-Wilk test was performed to verify data normality. Comparison of the pre-and post- training was made by mixed ANOVA for repeated measurements. To locate the differences, Tukey post-hoc was applied if significance was observed. The significance level was set at P < 0.05. The effect size was calculated using Cohen equation (d = M1 –M2/SD pooled) comparing post- vs. pre-training period of vVO2max and Vpeak_K. Values of 0.2, 0.5, and 0.8 indicated a small, medium and large average effect, respectively (Cohen, 1988).
Results
Table 1 shows significant differences in body weight (g), food intake (g) and food intake corrected by body weight after 4 weeks of training (time effect, P < 0.05). Mice showed increased body weight (g) but a reduction of food intake (g) over time in both groups. The food intake after 4 weeks showed a marked reduction of GVP group in comparison to GVO2, although not significant.
Table 1.
Body weight, food intake and food intake/body weight in pre- and post-training.
| GVO2 | GVP | P | |||||||
|---|---|---|---|---|---|---|---|---|---|
| Pre | Post | Delta (%) | Pre | Post | Delta (%) | Time | Group | Interaction | |
| Body weight(g) | 37.2 ± 2.5 | 42.5 ± 3.3* | 14.3 ± 3.7 | 38.5 ± 2.3 | 43.6 ± 3.8* | 12.2 ± 4.7 | <0.05 | 0.324 | 0.514 |
| Food intake (g) | 64.9 ± 19.5 | 55.3 ± 8.3* | −10.3 ± 18.3 | 85.1 ± 35.7 | 57.9 ± 10.5* | −22.2 ± 33.7 | <0.05 | 0.121 | 0.193 |
| Food intake/body weight (g) | 17.1 ± 4.4 | 12.5 ± 1.2* | −21.7 ± 17.0 | 22.1 ± 10.0 | 13.4 ± 3.1* | −30.3 ± 30.9 | <0.05 | 0.120 | 0.257 |
Values are presented as mean ± SD. Delta percentage (%) and P-values for time, group and interaction.
P < 0.05 significantly different for time comparison (pre- vs. post-training period).
Table 2 demonstrates that 4 weeks of training promoted increases in VO2max (ml·kg−1·min−1), vVO2max (cm·s−1), Vpeak_K (cm·s−1), EE (ml·kg−1·min−1), run distance (cm), and delta (%) after 4 weeks of aerobic training (time effect, P < 0.05). Also, GVO2 group presented an interaction effect (P < 0.05), indicating the combination of group and time together influenced vVO2max. There were no differences between the groups in pre-or post-conditions (group effect).
Table 2.
Pre- and post-training VO2max, Vpeak_K, vVO2max, EE and run distance.
| GVO2 | GVP | P | |||||||
|---|---|---|---|---|---|---|---|---|---|
| Pre | Post | Delta (%) | Pre | Post | Delta (%) | Time | Group | Inter-action | |
| VO2max (ml·kg−1·min−1) | 28.6 ± 3.7 | 39.9 ± 8.3* | 42.3 ± 40.4 | 30.71 ± 3.8 | 47.9 ± 11.7* | 49.9 ± 44.5 | <0.05 | 0.377 | 0.616 |
| Vpeak_K (cm·s−1) | 29.4 ± 8.2 | 44.3 ± 10.1* | 52.3 ± 44.5 | 31.2 ± 5.6 | 38.2 ± 7.7* | 35.5 ± 45.9 | <0.05 | 0.281 | 0.341 |
| vVO2max (cm·s−1) | 33.4 ± 11.2 | 51.4 ± 9.67*# | 68.1 ± 53.8 | 38.8 ± 11.9 | 43.0 ± 9.0* | 19.5 ± 50.3 | <0.05 | 0.801 | <0.05 |
| EE (ml·kg−1·min−1) | 200.6 ± 29.2 | 280.1 ± 56.8* | 43.4 ± 41.5 | 211.5 ± 23.7 | 314.5 ± 86.3* | 49.9 ± 44.4 | <0.05 | 0.347 | 0.621 |
| Run distance (cm) | 13, 954.4 ± 7, 185.1 | 24, 722.1 ± 10, 026.4* | 119.0 ± 117.7 | 12, 859.0 ± 4, 334.7 | 19, 302.9 ± 6, 709.7* | 76.8 ± 110.8 | <0.05 | 0.197 | 0.339 |
Values are presented as mean ± SD. VO2max, maximum oxygen uptake; vVO2max, velocity associated with maximum oxygen uptake; Vpeak_K, peak velocity adjust to Kuipers et al. (2003); EE, energy expenditure. Delta percentage (%) and P-values for time, group, and interaction analysis.
P < 0.05 significantly different for time comparison (pre- vs. post-training period).
P < 0.05 significantly different for interaction comparison (pre- vs. post-training period).
In order to expand the data analysis beyond the descriptive statistic, we calculated the effect size comparing post- vs. pre-training period for vVO2max and Vpeak_K to assess the magnitude of findings; Figure 1 shows a large effect in both groups.
Figure 1.
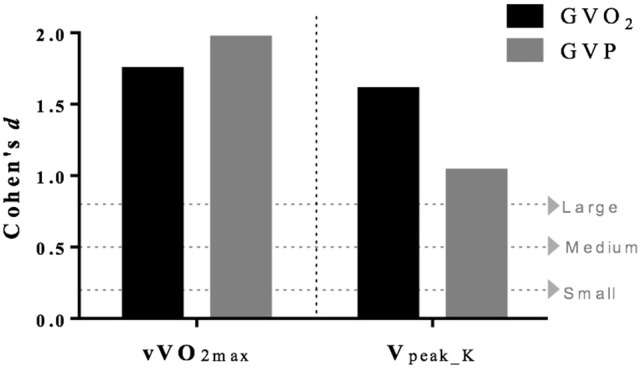
Cohen's effect size comparing post- vs. pre-training period for vVO2max and Vpeak_k.
Discussion
The aim of the present study was to compare the efficiency of an aerobic physical training program prescribed according to either vVO2max and Vpeak_K in mice. Our study demonstrates that both groups, GVO2 or GVP, improved VO2máx, vVO2max., and Vpeak_K after 4 weeks of aerobic training. In addition, Vpeak_K has been proved a reliable method to prescribe and monitor exercise training. Moreover, training improved performance in both groups and increased EE and the run distance. To our knowledge, this is the first study to address the importance of Vpeak_K in animal studies.
In the field of exercise physiology, there is great interest in determining the precise intensity of exercise as various research projects use animal models to study the effects of acute and chronic exercise. In this context, several methods to determine training load have been proposed (Kemi et al., 2002; Lerman et al., 2002; Ferreira et al., 2007).
Non-invasive tests report in the literature that use of VO2max as the variable to predict the performance of mice diverge from incremental tests and training protocols. In this sense, establishing a consensus about the results is not possible due to a wide range of reported values (47–94 ml·kg−1·min−1), according to the slope, magnitude of increase, volume, exhaustion criteria, lineages, age, physical condition, and sex of animals (Dohm et al., 1994; Scott and Houmard, 1994; Lightfoot et al., 2001; Wisløff et al., 2001; Kemi et al., 2002; Ayachi et al., 2016; Kurauti et al., 2016). A few studies have also focused on demonstrating that lineage and sex variations in mice may influence responses in aerobic power (Lightfoot et al., 2010; McLaughlin et al., 2010).
Considering that, it was conceivable that the use of Vpeak_K would help to minimize the observed differences in VO2max once the variable is more sensitive to changes in physical training in humans (Machado et al., 2013; Manoel et al., 2017). In our study, animals trained according to vVO2max or Vpeak_K had similar improvements in VO2max. and performance over time. In fact, GVO2 group presented a higher, although not significant, Vpeak_K. Despite the differences between the two prescription methods it is important to emphasize that the current study demonstrated that animals were able to improve aerobic capacity over time. From a metabolic point of view, other metabolic and structural adaptations may have occurred, hence allowing Vpeak_K-based protocol to be a trustworthy training model for rodents. Therefore, we hypothesize that Vpeak_K can also contribute to the prescription of exercise in different lineages, sex, and age groups of mice, since it has proved as a training-sensitive variable.
The determination of Vpeak_K, considering the equation proposed by Kuipers et al. (2003), allows evaluating aerobic power and monitoring the effects of training more reliable, as the equation takes into account the last stage completed added to the product of the rate of increase and the fraction of the incomplete last stage, abolishing the influence of subjective judgments or overestimations (Machado et al., 2013). Furthermore, Vpeak_K is a low-cost, practical, and reliable parameter, which makes it a fundamental tool for future research in the field of exercise physiology, especially considering the known difficulties of assessing VO2max in small rodents (Fernando et al., 1993; Scott and Houmard, 1994; Ayachi et al., 2016).
Although our research was carefully conducted, limitations and shortcomings are unavoidable. The content of muscle glycogen or correlation with blood levels of lactate were not verified during the training period. Also, the training was performed during the day (lights on), opposable to mice habits, which present a predominantly nocturnal behavior.
Vpeak_K has practical implications for researchers aiming to collect data concerning the effects of training due to its low cost, which is made possible by the fact that it does not require any expensive equipment (i.e., gas analyzer). In summary, Vpeak_K, as well as vVO2max, can be adopted as an alternative test to determine the performance and correct prescription of a systemized aerobic protocol training to mice.
Author contributions
CP: Experiment design, execution of the experiments, writing; PR: Experiment design; GG: Execution of the experiments; DG: Performed statistical analysis; LT: VO2 analysis: SdM: Discussion of data; FM: Conceive the experiments, discussion of data, writing; SP: Concept of the paper, writing.
Conflict of interest statement
The authors declare that the research was conducted in the absence of any commercial or financial relationships that could be construed as a potential conflict of interest. The reviewer RRC and handling Editor declared their shared affiliation.
References
- ACSM's (2011). ACSM's cardiorespiratory fitness: field and submaximal exercise test, in ACSM's Health-Related Physical Fitness Assessment Manual, 4th Edn, ed Kamisky L. A. (Baltimore, MD: Wolters Kluwer; ), 135–150. [Google Scholar]
- Ayachi M., Niel R., Momken I., Billat V. L., Mille-Hamard L. (2016). Validation of a ramp running protocol for determination of the true VO2max in Mice. Front. Physiol. 7:372. 10.3389/fphys.2016.00372 [DOI] [PMC free article] [PubMed] [Google Scholar]
- Bassett D. R., Howley E. T. (2000). Limiting factors for maximum oxygen uptake and determinants of endurance performance. Med. Sci. Sports Exerc. 32, 70–84. 10.1097/00005768-200001000-00012 [DOI] [PubMed] [Google Scholar]
- Billat V. L., Flechet B., Petit B., Muriaux G., Koralsztein J. P. (1999). Interval training at VO2max: effects on aerobic performance and overtraining markers. Med. Sci. Sports Exerc. 31, 156–163. 10.1097/00005768-199901000-00024 [DOI] [PubMed] [Google Scholar]
- Billat V. L., Mouisel E., Roblot N., Melki J. (2005). Inter- and intrastrain variation in mouse critical running speed. J. Appl. Physiol. 98, 1258–1263. 10.1152/japplphysiol.00991.2004 [DOI] [PubMed] [Google Scholar]
- Billat V., Renoux J. C., Pinoteau J., Petit B., Koralsztein J. P. (1994). Reproducibility of running time to exhaustion at VO2max in subelite runners. Med. Sci. Sports Exerc. 26, 254–257. 10.1249/00005768-199402000-00018 [DOI] [PubMed] [Google Scholar]
- Buchheit M., Chivot A., Parouty J., Mercier D., Al Haddad H., Laursen P. B., et al. (2010). Monitoring endurance running performance using cardiac parasympathetic function. Eur. J. Appl. Physiol. 108, 1153–1167. 10.1007/s00421-009-1317-x [DOI] [PubMed] [Google Scholar]
- Carvalho J. F., Masuda M. O., Pompeu F. A. M. S. (2005). Method for diagnosis and control of aerobic training in rats based on lactate threshold. Comp. Biochem. Physiol. A Mol. Integr. Physiol. 140, 409–413. 10.1016/j.cbpb.2004.12.002 [DOI] [PubMed] [Google Scholar]
- Cohen J. (1988). Statistical Power Analysis for the Behavioral Sciences 2nd Edn. Hillsdale, NJ: Lawrence Earlbaum Associates. [Google Scholar]
- Daniels J., Scardina N., Hayes J., Foley P. (1984). Elite and subelite female middle- and long-distance runners, in Sport and Elite Performers, ed Landers D. M. (Champaign, IL: Human Kinetics; ), 57–72. [Google Scholar]
- di Prampero P. E. (1986). The anaerobic threshold concept: a critical evaluation. Adv. Cardiol. 35, 24–34. 10.1159/000413436 [DOI] [PubMed] [Google Scholar]
- Dohm M. R., Richardson C. S., Garland T. (1994). Exercise physiology of wild and random-bred laboratory house mice and their reciprocal hybrids. Am. J. Physiol. 267, R1098–R1108. 10.1152/ajpregu.1994.267.4.R1098 [DOI] [PubMed] [Google Scholar]
- Faul F., Erdfelder E., Lang A., Buchner A. (2007). G*Power 3: a flexible statistical power analysis program for the social, behavioral, and biomedical sciences. Behav. Res. Methods 39, 175–191. 10.3758/BF03193146 [DOI] [PubMed] [Google Scholar]
- Fernando P., Bonena Hoffman-Goetz L. (1993). Predicting submaximal oxygen consumption during treadmill running in mice. Can. J. Physiol. Pharmacol. 71, 854–857. 10.1139/y93-128 [DOI] [PubMed] [Google Scholar]
- Ferreira J. C. B., Rolim N. P. L., Bartholomeu J. B., Gobatto C. A., Kokubun E., Brum P. C. (2007). Maximal lactate steady state in running mice: effect of exercise training. Clin. Exp. Pharmacol. Physiol. 34, 760–765. 10.1111/j.1440-1681.2007.04635.x [DOI] [PubMed] [Google Scholar]
- Kemi O. J., Loennechen J. P., Wisløff U., Ellingsen Ø., Johan O., Loennechen J. P., et al. (2002). Intensity-controlled treadmill running in mice : cardiac and skeletal muscle hypertrophy. J. Appl. Physiol. 93, 1301–1309. 10.1152/japplphysiol.00231.2002 [DOI] [PubMed] [Google Scholar]
- Kregel K. C., Allen D. L., Booth F. W., Fleshner M., Henriksen E. J., Musch T. I., et al. (2007). Resource Book for the Design of 302 Animal Exercise Protocols, 1st Edn. Bethesda, MD: American Physiological Society. [Google Scholar]
- Kuipers H., Rietjens G., Verstappen F., Schoenmakers H., Hofman G. (2003). Effects of stage duration in incremental running tests on physiological variables. Int. J. Sports Med. 24, 486–491. 10.1055/s-2003-42020 [DOI] [PubMed] [Google Scholar]
- Kurauti M. A., Freitas-Dias R., Ferreira S. M., Vettorazzi J. F., Nardelli T. R., Araujo H. N., et al. (2016). Acute exercise improves insulin clearance and increases the expression of insulin-degrading enzyme in the liver and skeletal muscle of swiss mice. PLoS ONE 11:e0160239. 10.1371/journal.pone.0160239 [DOI] [PMC free article] [PubMed] [Google Scholar]
- Lerman I., Harrison B. C., Freeman K., Hewett T. E., Allen D. L., Robbins J., et al. (2002). Genetic variability in forced and voluntary endurance exercise performance in seven inbred mouse strains. J. Appl. Physiol. 92, 2245–2255. 10.1152/japplphysiol.01045.2001 [DOI] [PubMed] [Google Scholar]
- Lightfoot J. T., Leamy L., Pomp D., Turner M. J., Fodor A. A., Knab A., et al. (2010). Strain screen and haplotype association mapping of wheel running in inbred mouse strains. J. Appl. Physiol. 109, 623–634. 10.1152/japplphysiol.00525.2010 [DOI] [PMC free article] [PubMed] [Google Scholar]
- Lightfoot J. T., Turner M. J., Debate K. A., Kleeberger S. R. (2001). Interstrain variation in murine aerobic capacity. Med. Sci. Sports Exerc. 33, 2053–2057. 10.1097/00005768-200112000-00012 [DOI] [PubMed] [Google Scholar]
- Machado F. A., Guglielmo L. G., Denadai B. S. (2007). Effect of the chronological age and sexual maturation on the time to exhaustion at maximal aerobic speed. Web Sci. 36, 21–30. 10.1590/2179-325520143630018 [DOI] [Google Scholar]
- Machado F. A., Kravchychyn A. C. P., Peserico C. S., da Silva D. F., Mezzaroba P. V. (2013). Incremental test design, peak “aerobic” running speed and endurance performance in runners. J. Sci. Med. Sport 16, 577–582. 10.1016/j.jsams.2012.12.009 [DOI] [PubMed] [Google Scholar]
- Manoel F. A., da Silva D. F., Roberto Perrout de Lima J., Andrade Machado F. (2017). Peak velocity and its time limit are as good as the velocity associated with VO2max for training prescription in runners. Sport. Med. Int. Open 1, 8–15. 10.1055/s-0042-119951 [DOI] [PMC free article] [PubMed] [Google Scholar]
- Marcaletti S., Thomas C., Feige J. N. (2011). Exercise performance tests in mice. Curr. Protoc. Mouse Biol. 1, 141–154. 10.1002/9780470942390.mo100160 [DOI] [PubMed] [Google Scholar]
- McLaughlin J. E., Howley E. T., Bassett D. R., Thompson D. L., Fitzhugh E. C. (2010). Test of the classic model for predicting endurance running performance. Med. Sci. Sports Exerc. 42, 991–997. 10.1249/MSS.0b013e3181c0669d [DOI] [PubMed] [Google Scholar]
- Morgan D. W., Baldini F. D., Martin P. E., Kohrt W. M. (1989). Ten kilometer performance and predicted velocity at VO2max among well-trained male runners. Med. Sci. Sports Exerc. 21, 78–83. 10.1249/00005768-198902000-00014 [DOI] [PubMed] [Google Scholar]
- Noakes T. D., Myburgh K. H., Schall R. (1990). Peak treadmill running velocity during the VO2 max test predicts running performance. J. Sports Sci. 8, 35–45. 10.1080/02640419008732129 [DOI] [PubMed] [Google Scholar]
- Rodrigues N. A., Torsoni A. S., Fante T., Dos Reis I. G., Gobatto C. A., Manchado-Gobatto F. B. (2017). Lactate minimum underestimates the maximal lactate steady state in swimming mice. Appl. Physiol. Nutr. Metab. 42, 46–52. 10.1139/apnm-2016-0198 [DOI] [PubMed] [Google Scholar]
- Scott B., Houmard J. (1994). Peak running velocity is highly related to distance running performance. Int. J. Sports Med. 15, 504–507. 10.1055/s-2007-1021095 [DOI] [PubMed] [Google Scholar]
- Stratton E., O'Brien B. J., Harvey J., Blitvich J., McNicol A. J., Janissen D., et al. (2009). Treadmill velocity best predicts 5000-m run performance. Int. J. Sports Med. 30, 40–45. 10.1055/s-2008-1038761 [DOI] [PubMed] [Google Scholar]
- Taylor C. R., Maloiy G. M., Weibel E. R., Langman V. A., Kamau J. M., Seeherman H. J., et al. (1981). Design of the mammalian respiratory system. Respir. Physiol. 44, 25–37. 10.1016/0034-5687(81)90075-X [DOI] [PubMed] [Google Scholar]
- Taylor H. L., Buskirk E., Henschel A. (1955). Maximal oxygen intake as an objective measure of cardio-respiratory performance. J. Appl. Physiol. 8, 73–80. 10.1152/jappl.1955.8.1.73 [DOI] [PubMed] [Google Scholar]
- Wisløff U., Helgerud J., Kemi O. J., Ellingsen O. (2001). Intensity-controlled treadmill running in rats: VO(2max) and cardiac hypertrophy. Am. J. Physiol. Heart Circ. Physiol. 280, H1301–H1310. 10.1152/ajpheart.2001.280.3.H1301 [DOI] [PubMed] [Google Scholar]