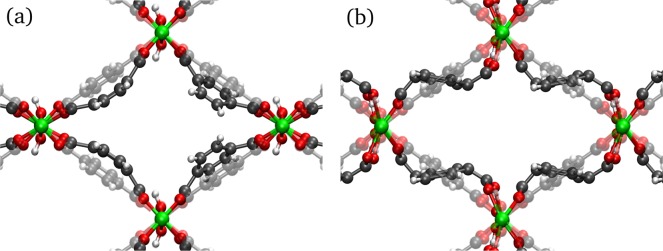
Abstract
In this work, mid-infrared (mid-IR), far-IR, and Raman spectra are presented for the distinct (meta)stable phases of the flexible metal–organic framework MIL-53(Al). Static density functional theory (DFT) simulations are performed, allowing for the identification of all IR-active modes, which is unprecedented in the low-frequency region. A unique vibrational fingerprint is revealed, resulting from aluminum-oxide backbone stretching modes, which can be used to clearly distinguish the IR spectra of the closed- and large-pore phases. Furthermore, molecular dynamics simulations based on a DFT description of the potential energy surface enable determination of the theoretical Raman spectrum of the closed- and large-pore phases for the first time. An excellent correspondence between theory and experiment is observed. Both the low-frequency IR and Raman spectra show major differences in vibrational modes between the closed- and large-pore phases, indicating changes in lattice dynamics between the two structures. In addition, several collective modes related to the breathing mechanism in MIL-53(Al) are identified. In particular, we rationalize the importance of the trampoline-like motion of the linker for the phase transition.
1. Introduction
Metal–organic frameworks (MOFs) are an emerging class of porous crystalline materials consisting of metal-oxide clusters connected through organic linkers.1−3 The relatively easy synthesis procedure as well as the enormous number of existing4 and hypothetical5 MOFs make them promising materials for future industrial applications. Examples of such applications can be found in the fields of heterogeneous catalysis6 and gas separation,7 in which porous materials are ubiquitous. However, the chemical versatility of MOFs also allows for their use in applications such as drug delivery,8 lighting,9 and chemical sensing.10 An important subclass of MOFs consists of flexible MOFs,11 some of which can undergo a phase transition upon external stimuli. This behavior is called breathing when the phase transition induces a drastic change in unit cell volume.11,12
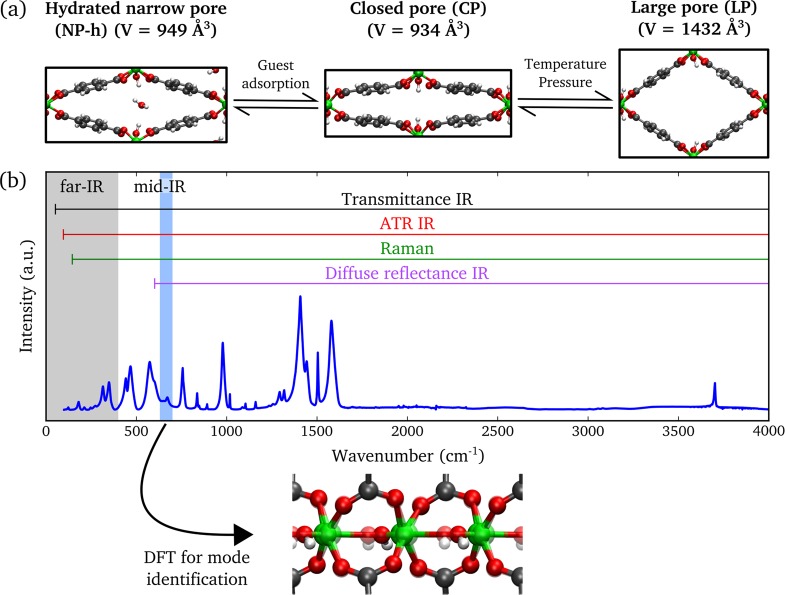
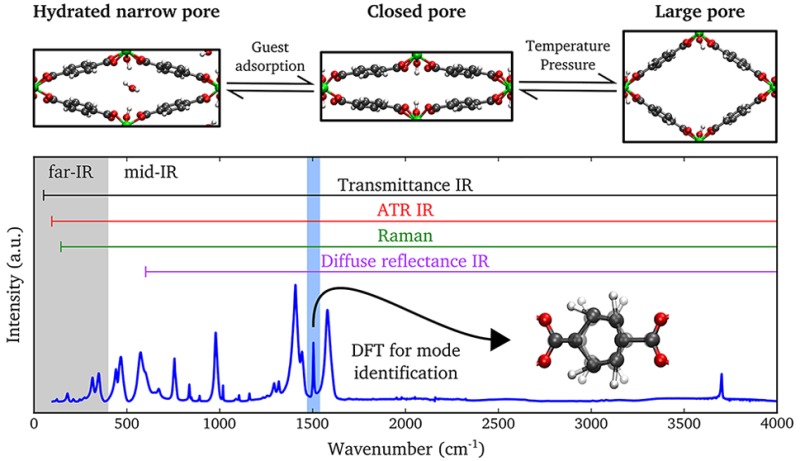
A prototypical example of a breathing MOF is MIL-53(Al), first synthesized by Férey and co-workers.13 The structure is composed of infinite chains of corner-sharing AlO4(OH)2 octahedra connected through 1,4-benzenedicarboxylate linkers, which results in 1D diamond-shaped channels. After activation, MIL-53(Al) was originally reported to occur in two different phases. The low-temperature phase represents a narrow-pore structure containing adsorbed water molecules and has a monoclinic crystal system. The high-temperature phase has a much larger pore volume without guest molecules and is orthorhombic. In the following, both phases will be indicated by NP-h and LP, where the abbreviation is used for the narrow- and large-pore phases, respectively, and the suffix h refers to hydration. Transitions between the two phases can be induced by adsorption and desorption of guest molecules,14 and at first it was believed that the presence of guest molecules is essential to observe the phase transition in MIL-53(Al). However, Liu et al.15 reported that under vacuum a third phase of MIL-53(Al) is present, which exhibits the same monoclinic structure as the NP-h phase but with a slightly smaller pore volume and in absence of guest molecules. Therefore, we will refer to this phase as the closed-pore (CP) phase. It was shown that reversible transitions between the different phases of MIL-53(Al) occur not only under the influence of guest adsorption,16 but also by changing the temperature15,17,18 or by applying pressure.19 As a consequence, the origin of breathing in MIL-53(Al) cannot solely be explained by the presence of guest molecules, but it is also an intrinsic property of the framework.20 We remark that, depending on the source, different nomenclatures are used to represent the various phases. In Figure 1a, we provide an overview of the different phases of MIL-53(Al) with the nomenclature adopted in this work.
Figure 1.
(a) Illustration of the different crystal structures of MIL-53(Al) with corresponding unit cell volumes (volumes were taken from refs (18) and (21)). (b) Schematic representation of the applied experimental techniques with respective spectral ranges that can be probed by these techniques. Static and dynamic DFT simulations have been used to identify the observed IR- and Raman-active vibrational modes, respectively.
To understand the flexibility of breathing MOFs on a molecular scale, vibrational spectroscopy can be used to characterize the different phases as it provides a fingerprint of the structure.22,23 In the past, several experimental investigations using infrared (IR) or Raman spectroscopy have been performed on materials of the MIL-53 family in order to reveal the vibrational spectra of the CP, NP-h, and LP phases.13,14,17,24−32 The reported results were mostly limited to the mid-IR range (400–4000 cm–1). From these studies, differences between the NP-h and CP spectra were assigned to spectral bands of the adsorbed water molecules and shifts of the stretch and bend modes of the hydroxyl group.13,17,29 The vibrational spectra of the CP and LP phases differed mainly because of spectral shifts, of which the shift of the ν18a ring mode14,29,31 appeared to be the most prominent one. Here, we adopt the nomenclature on aromatic ring vibrations as introduced by Wilson.33 The spectral bands in the mid-IR range belong to vibrations of specific functional groups within the structure, and their shifts do not provide much insight into the breathing phenomenon. To improve the understanding of the mechanisms resulting in the phase transition, it is necessary to study the collective dynamics of the structure with corresponding vibrational modes in the far-IR region,22 which presents several challenges.
A first challenge that arises is the difficulty of experimentally obtaining a high-quality IR spectrum (high signal-to-noise ratio) in the far-IR range. Recent studies of far-IR spectra of MOFs22,23,32 benefited from the high brilliance of synchrotron sources to improve signal intensity in the far-IR, where absorption by ambient atmosphere is very strong. The far-IR spectrum of MIL-53(Al) has recently been explored by means of specular reflectance spectroscopy using synchrotron radiation.32
A second challenge concerns the microscopic identification of certain low-frequency modes. This is not straightforward as these modes no longer originate from known localized vibrations of functional groups. Therefore, computer simulations are necessary to elucidate the modes in the far-IR range.22,23 Although a lot of theoretical research has been performed on MIL-53, computational studies regarding the IR spectra of the structure are less numerous,29,32 and a simulated Raman spectrum has, to the best of our knowledge, not been reported.
In this work, we use Fourier transform infrared (FTIR) and Raman spectroscopy to investigate the complete (mid- and far-IR range) vibrational spectrum of the different phases of MIL-53(Al). Figure 1b shows a schematic representation of the applied experimental techniques with respective spectral ranges. By application of both static and dynamic ab initio calculations, we obtain the corresponding theoretical IR and Raman spectra. Excellent agreement between experimental and simulated spectra is observed, which allows for the identification of all optically active peaks in the range of 100–4000 cm–1. We reveal a unique vibrational fingerprint that distinguishes between the CP and LP phase spectra. Furthermore, we investigate the low-frequency modes of MIL-53(Al) in order to elucidate the breathing mechanism in the structure.
2. Experimental Details
The material synthesis and activation were carried out as previously reported by Nevjestić et al.21 In particular, a solvent extraction method consisting of three steps was employed for activation.34 First, a heating step at 425 K in dimethylformamide in a Teflon-lined autoclave for 24 h was executed. Afterward, the material was washed at 395 K in methanol for 72 h. A last step consisted of drying at 475 K for 2 h under vacuum. With in situ powder X-ray diffraction as a function of air pressure and temperature (see Figure S1 in the Supporting Information) it was verified that the NP-h, CP, and LP phases of MIL-53(Al) could be obtained in (nearly) pure form.
Nevertheless, obtaining a targeted and pure crystallographic phase of MIL-53(Al) inside of a spectrometer remains a challenging task. Therefore, recording the FTIR spectra of the three phases (NP-h, CP, and LP) of MIL-53(Al) required multiple setups and measurement modes, as schematically shown in Figure 1b. The IR spectrum of the NP-h phase was recorded in transmission mode with a Bruker Vertex 80v vacuum FTIR spectrometer equipped with a DLaTGS detector, a globar source, and a KBr or Mylar multilayer beamsplitter for mid- or far-IR measurements, respectively. The transmission spectra were obtained from pellet samples with less than 1 wt % MIL-53(Al) powder diluted in KBr or polyethylene, which are IR-inactive in the mid- and far-IR ranges, respectively. It was verified that the influence of the matrix material on MIL-53(Al) in the NP-h phase was negligible (see section S1.2 in the Supporting Information). The spectra were recorded under vacuum conditions (1–2 mbar) with a resolution of 0.5 cm–1, accumulating 40 scans. While free-standing MIL-53(Al) powder dehydrates fast under vacuum conditions, the sample inside of the pellet remains hydrated because the out-diffusion of water is hindered.
The IR spectrum of the CP phase could not be measured completely in transmission mode because the presence of polyethylene in the pellet significantly affects the far-IR spectrum (see Figures S3 and S4 in the Supporting Information). Therefore, the IR spectrum of the CP phase was recorded in the attenuated total reflection (ATR) mode using a single-bounce ATR accessory (PLATINUM ATR) with a diamond crystal in the Bruker Vertex 80v FTIR spectrometer. MIL-53(Al) powder was placed on top of the diamond crystal and pressed by a small lever in order to provide good contact. Afterward, the sample chamber was pumped to 1–2 mbar, and IR spectra were recorded with a resolution of 1 cm–1, accumulating 10–40 scans, depending on the quality of the spectrum. An ATR correction was performed on the resulting spectrum mainly to take into account the larger beam penetration depth into the sample at lower frequencies. Comparison of the corrected ATR IR spectrum of the CP phase with the transmission spectrum in the mid-IR range demonstrated a small shift in several peak positions, mainly caused by the additional pressure delivered by the lever, resulting in a slightly compressed structure in the ATR mode (see Figures S5 and S6 in the Supporting Information).
The only practical way to obtain the LP phase is by heating the sample above 370 K (see section S1.1 in the Supporting Information). The lack of an in situ heating device for the Bruker Vertex 80v FTIR spectrometer prohibited measurements of the LP phase with this setup. Therefore, a Nicolet 6700 diffuse reflectance infrared Fourier transform (DRIFT) spectrometer was used, equipped with a liquid-nitrogen-cooled MCT-A detector, an ETC IR source, and a KBr beamsplitter. The optics of the spectrometer limited the spectral range to >600 cm–1, which made far-IR measurements impossible. The powdered sample was prepared by diluting it in KBr and placing it in a small cup inside of a Graseby Specac diffuse reflectance cell with an external vacuum connection. DRIFT spectra of the CP and LP phases were recorded with a resolution of 2 cm–1, accumulating 1000 scans. The DRIFT spectrum of the CP phase qualitatively matches the ATR IR spectrum. However, due to the Kubelka–Munk transformation, used to convert the DRIFT spectra to absorption spectra, slight intensity differences between spectra obtained by DRIFT and ATR IR exist (see Figure S5 in the Supporting Information). The CP-to-LP transition was obtained by heating the sample to 400 K under vacuum conditions. It was verified that the transformation had actually taken place by cooling the sample under vacuum back to room temperature, after which the spectral changes remained.
The Raman spectra were collected with a NXR FT-Raman spectrometer equipped with an InGaAs detector, a KBr beamsplitter, and a Nd:YVO4 laser with a wavelength of 1064 nm and a power of 2.5 W. During the experiments, the MIL-53(Al) powder was kept in a glass flask under vacuum conditions. After recording the spectra for the CP phase, the sample was heated to induce a transition to the LP phase. The Raman spectra were measured in the frequency range of 150–4000 cm–1 with a resolution of 2 cm–1, accumulating 500 scans.
3. Computational Details
Static and dynamic density functional theory (DFT) simulations were performed on structures in the CP and LP phases to determine the theoretical IR and Raman spectra of MIL-53(Al). Theoretical IR and Raman spectra of the NP-h phase were not calculated because the interactions of water inside of MIL-53(Al) are complex35 and difficult to deal with correctly by DFT calculations.29 Static DFT simulations were executed with the Vienna Ab initio Simulation Package (VASP)36 using the PBE exchange-correlation functional,37 a projector-augmented plane wave basis set38 with a cutoff energy of 500 eV, and a Monkhorst–Pack k-mesh39 with 2 × 6 × 6 k-points for the CP phase and 2 × 6 × 2 k-points for the LP phase. Grimme’s D3 corrections with Becke–Johnson damping were used to describe the long-range dispersion interactions.40,41 Initially, the structure was optimized by ionic relaxation using the conjugate-gradient algorithm, allowing for changes in the cell shape but keeping the volume fixed. The ionic relaxation was assumed to be converged when the change in the total energy decreased below 10–7 eV between two ionic steps. The lattice parameters of the optimized geometries of the CP and LP phases are in good agreement with the experimental values (see Table S1 of the Supporting Information). Moreover, we obtain an energy difference between both phases of ΔELP–CP = 26.7 kJ mol–1 per unit cell at the PBE-D3(BJ) level of theory, which falls in the range of the results obtained by Walker et al.20
The vibrational frequencies and corresponding IR intensities of the optimized structures were calculated using density functional perturbation theory (DFPT)42,43 and the Berry phase approach.44,45 Both methods are incorporated in VASP and calculate the Born effective charge tensor and the dynamical matrix at the gamma point. The DFPT method uses linear response techniques to efficiently determine the required data, but these calculations have to be executed without dispersion corrections. The Berry phase approach uses finite differences to obtain the necessary tensors and can include dispersion corrections, but it is computationally more demanding. We have verified that both approaches give almost exactly the same spectra (see Figure S7 in the Supporting Information), which is why we opted for the computationally cheaper DFPT method. From static DFT calculations, the vibrational modes with their corresponding IR activity are retrieved, but information on the bandwidth is not provided. In order to facilitate comparison with the experimental spectra, we applied a Lorentzian line shape with full width at half-maximum (FWHM) of 10 cm–1 to all calculated delta peaks, which is a common procedure in the literature.23
To investigate the effect of temperature and anharmonicities on the vibrational spectra of MIL-53(Al), ab initio molecular dynamics (AIMD) simulations were performed using the CP2K software with the DFT Quickstep module.46,47 Calculations were executed at the PBE level of theory with Grimme’s D3 corrections.40 The Gaussian and plane waves (GPW) method was used with atom-centered Gaussian orbitals complemented with auxiliary plane waves. The Gaussian basis sets were of the TZVP2 type for all atoms except aluminum, for which the DZVP basis set was used. They were picked from the MOLOPT basis set. The cutoff for the auxiliary plane waves was set at 400 and 600 Ry for AIMD simulations on the CP and LP phases, respectively. The difference in cutoff originates from the computationally more expensive calculations for the CP phase. In addition, GTH pseudopotentials48 were applied to take into account the core electrons. The dynamic simulations were executed in the NVT ensemble with cell shape and volume fixed at the optimized cell with VASP. Both the CP and LP structures were equilibrated for 3 ps. The equations of motion were evaluated with a time step of 0.5 fs, and total simulation times of 10 and 20 ps were reached for the CP and LP phases, respectively. The temperature of 300 K was controlled by a Nosé–Hoover chain thermostat49−52 with three beads and a time constant of 100 fs.
From an AIMD simulation, the IR spectrum can be determined by taking the Fourier transform of the autocorrelation function of the dipole moment.53 Therefore, the dipole moment was calculated every 2.5 fs using the Berry phase approach implemented in the CP2K code. As the dynamic IR spectrum shows only minor differences with the static IR spectrum, its discussion is found in section S3.1 of the Supporting Information. Besides IR spectra, we also determined Raman spectra from the MD trajectory. The calculation of the Raman spectrum from an AIMD simulation occurs in an analogous way as the calculation of the IR spectrum. It is performed by adding Fourier transforms of autocorrelation functions of the components of the polarizability tensor.53 Due to the limited simulation time, these Fourier transforms could only be executed on relatively small data blocks, limiting the spectral resolution to 6.5 cm–1. One possible way to obtain the polarizability tensor is by linear response techniques, but this approach is computationally very intensive.54 Therefore, a faster though less accurate method was employed, whereby an electric field was applied to each configuration of the standard MD trajectory. Three different simulations were performed with an electric field of 257 MV·m–1 in each of the three Cartesian directions. The dipole moment was calculated with and without an electric field, and subsequently, the components of the polarizability tensor were approximated by dividing the difference of the resulting dipole moments by the intensity of the electric field. In this way, a Raman spectrum was obtained with limited additional computational cost given the rather short simulation time. In contrast, calculation of the Raman spectra using a static DFT approach was exceedingly expensive as this required determination of the derivatives of the polarizability tensor with respect to all vibrational modes.55
4. Results and Discussion
In this section, we will first verify the correspondence between the IR spectra of MIL-53(Al) obtained by static DFT simulations and experiments in the mid-IR range. These results test the ability of the DFT calculations to reproduce the experimentally observed spectral differences between the CP and LP phases, showcasing the validity of our computational approach. Afterward, this approach is applied to study the far-IR spectra of MIL-53(Al). We assign the IR-active modes of the CP phase observed in the experiment with the help of our theoretical results. Subsequently, the spectral differences of the LP and NP-h phases with the CP phase are identified and rationalized. Furthermore, the theoretical Raman spectra of the CP and LP phases of MIL-53(Al) are determined by AIMD simulations and compared with the experimental spectra. Finally, we examine several low-frequency vibrations obtained by static DFT simulations and identify whether there is a correspondence with the breathing behavior in MIL-53(Al).
4.1. Comparison of the Mid-IR Spectra of MIL-53(Al) CP and LP
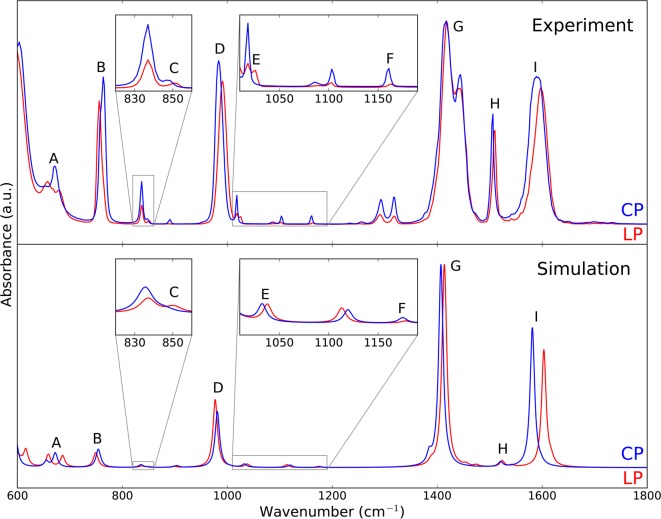
Figure 2 compares the experimental DRIFT spectra of the CP and LP phases of MIL-53(Al) in the range of 600–1800 cm–1 with the predicted static DFT results, which are blue-shifted with a scaling factor in order to obtain the best possible agreement with experiment. A quantitative measure for this correspondence can be obtained by evaluation of the similarity index, which is a measure of the correlation between two spectra56,57
Here, f(σ) and g(σ) represent the intensities of the simulated and experimental spectra at frequency σ. A similarity index of 0 means absolutely no correspondence between the two spectra, while a similarity index of 1 indicates that the spectra are identical. Using the optimal scaling factor and line shape for the theoretical spectra, we calculated a similarity index as high as 0.86 for the CP phase and 0.84 for the LP phase (see section S2.3 of the Supporting Information). We derived an optimal scaling factor of 1.025, in agreement with earlier DFT calculations using the PBE functional in which an optimal scaling factor of approximately 1.03 was predicted.58−61 Although the correspondence after scaling generally improves for the modes below 1700 cm–1, it deteriorates correspondence with the C–H and O–H stretching modes located at higher frequencies, as is common in the literature58 (see Figure S9 in the Supporting Information).
Figure 2.
Comparison of DRIFT spectra (top) and theoretical IR spectra obtained by static DFT calculations (bottom) for the CP (blue) and LP (red) phases in the range of 600–1800 cm–1. Both theoretical spectra were blue-shifted with a scaling factor of 1.025 and received a Lorentzian line shape with a FWHM of 10 cm–1. The spectral differences between the experimental CP and LP phases are indicated by capital letters.
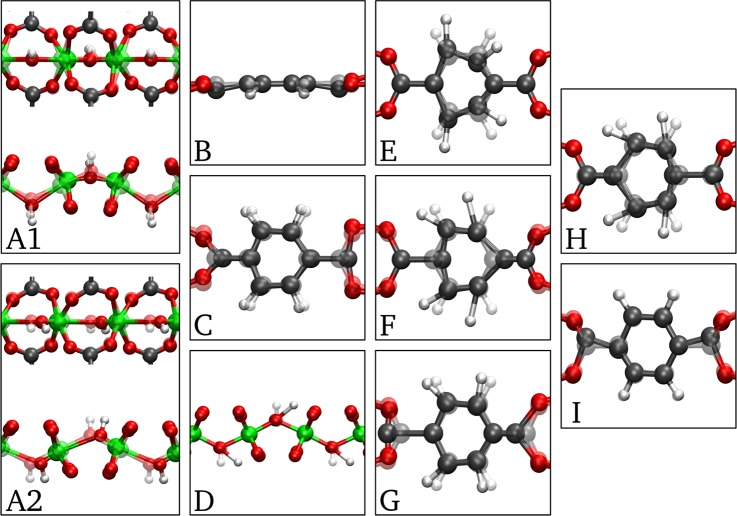
From Figure 2 and the respective similarity indices, it is clear that our simulations are able to predict the experimental spectrum accurately. The DFT calculation allowed us to assign vibrational modes to all peaks except for the two at around 1300 cm–1 (see Table S4 in the Supporting Information for complete mode identification). In general, we observe a good match in the positions of the peaks. The relative intensities are often well predicted, except for the symmetric (G) and antisymmetric (I) stretching modes of the carboxyl group, which are overestimated in our model, and the ν19a ring mode (H), which is underestimated (see Figure 3 for a visualization of the modes). This results partially from the single broadening factor that we used, not accounting for the different line widths observed experimentally for different modes. However, most importantly, the spectral shifts between the CP and LP phases as observed from DFT simulations coincide with the ones observed from experiments, except for the mode that is indicated with D. In Table 1, all spectral shifts noticed in the DRIFT measurements are listed, along with their simulated values. For frequencies higher than 750 cm–1 (B–I), the magnitude of the shifts is rather limited and they do not change the general shape of the spectrum. In contrast, a unique vibrational fingerprint is revealed at lower frequencies, which is substantially different in the CP and LP phase (labeled A). The peaks that characterize this fingerprint are assigned to the symmetric (A1) and antisymmetric (A2) stretch modes of the aluminum-oxide backbone (see Figure 3). Bourrelly et al.27 already employed the metal-oxide backbone stretching mode in the chromium analogue to estimate the amount of large-pore structure in the sample, but here we show that this major change in the IR spectrum specifically originates from a large blue shift of the antisymmetric stretch mode from the CP to the LP phase. As this spectral feature is still in the range of most IR spectrometers, it can be employed in routine measurements to distinguish between the CP and LP phases even at low resolutions. However, care should be taken when using this fingerprint in the presence of guest molecules as the aluminum-oxide backbone stretching modes may overlap with the vibrations of certain guest species, such as CO2.
Figure 3.
Illustration of the vibrational modes indicated in Figure 2. (A1) Symmetric stretch of the aluminum-oxide backbone. (A2) Antisymmetric stretch of the aluminum-oxide backbone. (B) Out-of-plane vibration of hydrogen atoms on the aromatic ring (ν11). (C) Bend of the carboxyl group + bend of the aromatic ring. (D) Rocking of the hydroxyl group. (E) Bending of the aromatic ring + rocking of hydrogen atoms on the aromatic ring (ν18a). (F) Stretch between the aromatic ring and carboxyl group + rocking of hydrogen atoms on the aromatic ring (ν18a). (G) Symmetric stretch of the carboxyl group. (H) Stretch between the aromatic ring and carboxyl group + rocking of hydrogen atoms on the aromatic ring (ν19a). (I) Antisymmetric stretch of the carboxyl group. Videos of these modes are available in the Supporting Information.
Table 1. Experimental and Theoretical Frequencies (Static) of the Vibrational Modes Characteristic of the CP-to-LP Transition Indicated in Figure 2 along with the Spectral Shifts between the Two Phases.
| experiment
(cm–1) |
simulationb(cm–1) |
||||||
|---|---|---|---|---|---|---|---|
| vibrational mode | assignationa | CP | LP | ΔLP–CP | CP | LP | ΔLP–CP |
| A1 | νAlOAlsym | 653 | 657 | 4 | 655 | 659 | 4 |
| A2 | νAlOAlas | 671 | 680 | 9 | 672 | 686 | 14 |
| B | ωCH (ν11) | 764 | 756 | –8 | 755 | 750 | –5 |
| C | δCCC + δCO2 | 847 | 851 | 4 | 847 | 851 | 4 |
| D | δOH | 983 | 991 | 8 | 981 | 977 | –4 |
| E | δCCC + δCH (ν18a) | 1018 | 1026 | 8 | 1033 | 1038 | 5 |
| F | νCC + δCH (ν18a) | 1160 | 1163 | 3 | 1176 | 1178 | 2 |
| G | νsymCO2 | 1415 | 1418 | 3 | 1407 | 1413 | 6 |
| H | νCC + δCH (ν19a) | 1505 | 1509 | 4 | 1521 | 1523 | 2 |
| I | νasCO2 | 1589 | 1597 | 8 | 1581 | 1603 | 22 |
We used the following spectroscopic notation: ν = stretching, δ = bending or in-plane rocking, and ω = out-of-plane wagging. The abbrevations sym and as stand for symmetric and antisymmetric, respectively. The nomenclature of ring modes is added between brackets where appropriate.
The values are multiplied by a scaling factor of 1.025.
In contrast to the large shift in the stretching modes of the aluminum-oxide backbone, earlier investigations used the more subtle shifts in the ν18a ring modes (E and F) (see Figure 3) to determine the fraction of large-pore phase in the sample.14,31 In our experimental spectrum of the LP phase, an additional low-intensity peak in the region of mode E indicates that the measured sample still contained traces of the CP phase. Nevertheless, as clear from the lower pane of Figure 2, the theoretical spectrum is able to predict the shifts of the ν18a ring modes accurately. The only characterizing mode, listed in Table 1, for which the shift differs is the δOH mode (D). Finally, we want to mention the general decrease in intensity of the peaks from the CP to the LP phase observed in the measurements. A possible explanation is the higher symmetry of the LP phase structure, which reduces the change in dipole moment induced by the modes leading to a smaller IR activity. This decrease is not captured in our static DFT simulations.
In conclusion, the correspondence between the simulated and experimental spectra of the CP and LP phases in the mid-IR range confirms the validity of our theoretical approach and allowed us to uniquely characterize the aluminum-oxide backbone stretching modes as a clear fingerprint to distinguish between the modes of the CP and LP phases of MIL-53(Al).
4.2. Far-IR Spectrum of the CP and LP Phases of MIL-53(Al)
4.2.1. CP Phase
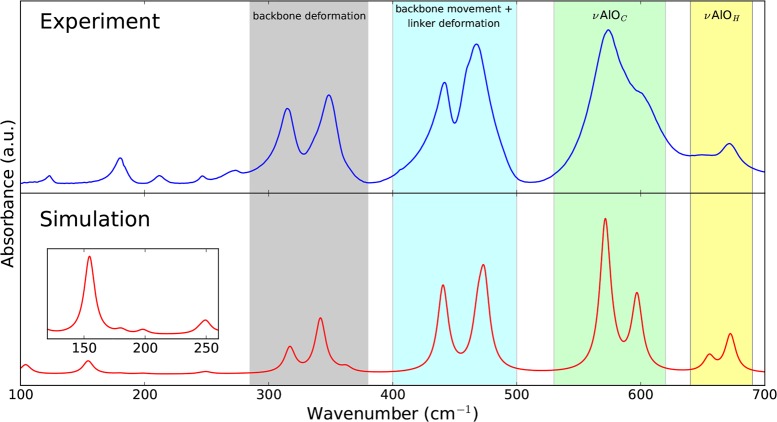
Besides DRIFT measurements, we also performed ATR IR measurements on the CP phase of MIL-53(Al), allowing us to obtain high-quality spectra in the far-IR range down to 100 cm–1. Assigning the vibrational modes based on tabulated data of functional group vibrations is no longer possible in this region, revealing the importance of our static DFT calculations, which proved to perform well in the mid-IR range. In the literature, mode identification was performed before by Salazar et al. for modes with frequencies above 400 cm–1.29 However, below 700 cm–1, their assignation becomes unreliable as they were unable to identify the aluminum-oxide backbone stretching modes correctly. From Figure 4, we see that the resemblance of our model to the experimental spectrum in the range of 100–700 cm–1 is striking. This can also be concluded from the similarity index, which yields 0.96 with an optimal scaling factor and line shape.
Figure 4.
Comparison of the far-IR spectrum (100–700 cm–1) of the CP phase of MIL-53(Al) obtained by FTIR spectroscopy using the single-bounce diamond ATR device (top) and by static DFT calculations (bottom). The theoretical spectrum was blue-shifted with a scaling factor of 1.025 and received a Lorentzian line shape with a FWHM of 10 cm–1. The regions with the most IR-active vibrational modes are indicated.
Between 300 and 700 cm–1, four different regions of vibrations appear (see Figure S11 in the Supporting Information for visualization). Above 640 cm–1, we already discussed the presence of stretching modes of the aluminum-oxide backbone. Within the region of 520–620 cm–1, stretching modes of the aluminum atom with the oxygen atoms of the carboxyl group emerge. Between 400 and 500 cm–1, we find in-plane and out-of-plane movements of the ring structure (ν16b ring mode) coupled with rocking of the aluminum atom, inducing a bend in the metal-oxide backbone. The last frequency region with intense peaks is observed within the 280–380 cm–1 range and mainly contains modes inducing deformations of the metal-oxide backbone. Below 280 cm–1, we distinguish between five IR-active modes, which are slightly red-shifted by 20–40 cm–1 in the simulation when compared with experiment. These modes are made up of combinations of scissoring modes (δOCAlOC) and linker rocking mostly coupled with δOH vibrations inducing a change in dipole moment.
4.2.2. Comparison between the Simulated CP and LP Phases
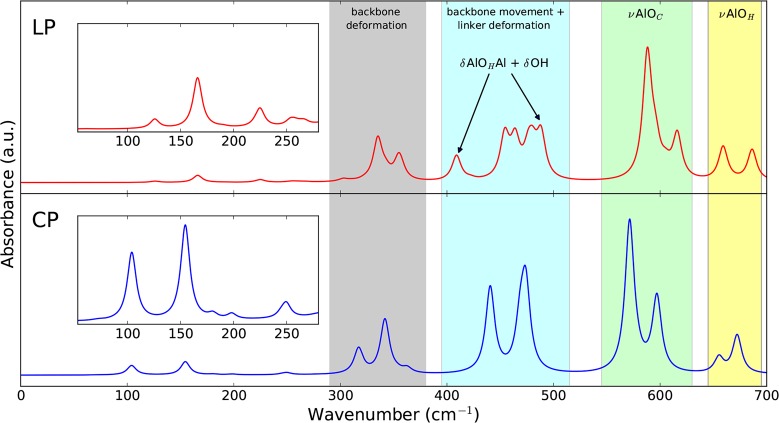
Our model proved to be very accurate in the mid-IR range (similarity index of 0.84), and also, the simulated far-IR spectrum of the CP phase showed excellent agreement with experiment (similarity index of 0.96). Therefore, even though the experimental far-IR data for the LP phase are missing, it is interesting to inspect the differences with the CP phase spectrum predicted by static DFT calculations. In Figure 5, we compare the simulated far-IR spectrum of the LP phase with the CP phase.
Figure 5.
Comparison of the theoretical far-IR spectrum (0–700 cm–1) of the CP and LP phases of MIL-53(Al). The spectra were blue-shifted with a scaling factor of 1.025 and received a Lorentzian line shape with a FWHM of 10 cm–1.
A first remarkable difference between the two spectra is the general blue shift of the vibrational frequencies in the LP phase compared with the CP phase. This effect was already slightly visible for some functional group vibrations in the mid-IR range, but it becomes much more pronounced in the far-IR range. We believe that the lower frequencies in the CP phase are a result of the stronger dispersion interactions in the denser structure.20 This weakens the forces between neighboring atoms, yielding lower covalent and ionic bond strengths.62,63
Besides the frequency shift, two IR-active modes arise in the spectrum of the LP phase, which were not present in the CP phase spectrum. These modes can be identified as bending modes of the metal-oxide backbone. In the LP structure, these bending modes are coupled with a δOH vibration, which makes them IR-active. In the CP structure, the stronger hydrogen bond interactions between opposite aluminum-oxide backbones inhibit this coupling with δOH vibrations, and as a result, the modes remain optically inactive (see Figure S12 in the Supporting Information for visualization).
Above 300 cm–1, most of the modes appearing in the CP phase have their counterparts in the LP phase. At lower frequencies, this one-to-one correspondence between modes is no longer present as these low-frequency modes correspond to collective motions that may differ between the CP and LP structures. In section 4.4, we specifically discuss those low-frequency modes describing the breathing transition in MIL-53(Al).
4.2.3. Comparison between the Experimental NP-h and CP Phases
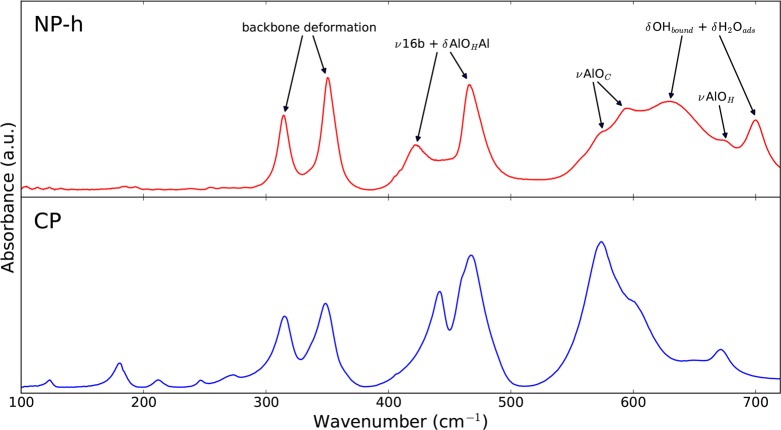
Under atmospheric conditions, MIL-53(Al) is usually present in the NP-h phase. Therefore, it is important to have a notion of its characterizing vibrational modes. As the mid-IR spectrum has been reported numerous times,13,17,29 we will restrict ourselves to a discussion of the IR spectrum in the range of 100–700 cm–1. Experimentally, this spectrum was obtained in transmittance mode. As mentioned in section 3 on computational details, a theoretical IR spectrum was not calculated. In Figure 6, we compare the experimental IR spectrum of the NP-h phase with the one of the CP phase.
Figure 6.
Comparison of the experimental far-IR spectrum (100–700 cm–1) of the CP and NP-h phase of MIL-53(Al). The CP phase was recorded with a single-bounce ATR device, while the NP-h phase was obtained in transmittance mode.
Above 500 cm–1, we observe important differences between both spectra, caused by additional rocking modes of adsorbed water molecules in the NP-h phase.29 Between 300 and 500 cm–1, these modes are not present and we recognize similar bands in the NP-h phase spectrum as in the CP phase spectrum. The most striking difference in this frequency range is a red shift of one of the bands that represent a combination of the in-plane and out-of-plane movement of the aromatic ring with bending of the metal-oxide backbone. This shift may be caused by hydrogen bonds weakening the forces coupled with the in-plane movement of the aromatic ring. Below 300 cm–1, the intensities of the bands in the NP-h phase spectrum are much lower than those in the CP phase spectrum. One of the reasons is the use of the transmission mode instead of the ATR mode applied for the CP phase spectrum. The latter highlights low-frequency modes. Another reason could be broadening of the bands due to the presence of adsorbed water molecules. Furthermore, the use of a pellet in transmission mode results in an interference pattern, which becomes clearly visible below 130 cm–1.
4.3. Raman Spectrum of MIL-53(Al)
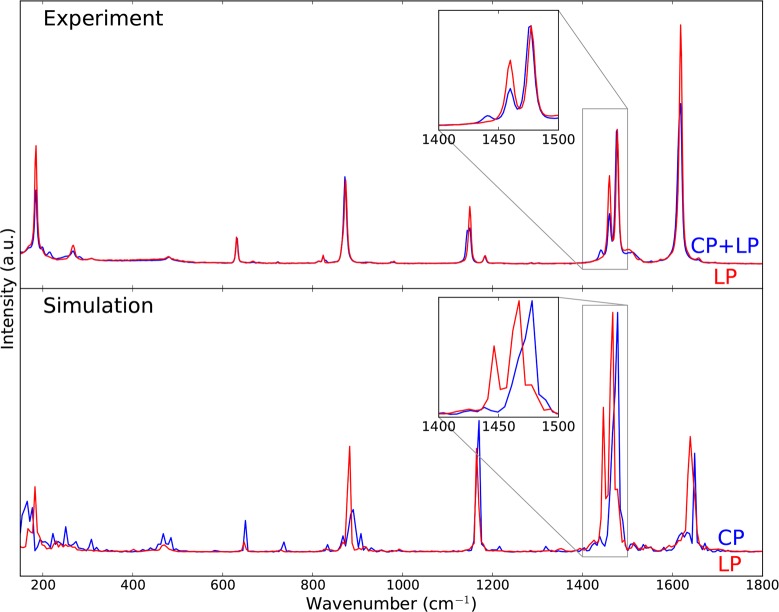
To acquire a more complete view of the vibrational modes of MIL-53(Al), we supplemented our IR spectroscopy with Raman spectroscopy, which results in active modes complementary to the IR spectrum. Experimentally, we measured the Raman spectra of the LP phase on the one hand and a mixture of the CP and LP phase on the other hand. Measurement of the Raman spectrum of the pure CP phase was not possible due to laser heating of the sample. In Figure 7, the experimental results in the range of 150–1800 cm–1 are compared by the theoretical spectra of the CP and LP phases obtained by AIMD simulations (see Figure S10 in the Supporting Information for the Raman spectra in the range of 2800–4000 cm–1). The simulated spectra are shifted with a scaling factor of 1.035 (see section S2.3 in the Supporting Information), which differs from the scaling factor used for the static simulations, mainly due to the use of a different basis set. Nevertheless, this scaling factor is still in agreement with results found in the literature.58−61 We observe that the experimental spectra look similar for wavenumbers above 400 cm–1, except at around 1450 cm–1, where one of the CO2 symmetric stretch peaks undergoes a shift upon transition from the CP to the LP phase. This spectral difference was also observed by Hamon et al.25 In the same frequency range, the theoretical Raman spectra show satisfactory agreement with the experimental results. All peaks observed in the measurements do appear in the simulation, albeit with different intensities. Notably, the characterizing difference in the Raman spectra of the CP and LP phases at around 1450 cm–1 is clearly captured in the simulation. At wavenumbers lower than 300 cm–1, we note more Raman-active peaks in the experimental spectrum of the mixture of CP and LP phases than that in the pure LP phase spectrum, indicating differences in collective vibrations. This feature is also predicted by our AIMD simulation, although it becomes increasingly difficult to match the theoretical Raman spectrum of the CP phase with experiment at such low frequencies. This difficulty is related to the limited simulation time for these expensive simulations, causing insufficient sampling of the low-frequency modes. To the best of our knowledge, this is the first time that experimental and theoretical Raman spectra of MIL-53(Al) are reported in the range of 150–4000 cm–1. The results obtained here are very rewarding and open perspectives to simulate Raman spectra of other complex nanostructured materials.
Figure 7.
Comparison of the experimental (top) and theoretical (bottom) Raman spectra of the CP (blue) and LP (red) phases of MIL-53(Al) in the range of 150–1800 cm–1. The theoretical Raman spectra were blue-shifted with a scaling factor of 1.035.
4.4. Collective Vibrations with Impact on the Breathing Mechanism
From the preceding discussion, it is clear that our static DFT simulations are very well suited to describe the vibrational modes of the CP and LP phases of MIL-53(Al). We pointed out specific fingerprint modes that distinguish between the spectra of the CP and LP phases in the mid-IR range, which were related to shifts of the aluminum-oxide backbone stretch modes (IR-active) and of one of the symmetric stretch modes of the carboxyl group (Raman-active). In the far-IR range, the spectra of both phases were more distinct, primarily in the low-frequency region (below 300 cm–1). In this respect, the collective vibrations, which affect the lattice as a whole, are of particular interest. These modes are predominantly located at frequencies below 100 cm–1. The LP phase has 12 modes in this frequency range, whereas we find only 7 modes for the CP phase, excluding the 3 modes of almost zero frequency representing translations of the complete structure (see Tables S5 and S6 in the Supporting Information). The deficit of very low frequency modes in the CP phase can be attributed to the constrained movement, which shifts modes to higher frequencies. In the following, we will discuss the modes that are of importance for the breathing mechanism.
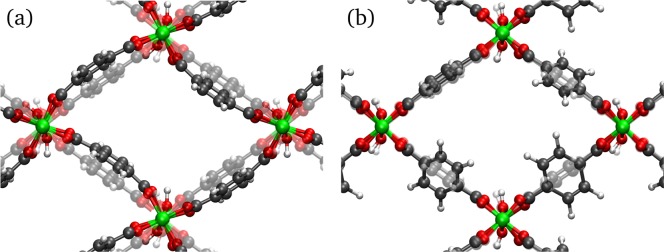
The lowest-frequency mode appearing in both the CP (11 cm–1) and LP (15 cm–1) phase concerns the opposite rotation of neighboring metal-oxide backbones inducing a weak trampoline motion of the organic linker (Figure 8a). This mode is of minor importance for the CP-to-LP transition, but in MIL-53(Sc), it is assumed to be the driving mechanism in the transition of the CP phase to an even denser structure.64
Figure 8.
(a) Rotation of the metal-oxide backbone inducing a trampoline-like motion of the linker (11 cm–1 in CP phase, 15 cm–1 in LP phase). (b) Linker rotation (69 cm–1 in CP phase, 54 cm–1 in LP phase). Videos of these modes are available in the Supporting Information.
At slightly higher frequencies, multiple modes are present inducing rotation of the organic linker (Figure 8b). In the LP phase, four of these modes can be observed. A single mode, located at 47 cm–1, consists of a complete linker rotation induced by alternating rotation of the octahedra on the metal-oxide backbone. A triply degenerate mode, located at 54 cm–1, gives rise to rotations of the aromatic ring only. In contrast, we identified only a double-degenerate mode with linker rotations below 100 cm–1 in the CP phase. In addition, the frequency of the modes is blue-shifted to 69 cm–1. This shift was already reported by Liu et al.15 and was assumed to result from the constrained motion in the CP phase. This observation leads to the speculation that linker rotations trigger breathing of the structure. Moreover, Walker et al.20 argued that the larger number of very low frequency modes associated with linker rotations in the LP phase drives the CP-to-LP transition at higher temperatures because of the increased entropy. The lack of modes inducing linker rotations in the CP phase in the frequency region below 100 cm–1 is compensated by a doubly degenerate mode inducing linker rotation located at 151 cm–1, again due to a heavily constrained motion.
Besides linker rotations, we discovered several other low-frequency modes that give rise to enhanced π–π interactions and, subsequently, can trigger breathing in MIL-53(Al). These modes were found to be different in the CP and LP phases. For the LP phase, the first two modes are located at 59 and 60 cm–1 and contain a trampoline-like motion of the organic linker (Figure 9a). Although the trampoline mode itself does not include changes in the unit cell volume because it represents a normal mode with fixed unit cell, it can be expected to be related to volume-changing breathing modes as it brings the organic linkers closer together. As a result, stronger π–π interactions can be present between opposite linkers. These interactions play a significant role in the CP phase. At low temperatures, they favor the presence of the CP phase over the LP phase,20 and in MIL-53(Fe), they hinder the occurrence of the LP phase even at higher temperatures.65 Therefore, we can assume that the modes containing trampoline-like motions trigger the LP-to-CP transition. Furthermore, at 181 cm–1, a mode consisting of synchronous scissoring of the metal octahedra inducing a seesaw motion of the organic linker was identified (Figure 9b). Within this motion, the opposite linkers tend to align, which again gives rise to increased π–π interactions and a possible contraction of the pores.
Figure 9.
Low-frequency vibrations of the LP phase possibly affecting the breathing mechanism. (a) Trampoline-like motion of the linker (59 cm–1). (b) Scissoring of the octahedra (181 cm–1). Videos of these modes are available in the Supporting Information.
As the linkers in the CP phase are already closely packed, the trampoline-like motion is heavily constrained. As a consequence, the modes containing trampoline-like motions are shifted to higher wavenumbers compared to the LP phase. The first “breathing mode” in the CP phase is located at 123 cm–1 and consists of a trampoline-like motion of the linker in combination with translation of the linker along the aluminum-oxide backbone and rotation of the octahedra (Figure 10). Other trampoline-like motions that are able to open the pore are found at 138, 139, and 143 cm–1. These modes weaken the strong π–π interactions and can lead to a transition to the LP phase.
Figure 10.
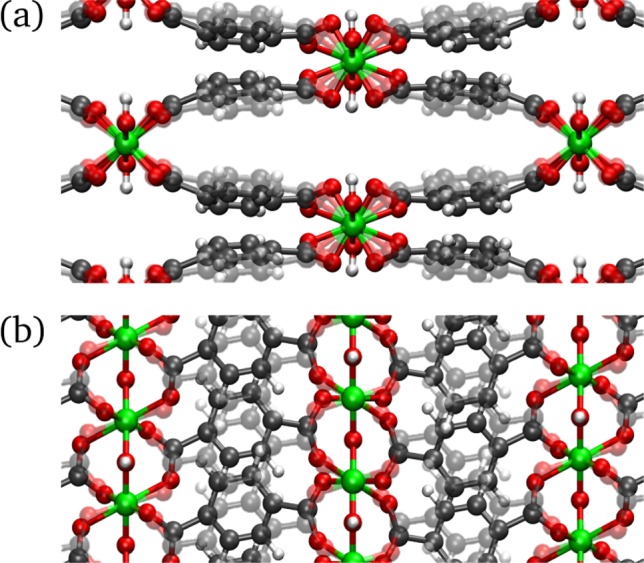
Low-frequency vibration of the CP phase located at 123 cm–1 possibly affecting the breathing mechanism. (a) View of the diamond-shaped channel showing the trampoline-like motion of the linker and the rotation of the octahedra. (b) View along the aluminum-oxide backbone showing the translation of the linker. Videos of this mode are available in the Supporting Information.
5. Conclusions
In this paper, we examined the phase transition in MIL-53(Al) by a combination of experimental and computational vibrational spectroscopy. Experimentally, we applied a variety of techniques to record high-quality IR and Raman spectra of the CP, NP-h, and LP phases of MIL-53(Al) in the mid- and far-IR range. This revealed a unique vibrational fingerprint in the IR spectrum related to the stretching modes of the aluminum-oxide backbone, which is very well suited to identify breathing in the structure. Further insight into the breathing phenomenon was obtained by static and dynamic DFT calculations. We performed static DFT simulations to determine the theoretical IR spectra of the CP and LP phases of MIL-53(Al). These calculations were able to correctly predict all but one of the characterizing vibrational shifts of the CP-to-LP transition in the mid-IR range, including the aluminum-oxide backbone stretching modes. The almost one-to-one correspondence of our static DFT calculations with the experimental spectrum in the far-IR allowed for a detailed description of the IR-active low-frequency modes, which is unprecedented for a material of the MIL-53 family. Furthermore, we determined the theoretical Raman spectra of the MIL-53(Al) CP and LP phases for the first time using ab initio molecular dynamics simulations and obtained satisfactory agreement with the experimental spectra. Finally, we highlighted several collective vibrations that may trigger breathing in MIL-53(Al). Of particular interest are the collective vibrations showing a trampoline-like deformation of the linker as these increase π–π interactions, resulting in contraction of the pore.
Acknowledgments
This work is supported by the Fund for Scientific Research Flanders (FWO), the Research Board of the Ghent University (BOF), and BELSPO in the frame of IAP/7/05. V.V.S. acknowledges funding from the European Union’s Horizon 2020 research and innovation programme [consolidator ERC Grant Agreement No. 647755 - DYNPOR (2015–2020)]. H.V. acknowledges funding from the Hercules Foundation and the Research Foundation - Flanders (FWO) [FT-IMAGER - AUGE/13/16 and Project Grant No. G0048.13N]. Computational resources (Stevin Supercomputer Infrastructure) and services were provided by Ghent University.
Supporting Information Available
The Supporting Information is available free of charge on the ACS Publications website at DOI: 10.1021/acs.jpcc.7b11031.
Powder X-ray diffraction patterns, investigation of the influence of dilution on the spectra, comparison of the different experimental techniques, computational and experimental lattice parameters, comparison of DFPT and Berry phase approach, quantification of correspondence of experimental and theoretical spectra, IR spectra obtained by AIMD simulations, experimental and theoretical IR and Raman spectra in the range of 2800–4000 cm–1, complete mode identification, visualization of IR-active modes, and description of low-frequency vibrations in CP and LP phases (PDF)
Videos of all modes discussed in this paper (ZIP)
The authors declare no competing financial interest.
Supplementary Material
References
- Furukawa H.; Cordova K. E.; O’Keeffe M.; Yaghi O. M. The chemistry and applications of metal-organic frameworks. Science 2013, 341, 1230444. 10.1126/science.1230444. [DOI] [PubMed] [Google Scholar]
- Kitagawa S. Future porous materials. Acc. Chem. Res. 2017, 50, 514–516. 10.1021/acs.accounts.6b00500. [DOI] [PubMed] [Google Scholar]
- Maurin G.; Serre C.; Cooper A.; Férey G. The new age of MOFs and of their porous-related solids. Chem. Soc. Rev. 2017, 46, 3104–3107. 10.1039/C7CS90049J. [DOI] [PubMed] [Google Scholar]
- Moghadam P. Z.; Li A.; Wiggin S. B.; Tao A.; Maloney A. G.; Wood P. A.; Ward S. C.; Fairen-Jimenez D. Development of a Cambridge structural database subset: a collection of metal–organic frameworks for past, present, and future. Chem. Mater. 2017, 29, 2618–2625. 10.1021/acs.chemmater.7b00441. [DOI] [Google Scholar]
- Wilmer C. E.; Leaf M.; Lee C. Y.; Farha O. K.; Hauser B. G.; Hupp J. T.; Snurr R. Q. Large-scale screening of hypothetical metal–organic frameworks. Nat. Chem. 2012, 4, 83–89. 10.1038/nchem.1192. [DOI] [PubMed] [Google Scholar]
- Rogge S. M. J.; Bavykina A.; Hajek J.; Garcia H.; Olivos-Suarez A. I.; Sepúlveda-Escribano A.; Vimont A.; Clet G.; Bazin P.; Kapteijn F.; et al. Metal–organic and covalent organic frameworks as single-site catalysts. Chem. Soc. Rev. 2017, 46, 3134–3184. 10.1039/C7CS00033B. [DOI] [PMC free article] [PubMed] [Google Scholar]
- Li J.-R.; Sculley J.; Zhou H.-C. Metal–organic frameworks for separations. Chem. Rev. 2012, 112, 869–932. 10.1021/cr200190s. [DOI] [PubMed] [Google Scholar]
- Horcajada P.; Serre C.; Maurin G.; Ramsahye N. A.; Balas F.; Vallet-Regi M.; Sebban M.; Taulelle F.; Férey G. Flexible porous metal-organic frameworks for a controlled drug delivery. J. Am. Chem. Soc. 2008, 130, 6774–6780. 10.1021/ja710973k. [DOI] [PubMed] [Google Scholar]
- Cui Y.; Yue Y.; Qian G.; Chen B. Luminescent functional metal–organic frameworks. Chem. Rev. 2012, 112, 1126–1162. 10.1021/cr200101d. [DOI] [PubMed] [Google Scholar]
- Kreno L. E.; Leong K.; Farha O. K.; Allendorf M.; Van Duyne R. P.; Hupp J. T. Metal–organic framework materials as chemical sensors. Chem. Rev. 2012, 112, 1105–1125. 10.1021/cr200324t. [DOI] [PubMed] [Google Scholar]
- Schneemann A.; Bon V.; Schwedler I.; Senkovska I.; Kaskel S.; Fischer R. A. Flexible metal–organic frameworks. Chem. Soc. Rev. 2014, 43, 6062–6096. 10.1039/C4CS00101J. [DOI] [PubMed] [Google Scholar]
- Depauw H.; Nevjestić I.; Wang G.; Leus K.; Callens F.; De Canck E.; De Buysser K.; Vrielinck H.; Van Der Voort P. Discovery of a novel, large pore phase in a bimetallic Al/V metal-organic framework. J. Mater. Chem. A 2017, 5, 24580–24584. 10.1039/C7TA08103K. [DOI] [Google Scholar]
- Loiseau T.; Serre C.; Huguenard C.; Fink G.; Taulelle F.; Henry M.; Bataille T.; Férey G. A rationale for the large breathing of the porous aluminum terephthalate (MIL-53) upon hydration. Chem. - Eur. J. 2004, 10, 1373–1382. 10.1002/chem.200305413. [DOI] [PubMed] [Google Scholar]
- Serre C.; Bourrelly S.; Vimont A.; Ramsahye N. A.; Maurin G.; Llewellyn P. L.; Daturi M.; Filinchuk Y.; Leynaud O.; Barnes P.; et al. An explanation for the very large breathing effect of a metal–organic framework during CO2 adsorption. Adv. Mater. 2007, 19, 2246–2251. 10.1002/adma.200602645. [DOI] [Google Scholar]
- Liu Y.; Her J.-H.; Dailly A.; Ramirez-Cuesta A. J.; Neumann D. A.; Brown C. M. Reversible structural transition in MIL-53 with large temperature hysteresis. J. Am. Chem. Soc. 2008, 130, 11813–11818. 10.1021/ja803669w. [DOI] [PubMed] [Google Scholar]
- Boutin A.; Springuel-Huet M.-A.; Nossov A.; Gédéon A.; Loiseau T.; Volkringer C.; Férey G.; Coudert F.-X.; Fuchs A. H. Breathing transitions in MIL-53(Al) metal–organic framework upon xenon adsorption. Angew. Chem., Int. Ed. 2009, 48, 8314–8317. 10.1002/anie.200903153. [DOI] [PubMed] [Google Scholar]
- Volkringer C.; Loiseau T.; Guillou N.; Férey G.; Elkaïm E.; Vimont A. XRD and IR structural investigations of a particular breathing effect in the MOF-type gallium terephthalate MIL-53(Ga). Dalton Trans. 2009, 2241–2249. 10.1039/b817563b. [DOI] [PubMed] [Google Scholar]
- Nevjestić I.; Depauw H.; Gast P.; Tack P.; Deduytsche D.; Leus K.; Van Landeghem M.; Goovaerts E.; Vincze L.; Detavernier C.; et al. Sensing the framework state and guest molecules in MIL-53(Al) via the electron paramagnetic resonance spectrum of VIV dopant ions. Phys. Chem. Chem. Phys. 2017, 19, 24545–24554. 10.1039/C7CP04760F. [DOI] [PubMed] [Google Scholar]
- Yot P. G.; Boudene Z.; Macia J.; Granier D.; Vanduyfhuys L.; Verstraelen T.; Van Speybroeck V.; Devic T.; Serre C.; Férey G.; et al. Metal–organic frameworks as potential shock absorbers: the case of the highly flexible MIL-53(Al). Chem. Commun. 2014, 50, 9462–9464. 10.1039/C4CC03853C. [DOI] [PubMed] [Google Scholar]
- Walker A. M.; Civalleri B.; Slater B.; Mellot-Draznieks C.; Corà F.; Zicovich-Wilson C. M.; Román-Pérez G.; Soler J. M.; Gale J. D. Flexibility in a metal–organic framework material controlled by weak dispersion forces: the bistability of MIL-53(Al). Angew. Chem., Int. Ed. 2010, 49, 7501–7503. 10.1002/anie.201002413. [DOI] [PubMed] [Google Scholar]
- Nevjestić I.; Depauw H.; Leus K.; Rampelberg G.; Murray C. A.; Detavernier C.; Van Der Voort P.; Callens F.; Vrielinck H. In situ electron paramagnetic resonance and X-ray diffraction monitoring of temperature-induced breathing and related structural transformations in activated V-doped MIL-53(Al). J. Phys. Chem. C 2016, 120, 17400–17407. 10.1021/acs.jpcc.6b04402. [DOI] [Google Scholar]
- Ryder M. R.; Civalleri B.; Bennett T. D.; Henke S.; Rudić S.; Cinque G.; Fernandez-Alonso F.; Tan J.-C. Identifying the role of terahertz vibrations in metal-organic frameworks: from gate-opening phenomenon to shear-driven structural destabilization. Phys. Rev. Lett. 2014, 113, 215502. 10.1103/PhysRevLett.113.215502. [DOI] [PubMed] [Google Scholar]
- Ryder M. R.; Civalleri B.; Cinque G.; Tan J.-C. Discovering connections between terahertz vibrations and elasticity underpinning the collective dynamics of the HKUST-1 metal–organic framework. CrystEngComm 2016, 18, 4303–4312. 10.1039/C5CE02347E. [DOI] [Google Scholar]
- Vimont A.; Travert A.; Bazin P.; Lavalley J.-C.; Daturi M.; Serre C.; Férey G.; Bourrelly S.; Llewellyn P. L. Evidence of CO2 molecule acting as an electron acceptor on a nanoporous metal–organic-framework MIL-53 or Cr3+(OH)(O2C–C6H4–CO2). Chem. Commun. 2007, 3291–3293. 10.1039/b703468g. [DOI] [PubMed] [Google Scholar]
- Hamon L.; Llewellyn P. L.; Devic T.; Ghoufi A.; Clet G.; Guillerm V.; Pirngruber G. D.; Maurin G.; Serre C.; Driver G.; et al. Co-adsorption and separation of CO2-CH4 mixtures in the highly flexible MIL-53(Cr) MOF. J. Am. Chem. Soc. 2009, 131, 17490–17499. 10.1021/ja907556q. [DOI] [PubMed] [Google Scholar]
- Ravon U.; Chaplais G.; Chizallet C.; Seyyedi B.; Bonino F.; Bordiga S.; Bats N.; Farrusseng D. Investigation of acid centers in MIL-53(Al, Ga) for Brønsted-type catalysis: in situ FTIR and ab initio molecular modeling. ChemCatChem 2010, 2, 1235–1238. 10.1002/cctc.201000055. [DOI] [Google Scholar]
- Bourrelly S.; Moulin B.; Rivera A.; Maurin G.; Devautour-Vinot S.; Serre C.; Devic T.; Horcajada P.; Vimont A.; Clet G.; et al. Explanation of the adsorption of polar vapors in the highly flexible metal–organic framework MIL-53(Cr). J. Am. Chem. Soc. 2010, 132, 9488–9498. 10.1021/ja1023282. [DOI] [PubMed] [Google Scholar]
- Boutin A.; Bousquet D.; Ortiz A. U.; Coudert F.-X.; Fuchs A. H.; Ballandras A.; Weber G.; Bezverkhyy I.; Bellat J.-P.; Ortiz G.; et al. Temperature-induced structural transitions in the gallium-based MIL-53 metal–organic framework. J. Phys. Chem. C 2013, 117, 8180–8188. 10.1021/jp312179e. [DOI] [Google Scholar]
- Salazar J.; Weber G.; Simon J.; Bezverkhyy I.; Bellat J. Characterization of adsorbed water in MIL-53(Al) by FTIR spectroscopy and ab-initio calculations. J. Chem. Phys. 2015, 142, 124702. 10.1063/1.4914903. [DOI] [PubMed] [Google Scholar]
- Mihaylov M.; Andonova S.; Chakarova K.; Vimont A.; Ivanova E.; Drenchev N.; Hadjiivanov K. An advanced approach for measuring acidity of hydroxyls in confined space: a FTIR study of low-temperature CO and 15N2 adsorption on MOF samples from the MIL-53(Al) series. Phys. Chem. Chem. Phys. 2015, 17, 24304–24314. 10.1039/C5CP04139B. [DOI] [PubMed] [Google Scholar]
- Andonova S. M.; Ivanova E.; Yang J.; Hadjiivanov K. I. Adsorption forms of CO2 on MIL-53(Al) and MIL-53(Al)-OHx as revealed by FTIR spectroscopy. J. Phys. Chem. C 2017, 121, 18665–18673. 10.1021/acs.jpcc.7b05538. [DOI] [Google Scholar]
- Titov K.; Zeng Z.; Ryder M. R.; Chaudhari A.; Civalleri B.; Kelley C. S.; Frogley M. D.; Cinque G.; Tan J.-C. Probing dielectric properties of metal-organic frameworks: MIL-53(Al) as a model system for theoretical predictions and experimental measurements via synchrotron far- and mid-infrared spectroscopy. J. Phys. Chem. Lett. 2017, 8, 5035–5040. 10.1021/acs.jpclett.7b02003. [DOI] [PubMed] [Google Scholar]
- Wilson E. B. Jr The normal modes and frequencies of vibration of the regular plane hexagon model of the benzene molecule. Phys. Rev. 1934, 45, 706. 10.1103/PhysRev.45.706. [DOI] [Google Scholar]
- Rallapalli P.; Patil D.; Prasanth K. P.; Somani R. S.; Jasra R. V.; Bajaj H. C. An alternative activation method for the enhancement of methane storage capacity of nanoporous aluminium terephthalate, MIL-53(Al). J. Porous Mater. 2010, 17, 523–528. 10.1007/s10934-009-9320-5. [DOI] [Google Scholar]
- Férey G. Swelling hybrid solids. Z. Anorg. Allg. Chem. 2012, 638, 1897–1909. 10.1002/zaac.201200142. [DOI] [Google Scholar]
- Kresse G.; Furthmüller J. Efficient iterative schemes for ab initio total-energy calculations using a plane-wave basis set. Phys. Rev. B: Condens. Matter Mater. Phys. 1996, 54, 11169. 10.1103/PhysRevB.54.11169. [DOI] [PubMed] [Google Scholar]
- Perdew J. P.; Burke K.; Ernzerhof M. Generalized gradient approximation made simple. Phys. Rev. Lett. 1996, 77, 3865. 10.1103/PhysRevLett.77.3865. [DOI] [PubMed] [Google Scholar]
- Blöchl P. E. Projector augmented-wave method. Phys. Rev. B: Condens. Matter Mater. Phys. 1994, 50, 17953. 10.1103/PhysRevB.50.17953. [DOI] [PubMed] [Google Scholar]
- Monkhorst H. J.; Pack J. D. Special points for Brillouin-zone integrations. Phys. Rev. B: Condens. Matter Mater. Phys. 1976, 13, 5188. 10.1103/PhysRevB.13.5188. [DOI] [Google Scholar]
- Grimme S. Semiempirical GGA-type density functional constructed with a long-range dispersion correction. J. Comput. Chem. 2006, 27, 1787–1799. 10.1002/jcc.20495. [DOI] [PubMed] [Google Scholar]
- Grimme S.; Ehrlich S.; Goerigk L. Effect of the damping function in dispersion corrected density functional theory. J. Comput. Chem. 2011, 32, 1456–1465. 10.1002/jcc.21759. [DOI] [PubMed] [Google Scholar]
- Giannozzi P.; Baroni S. Vibrational and dielectric properties of C60 from density-functional perturbation theory. J. Chem. Phys. 1994, 100, 8537–8539. 10.1063/1.466753. [DOI] [Google Scholar]
- Baroni S.; De Gironcoli S.; Dal Corso A.; Giannozzi P. Phonons and related crystal properties from density-functional perturbation theory. Rev. Mod. Phys. 2001, 73, 515. 10.1103/RevModPhys.73.515. [DOI] [Google Scholar]
- King-Smith R.; Vanderbilt D. Theory of polarization of crystalline solids. Phys. Rev. B: Condens. Matter Mater. Phys. 1993, 47, 1651. 10.1103/PhysRevB.47.1651. [DOI] [PubMed] [Google Scholar]
- Resta R. Macroscopic polarization in crystalline dielectrics: the geometric phase approach. Rev. Mod. Phys. 1994, 66, 899. 10.1103/RevModPhys.66.899. [DOI] [Google Scholar]
- VandeVondele J.; Krack M.; Mohamed F.; Parrinello M.; Chassaing T.; Hutter J. Quickstep: Fast and accurate density functional calculations using a mixed Gaussian and plane waves approach. Comput. Phys. Commun. 2005, 167, 103–128. 10.1016/j.cpc.2004.12.014. [DOI] [Google Scholar]
- Hutter J.; Iannuzzi M.; Schiffmann F.; VandeVondele J. CP2K: atomistic simulations of condensed matter systems. WIREs Comput. Mol. Sci. 2014, 4, 15–25. 10.1002/wcms.1159. [DOI] [Google Scholar]
- Goedecker S.; Teter M.; Hutter J. Separable dual-space Gaussian pseudopotentials. Phys. Rev. B: Condens. Matter Mater. Phys. 1996, 54, 1703. 10.1103/PhysRevB.54.1703. [DOI] [PubMed] [Google Scholar]
- Nosé S. A molecular dynamics method for simulations in the canonical ensemble. Mol. Phys. 1984, 52, 255–268. 10.1080/00268978400101201. [DOI] [Google Scholar]
- Nosé S. A unified formulation of the constant temperature molecular dynamics methods. J. Chem. Phys. 1984, 81, 511–519. 10.1063/1.447334. [DOI] [Google Scholar]
- Hoover W. G. Canonical dynamics: equilibrium phase-space distributions. Phys. Rev. A: At., Mol., Opt. Phys. 1985, 31, 1695. 10.1103/PhysRevA.31.1695. [DOI] [PubMed] [Google Scholar]
- Martyna G. J.; Klein M. L.; Tuckerman M. Nosé–Hoover chains: the canonical ensemble via continuous dynamics. J. Chem. Phys. 1992, 97, 2635–2643. 10.1063/1.463940. [DOI] [Google Scholar]
- McQuarrie D. A.Statistical Mechanics; Harper and Row, 1976. [Google Scholar]
- Luber S.; Iannuzzi M.; Hutter J. Raman spectra from ab initio molecular dynamics and its application to liquid S-methyloxirane. J. Chem. Phys. 2014, 141, 094503. 10.1063/1.4894425. [DOI] [PubMed] [Google Scholar]
- Fonari A.; Stauffer S.. vasp_raman.py. https://github.com/raman-sc/VASP/ (2013).
- Debie E.; De Gussem E.; Dukor R. K.; Herrebout W.; Nafie L. A.; Bultinck P. A confidence level algorithm for the determination of absolute configuration using vibrational circular dichroism or Raman optical activity. ChemPhysChem 2011, 12, 1542–1549. 10.1002/cphc.201100050. [DOI] [PubMed] [Google Scholar]
- Covington C. L.; Polavarapu P. L. Similarity in dissymmetry factor spectra: a quantitative measure of comparison between experimental and predicted vibrational circular dichroism. J. Phys. Chem. A 2013, 117, 3377–3386. 10.1021/jp401079s. [DOI] [PubMed] [Google Scholar]
- Merrick J. P.; Moran D.; Radom L. An evaluation of harmonic vibrational frequency scale factors. J. Phys. Chem. A 2007, 111, 11683–11700. 10.1021/jp073974n. [DOI] [PubMed] [Google Scholar]
- Paulechka Y. U.; Kabo G. J.; Blokhin A. V.; Shaplov A. S.; Lozinskaya E. I.; Golovanov D. G.; Lyssenko K. A.; Korlyukov A. A.; Vygodskii Y. S. IR and X-ray study of polymorphism in 1-alkyl-3-methylimidazolium bis(trifluoromethanesulfonyl)imides. J. Phys. Chem. B 2009, 113, 9538–9546. 10.1021/jp903702c. [DOI] [PubMed] [Google Scholar]
- Alecu I.; Zheng J.; Zhao Y.; Truhlar D. G. Computational thermochemistry: scale factor databases and scale factors for vibrational frequencies obtained from electronic model chemistries. J. Chem. Theory Comput. 2010, 6, 2872–2887. 10.1021/ct100326h. [DOI] [PubMed] [Google Scholar]
- Duan S.; Fang P.-P.; Fan F.-R.; Broadwell I.; Yang F.-Z.; Wu D.-Y.; Ren B.; Amatore C.; Luo Y.; Xu X.; et al. A density functional theory approach to mushroom-like platinum clusters on palladium-shell over Au core nanoparticles for high electrocatalytic activity. Phys. Chem. Chem. Phys. 2011, 13, 5441–5449. 10.1039/c1cp20096h. [DOI] [PubMed] [Google Scholar]
- Schindler W.; Jonas J. Solvent effects on vibrational phase relaxation and frequency shifts in isobutylene. J. Chem. Phys. 1980, 73, 3547–3552. 10.1063/1.440737. [DOI] [Google Scholar]
- Centrone A.; Siberio-Pérez D. Y.; Millward A. R.; Yaghi O. M.; Matzger A. J.; Zerbi G. Raman spectra of hydrogen and deuterium adsorbed on a metal–organic framework. Chem. Phys. Lett. 2005, 411, 516–519. 10.1016/j.cplett.2005.06.069. [DOI] [Google Scholar]
- Mowat J. P. S.; Seymour V. R.; Griffin J. M.; Thompson S. P.; Slawin A. M. Z.; Fairen-Jimenez D.; Düren T.; Ashbrook S. E.; Wright P. A. A novel structural form of MIL-53 observed for the scandium analogue and its response to temperature variation and CO2 adsorption. Dalton Trans. 2012, 41, 3937–3941. 10.1039/C1DT11729G. [DOI] [PubMed] [Google Scholar]
- Férey G.; Serre C. Large breathing effects in three-dimensional porous hybrid matter: facts, analyses, rules and consequences. Chem. Soc. Rev. 2009, 38, 1380–1399. 10.1039/b804302g. [DOI] [PubMed] [Google Scholar]
Associated Data
This section collects any data citations, data availability statements, or supplementary materials included in this article.


