

Abstract
Most common breast cancer susceptibility variants have been identified through genome-wide association studies (GWAS) of predominantly estrogen receptor (ER)-positive disease1. We conducted a GWAS using 21,468 ER-negative cases and 100,594 controls combined with 18,908 BRCA1 mutation carriers (9,414 with breast cancer), all of European origin. We identified independent associations at P < 5 × 10⁻⁸ with ten variants at nine new loci. At P < 0.05, we replicated associations with 10 of 11 variants previously reported in ER-negative disease or BRCA1 mutation carrier GWAS and observed consistent associations with ER-negative disease for 105 susceptibility variants identified by other studies. These 125 variants explain approximately 14% of the familial risk of this breast cancer subtype. There was high genetic correlation (0.72) between risk of ER-negative breast cancer and breast cancer risk for BRCA1 mutation carriers. These findings may lead to improved risk prediction and inform further fine-mapping and functional work to better understand the biological basis of ER-negative breast cancer.
GWAS have identified 107 SNPs that are independently associated with breast cancer risk2–32. Association studies focused on ER-negative disease, or BRCA1 mutation carriers, who are more likely to develop ER-negative disease (70–80% of cases)33, have identified 11 of these SNPs3,9,12,19,29,30. We aimed to discover additional susceptibility variants for ER-negative breast cancer by performing a GWAS in women of European origin.
New genotyping data were generated for 9,655 ER-negative cases and 45,494 controls from 68 Breast Cancer Association Consortium (BCAC) studies and 15,566 BRCA1 mutation carriers (7,784 with breast cancer) from 58 Consortium of Investigators of Modifiers of BRCA1/2 (CIMBA) studies (Supplementary Tables 1 and 2) using the Illumina OncoArray BeadChip, a 570,000-SNP custom array with genome-wide coverage34. Imputation was used to derive estimated genotypes for ~21 million SNPs, using the 1000 Genomes Project (Phase 3) as the reference; ~11.5 million of these SNPs with imputation r2 >0.3 and minor allele frequency (MAF) >0.005 were included in further analyses. For BCAC data, we estimated per-allele odds ratios (ORs) using logistic regression, adjusting for country and principal components. For CIMBA data, we estimated per-allele hazard ratios (HRs) using a retrospective cohort analysis framework, modeling time to breast cancer and stratifying by country, Ashkenazi Jewish origin and birth cohort35,36 (Online Methods). These analyses were also applied to an independent set of previously generated data from other genome-wide genotyping of additional European participants in 44 BCAC studies (11,813 ER-negative cases and 55,100 controls)9,12,16,20,37,38 and 54 CIMBA studies (3,342 BRCA1 mutation carriers, 1,630 with breast cancer) (Supplementary Tables 1 and 2). Fixed-effects meta-analysis was used to combine results across genotyping initiatives within consortia and, assuming that the odds ratio and hazard ratio estimates approximate the same underlying relative risk, across consortia39.
Results from the combined meta-analysis are summarized in Supplementary Figures 1 and 2. There was minimal inflation of test statistics (λ1,000 = 1.004; Supplementary Fig. 3). We identified ten variants at nine new loci that were independently associated with risk of ER-negative breast cancer at P < 5 × 10⁻⁸ (Table 1, Supplementary Figs. 4–11 and Supplementary Table 3). Two independent signals were observed within 12 kb of each other at 11q22.3, for rs74911261 (MAF = 0.02) and rs11374964 (MAF = 0.42); odds ratio estimates and statistical significance were largely unchanged when each variant was adjusted for the other (Supplementary Table 4). The association with rs66823261 at 8p23.3 was not observed for BRCA1 mutation carriers (P = 0.32, P value for heterogeneity (Phet) = 0.030).
Table 1.
Ten new loci associated with risk of estrogen-receptor-negative breast cancer using meta-analysis of BCAC and CIMBA data
| Location | SNP | Chr. | Position (bp) | Nearest gene | Allelesa | BCAC ER-negative diseaseb
|
CIMBA BRCA1 mutation carriersc
|
Meta-analysis P value | Heterogeneity P valued | ||||||
|---|---|---|---|---|---|---|---|---|---|---|---|---|---|---|---|
| MAF | OR | 95% CI | P value | MAF | HR | 95% CI | P value | ||||||||
| 2p23.3 | rs200648189 | 2 | 24,739,694 | NCOA1 | CT/C | 0.19 | 0.94 | 0.91–0.97 | 4.7 × 10⁻⁴ | 0.20 | 0.88 | 0.84–0.92 | 3.3 × 10⁻⁷ | 9.7 × 10⁻⁹ | 2.0 × 10⁻² |
| 6q23.1 | rs6569648 | 6 | 130,349,119 | L3MBTL3 | T/C | 0.23 | 0.93 | 0.90–0.95 | 4.3 × 10⁻⁸ | 0.22 | 0.94 | 0.90–0.98 | 5.4 × 10⁻³ | 8.3 × 10⁻¹⁰ | 0.64 |
| 8p23.3 | rs66823261 | 8 | 170,692 | RPL23AP53 | T/C | 0.23 | 1.09 | 1.06–1.12 | 5.6 × 10⁻⁹ | 0.22 | 1.02 | 0.98–1.07 | 0.32 | 3.3 × 10⁻⁸ | 3.0 × 10⁻² |
| 8q24.13 | rs17350191 | 8 | 124,757,661 | ANXA13 | C/T | 0.34 | 1.07 | 1.04–1.09 | 2.0 × 10⁻⁸ | 0.34 | 1.08 | 1.04–1.12 | 1.9 × 10⁻⁴ | 1.7 × 10⁻¹¹ | 0.81 |
| 11q22.3 | rs11374964 | 11 | 108,345,515 | KDELC2 | G/GA | 0.42 | 0.94 | 0.92–0.96 | 3.6 × 10⁻⁸ | 0.43 | 0.91 | 0.88–0.95 | 1.3 × 10⁻⁶ | 4.1 × 10⁻¹³ | 0.26 |
| 11q22.3 | rs74911261 | 11 | 108,357,137 | KDELC2 | G/A | 0.02 | 0.82 | 0.75–0.89 | 2.3 × 10⁻⁶ | 0.02 | 0.74 | 0.65–0.84 | 2.0 × 10⁻⁶ | 5.4 × 10⁻¹¹ | 0.17 |
| 16p13.3 | rs11076805 | 16 | 4,106,788 | ADCY9 | C/A | 0.25 | 0.92 | 0.90–0.95 | 2.2 × 10⁻⁸ | 0.25 | 0.96 | 0.92–1.00 | 0.073 | 1.4 × 10⁻⁸ | 0.14 |
| 18q12.1 | rs36194942 | 18 | 25,401,204 | CDH2 | A/AT | 0.30 | 0.94 | 0.91–0.96 | 2.5 × 10⁻⁷ | 0.31 | 0.95 | 0.91–0.99 | 1.4 × 10⁻² | 1.4 × 10⁻⁸ | 0.50 |
| 19p13.2 | rs322144 | 19 | 11,423,703 | TSPAN16 | C/G | 0.47 | 0.95 | 0.93–0.97 | 2.4 × 10⁻⁵ | 0.46 | 0.92 | 0.89–0.96 | 3.7 × 10⁻⁵ | 7.4 × 10⁻⁹ | 0.23 |
| 19q12 | rs113701136 | 19 | 30,277,729 | CCNE1 | C/T | 0.32 | 1.07 | 1.04–1.09 | 1.7 × 10⁻⁷ | 0.32 | 1.05 | 1.01–1.09 | 1.2 × 10⁻² | 6.8 × 10⁻⁹ | 0.57 |
Chr., chromosome; MAF, minor allele frequency; OR, odds ratio per copy of the minor allele; CI, confidence interval; HR, hazard ratio per copy of the minor allele.
More common allele listed first, minor allele listed second.
Combined data from 21,468 ER-negative cases and 100,594 controls of European ancestry from the Breast Cancer Association Consortium (BCAC).
Combined data from 18,908 BRCA1 mutation carriers from the Consortium of Investigators of Modifiers of BRCA1/2 (CIMBA), 9,414 of whom had developed breast cancer.
Test for heterogeneity in effect size for ER-negative disease and overall disease for BRCA1 mutation carriers.
For each of these ten new signals, we identified candidate causal SNPs analytically40,41 (Online Methods) and combined multiple sources of in silico functional annotation from public databases42–52 to identify likely functional variants and target genes. Results are summarized in Figure 1, Supplementary Table 5 (including UCSC Genome Browser links; also see the Supplementary Note) and Supplementary Figures 4–11 (data sources in Supplementary Table 6). Many candidate causal SNPs lie in predicted regulatory regions and are associated with expression of nearby genes in blood or other tissues. At 2p23, the predicted target genes include ADCY3 and NCOA1 (Supplementary Fig. 4). At 6q23.1 (Supplementary Fig. 5), the most plausible target gene is L3MBTL3 (ref. 53). A predicted target at 8q24.13 is FBXO32, which is expressed in ER-negative human mammary epithelial cells (HMECs) but not ER-positive MCF7 breast cancer cells (Supplementary Fig. 7) and has a known role in cancer cachexia54. At 11q22.3 (Fig. 1), a predicted target gene of common risk-associated variants is NPAT55. The rarer SNPs underlying the other 11q22.3 signal are predicted to target ATM, a known breast cancer susceptibility gene56. Three rare coding variants (MAF ≤ 0.03) in ATM, NPAT and KDELC2 are also among the candidate causal SNPs at this locus. At 16p13, predicted target genes include ADCY9 and CREBBP (Supplementary Fig. 8). At 19q12 (Supplementary Fig. 11), a potential target gene (CCNE1) encodes cyclin E1, which is involved in cell cycle control and phosphorylation of NPAT57.
Figure 1.
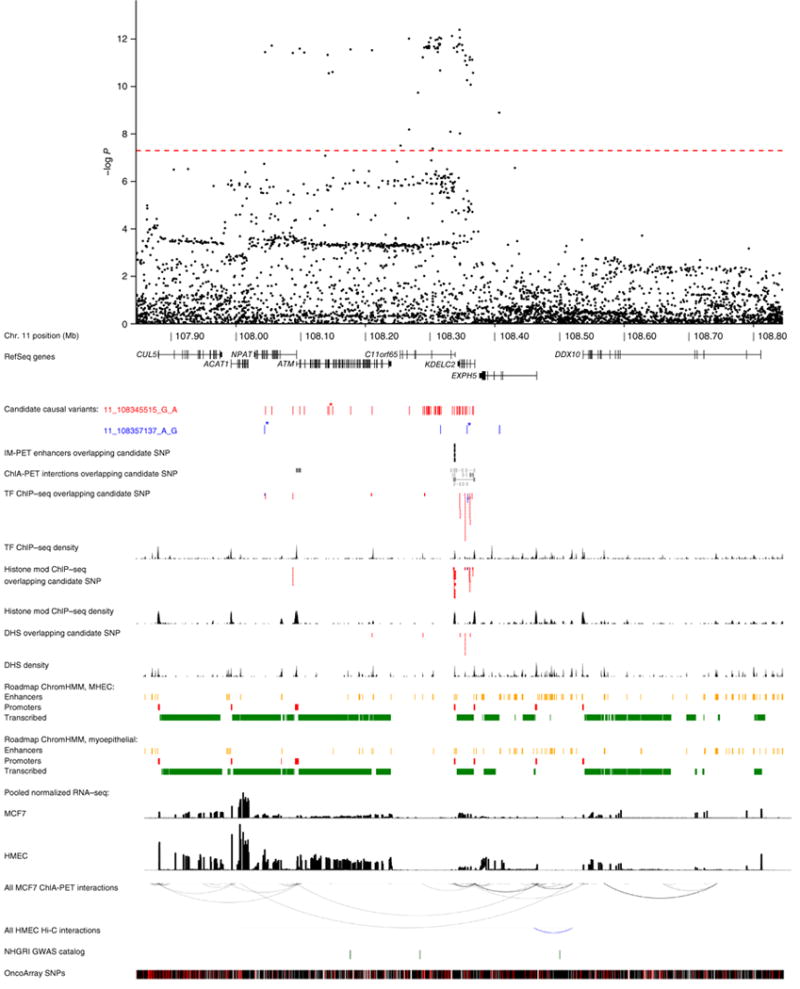
Genomic region around the independent ER-negative risk-associated variants 11_108345515_G_A (rs11374964) and 11_108357137_G_A (rs74911261). A 1-Mb regional association plot shows the statistical significance of all genotyped and imputed SNPs with the genome-wide significance level (P = 5 × 10⁻⁸) represented by the dashed red line. The positions of candidate causal variants for two independent signals (depicted as red and blue ticks) are shown in relation to RefSeq genes. Missense variants are labeled with asterisks. Mammary cell enhancers overlapping candidate SNPs predicted to target nearby genes by IM-PET46 are depicted as black bars. Chromatin interactions from ENCODE ChIA-PET data in MCF7 cells overlapping candidate variants are shaded to reflect interaction confidence scores with darker shading indicating greater confidence. Epigenomic features (derived from publicly available ChIP–seq and DNase–seq data sets) that overlap candidate variants are shown as red or blue segments, depending on the intersected signal. Density tracks show the summed occurrence of ChIP–seq and DNase–seq peak signals at each position. Roadmap Epigenomics Project chromatin state models for HMECs and myoepithelial cells grouped into enhancer, promoter or transcribed annotations are shown as yellow, red and green segments, respectively. Transcript levels in MCF7 cells and HMECs are represented by histograms depicting mean normalized RNA-seq expression. All MCF7 ChIA-PET (ENCODE) and HMEC Hi-C47 chromatin interactions are represented by black and blue arcs, respectively. NHGRI GWAS catalog SNPs are shown as green ticks. All OncoArray SNPs (genotyped or imputed) are shown as black ticks, and uninterrogated, common SNPs (dbSNP138, European (EUR) MAF > 1%) are shown as red ticks. Features may be examined in detail via exploration of a custom UCSC Genome Browser session accessible via hyperlinks within Supplementary Table 5. TF, transcription factor; DHS, DNase I–hypersensitive site.
Expression quantitative trait locus (eQTL) associations were assessed for each candidate causal variant and genes within 1 Mb using 79 ER-negative breast tumors from The Cancer Genome Atlas (TCGA) and 135 normal breast tissue samples from the Molecular Taxonomy of Breast Cancer International Consortium (METABRIC)58–60. The strongest associations identified were for rs6569648 at 6q23.1 with L3MBTL3 (P = 4.3 × 10⁻⁶) and for rs12965632 at 18q12.1 with CDH2 (P = 1.0 × 10⁻⁴), both in METABRIC (Supplementary Table 5). SNP rs6569648 was the top cis-eQTL (of all imputed variants within 1 Mb) for L3MBTL3, while the P value for the eQTL effect of rs12965632 on CDH2 was within two orders of magnitude of those for the top cis-eQTLs for this gene (Supplementary Figs. 12 and 13).
For 10 of the 11 variants previously identified through GWAS of ER-negative disease or overall disease for BRCA1 mutation carriers3,9,12,18,19,30,31 or reported as more strongly associated with ER-negative breast cancer29, associations with ER-negative disease were replicated (P < 0.05) using OncoArray data from BCAC, which do not overlap with any of the discovery studies (Table 2). Effect sizes were generally similar to those originally reported. Using all available CIMBA data, 6 of these 11 variants were associated with breast cancer risk (P < 0.05) for BRCA1 mutation carriers (Table 2). No evidence of association was observed for rs2284378 at 20q11 (ref. 12) in either BCAC or CIMBA (P ≥ 0.46).
Table 2.
Previously reported associations with estrogen-receptor-negative disease: replication using independent data from BCAC and combined results using all BCAC and CIMBA data
| Location | SNP | Chr. | Position (bp) | Ref. | Nearest gene | Allelesa | Independent replication | All available data combined | ||||||||
|---|---|---|---|---|---|---|---|---|---|---|---|---|---|---|---|---|
|
| ||||||||||||||||
| BCAC ER-negative disease (OncoArray)b | BCAC ER-negative diseasec | CIMBA BRCA1 mutation carriersd | ||||||||||||||
|
|
|
|||||||||||||||
| MAF | OR | 95% CI | P value | OR | 95% CI | P value | HR | 95% CI | P value | |||||||
| 1q32.1 | rs6678914 | 1 | 202,187,176 | 19 | LGR6 | G/A | 0.41 | 0.94 | 0.91–0.97 | 1.1 × 10⁻⁴ | 0.92 | 0.90–0.94 | 2.6 × 10⁻¹² | 0.98 | 0.95–1.02 | 0.31 |
| 1q32.1 | rs4245739 | 1 | 204,518,842 | 19 | MDM4 | A/C | 0.26 | 1.12 | 1.09–1.17 | 9.2 × 10⁻¹¹ | 1.14 | 1.11–1.16 | 3.1 × 10⁻²³ | 1.09 | 1.04–1.13 | 7.3 × 10⁻⁵ |
| 2p24.1 | rs12710696 | 2 | 19,320,803 | 19 | MIR4757 | C/T | 0.37 | 1.04 | 1.00–1.07 | 2.5 × 10⁻² | 1.06 | 1.04–1.09 | 6.5 × 10⁻⁸ | 1.01 | 0.98–1.05 | 0.49 |
| 2p23.2 | rs4577244 | 2 | 29,120,733 | 30 | WDR43 | C/T | 0.34 | 0.93 | 0.89–0.96 | 9.6 × 10⁻⁵ | 0.92 | 0.90–0.95 | 1.5 × 10⁻⁹ | 0.92 | 0.88–0.96 | 1.3 × 10⁻⁴ |
| 5p15.33 | rs10069690 | 5 | 1,279,790 | 9,18 | TERT | C/T | 0.26 | 1.19 | 1.14–1.23 | 3.8 × 10⁻²¹ | 1.18 | 1.15–1.21 | 1.5 × 10⁻³⁵ | 1.18 | 1.14–1.23 | 3.7 × 10⁻¹⁶ |
| 6q25.1 | rs3757322 | 6 | 151,942,194 | 29 | ESR1 | T/G | 0.32 | 1.14 | 1.10–1.18 | 5.5 × 10⁻¹⁴ | 1.15 | 1.12–1.18 | 2.8 × 10⁻³¹ | 1.14 | 1.10–1.19 | 2.9 × 10⁻¹² |
| 6q25.2 | rs2747652 | 6 | 152,437,016 | 29 | ESR1 | C/T | 0.48 | 0.92 | 0.89–0.95 | 1.1 × 10⁻⁷ | 0.91 | 0.89–0.93 | 1.9 × 10⁻¹⁸ | 1.00 | 0.97–1.04 | 0.96 |
| 13q22.1 | rs6562760 | 13 | 73,957,681 | 30 | KLF5 | G/A | 0.24 | 0.92 | 0.88–0.95 | 5.0 × 10⁻⁶ | 0.92 | 0.90–0.95 | 8.7 × 10⁻¹⁰ | 0.89 | 0.86–0.93 | 3.5 × 10⁻⁷ |
| 16q12.2 | rs11075995 | 16 | 53,855,291 | 19 | FTO | T/A | 0.30 | 1.07 | 1.03–1.11 | 3.3 × 10⁻⁴ | 1.09 | 1.06–1.12 | 1.0 × 10⁻¹⁰ | 1.01 | 0.97–1.06 | 0.49 |
| 19p13.11 | rs67397200 | 19 | 17,401,404 | 3,31 | ANKLE1 | C/G | 0.32 | 1.17 | 1.13–1.21 | 7.0 × 10⁻²⁰ | 1.17 | 1.14–1.19 | 2.7 × 10−37 | 1.18 | 1.14–1.23 | 2.7 × 10⁻¹⁷ |
| 20q11.21 | rs2284378 | 20 | 32,588,095 | 12 | RALY | C/T | 0.32 | 0.99 | 0.95–1.02 | 0.46 | 1.03 | 1.01–1.06 | 1.7 × 10⁻² | 1.00 | 0.97–1.04 | 0.81 |
Chr., chromosome; ref., publication(s) in reference list in which the association was identified; MAF, minor allele frequency; OR, odds ratio per copy of the minor allele; CI, confidence interval; HR, hazard ratio per copy of the minor allele.
More common allele listed first, minor allele listed second.
Includes Breast Cancer Association Consortium (BCAC) OncoArray data from 9,655 ER-negative cases and 45,494 controls; cases and controls were not included in previously published studies.
Combined data from 21,468 ER-negative cases and 100,594 controls of European ancestry from BCAC, including samples overlapping with previous publications for all SNPs.
Combined data from 18,908 BRCA1 mutation carriers from the Consortium of Investigators of Modifiers of BRCA1/2 (CIMBA), 9,414 of whom had developed breast cancer; including samples overlapping with previous publications for SNPs rs4577244, rs3757322, rs2747652 and rs6562760.
On the basis of odds ratios estimated using BCAC data for all cases with known ER status (16,988 ER negative and 65,275 ER positive), all ten new and ten previously reported and replicated susceptibility SNPs for ER-negative disease were more strongly associated with risk of the ER-negative subtype than the ER-positive subtype (Phet < 0.05, except for the new signal for rs322144 at 19p13.2; Supplementary Table 7). Two variants (rs4245739 at 1q32.1 and rs67397200 at 19p13.11) were not associated with ER-positive disease. For four variants (rs11374964 (11q22.3), rs74911261 (11q22.3), rs6678914 (1q32.1) and rs4577244 (2p23.2)), the risk-associated allele for ER-negative disease was associated with reduced risk of ER-positive disease (P < 0.05).
For these 20 susceptibility SNPs for ER-negative breast cancer, we also assessed association by triple-negative status (negative for ER, progesterone receptor and HER2; Table 3), tumor grade (Table 4) and age at diagnosis (Supplementary Table 8) using BCAC data only. Five SNPs, including the new susceptibility variants at 11q22.3 (rs11374964 and rs74911261), were more strongly associated with both risk of triple-negative disease and risk of higher-grade disease (P < 0.05); however, after adjustment for triple-negative status, heterogeneity in effect by tumor grade was observed only for the variants at 11q22.3 (rs74911261) and 1q32.1 (rs4245739) (P < 0.05). For rs4577244 at 2p23.3, heterogeneity was observed for tumor grade only, while rs2747652 at 6q25.2 was more strongly associated with risk of other (non-triple-negative) ER-negative breast cancer subtypes (P < 0.05). At younger ages at diagnosis, associations appeared to be stronger for two variants (rs10069690 (5p15.33) and rs67397200 (19p13.11)) and weaker for one (rs2747652 (6q25.2)) (P < 0.05).
Table 3.
Associations for ten new and ten previously reported (and replicated) susceptibility loci for estrogen-receptor-negative breast cancer, by triple-negative status
| Location | SNP | Triple-negative disease
|
Other ER-negative disease
|
Heterogeneity P valuea | ||||
|---|---|---|---|---|---|---|---|---|
| OR | 95% CI | P value | OR | 95% CI | P value | |||
| Loci identified by the present study | ||||||||
| 2p23.3 | rs200648189 | 0.95 | 0.90–1.00 | 4.8 × 10⁻² | 0.96 | 0.91–1.03 | 0.24 | 0.36 |
| 6q23.1 | rs6569648 | 0.93 | 0.89–0.97 | 1.4 × 10⁻³ | 0.93 | 0.88–0.98 | 5.6 × 10⁻³ | 0.91 |
| 8p23.3 | rs66823261 | 1.11 | 1.05–1.16 | 3.3 × 10⁻⁵ | 1.12 | 1.07–1.19 | 2.4 × 10⁻⁵ | 0.91 |
| 8q24.13 | rs17350191 | 1.07 | 1.03–1.11 | 7.9 × 10⁻⁴ | 1.07 | 1.02–1.12 | 4.0 × 10⁻³ | 0.67 |
| 11q22.3 | rs11374964 | 0.88 | 0.85–0.91 | 1.9 × 10⁻¹¹ | 0.99 | 0.95–1.04 | 0.75 | 1.5 × 10⁻⁵ |
| 11q22.3 | rs74911261 | 0.76 | 0.66–0.87 | 1.1 × 10⁻⁴ | 0.98 | 0.84–1.13 | 0.76 | 3.0 × 10⁻² |
| 16p13.3 | rs11076805 | 0.91 | 0.87–0.96 | 1.5 × 10⁻⁴ | 0.95 | 0.90–1.00 | 4.5 × 10⁻² | 0.20 |
| 18q12.1 | rs36194942 | 0.93 | 0.89–0.96 | 2.4 × 10⁻⁴ | 0.92 | 0.88–0.97 | 9.9 × 10⁻⁴ | 0.94 |
| 19p13.2 | rs322144 | 0.94 | 0.91–0.98 | 5.9 × 10⁻³ | 0.94 | 0.90–0.98 | 9.7 × 10⁻³ | 0.68 |
| 19q12 | rs113701136 | 1.10 | 1.06–1.15 | 9.1 × 10⁻⁷ | 1.07 | 1.02–1.12 | 4.4 × 10⁻³ | 0.12 |
| Previously reported loci (associations replicated by the present study) | ||||||||
| 1q32.1 | rs6678914 | 0.94 | 0.91–0.98 | 2.1 × 10⁻³ | 0.91 | 0.87–0.95 | 2.0 × 10⁻⁵ | 0.45 |
| 1q32.1 | rs4245739 | 1.18 | 1.13–1.23 | 4.3 × 10⁻¹⁵ | 1.04 | 1.00–1.10 | 7.5 × 10⁻² | 6.5 × 10⁻⁴ |
| 2p24.1 | rs12710696 | 1.07 | 1.03–1.11 | 1.1 × 10⁻³ | 1.04 | 1.00–1.09 | 6.1 × 10⁻² | 0.52 |
| 2p23.2 | rs4577244 | 0.90 | 0.86–0.94 | 5.3 × 10⁻⁶ | 0.94 | 0.89–0.99 | 1.9 × 10⁻² | 0.15 |
| 5p15.33 | rs10069690 | 1.28 | 1.23–1.33 | 2.4 × 10⁻³³ | 1.07 | 1.02–1.12 | 5.4 × 10⁻³ | 5.6 × 10⁻⁸ |
| 6q25.1 | rs3757322 | 1.15 | 1.10–1.19 | 4.3 × 10⁻¹² | 1.14 | 1.10–1.20 | 4.8 × 10⁻⁹ | 0.35 |
| 6q25.2 | rs2747652 | 0.93 | 0.89–0.96 | 5.7 × 10⁻⁵ | 0.87 | 0.83–0.91 | 2.9 × 10⁻¹⁰ | 9.6 × 10⁻³ |
| 13q22.1 | rs6562760 | 0.94 | 0.90–0.98 | 2.8 × 10⁻³ | 0.92 | 0.87–0.96 | 8.8 × 10⁻⁴ | 0.46 |
| 16q12.2 | rs11075995 | 1.06 | 1.02–1.11 | 6.5 × 10⁻³ | 1.08 | 1.03–1.13 | 3.1 × 10⁻³ | 0.81 |
| 19p13.11 | rs67397200 | 1.27 | 1.22–1.32 | 2.0 × 10⁻³² | 1.05 | 1.01–1.10 | 2.7 × 10⁻² | 4.7 × 10⁻¹⁰ |
Only Breast Cancer Association Consortium (BCAC) data are shown. BCAC data were combined from 6,877 triple-negative and 4,467 other ER-negative cases and 83,700 controls. OR, odds ratio per copy of the minor allele; CI, confidence interval.
Analysis of ER-negative cases only, by triple-negative status.
Table 4.
Associations for ten new and ten previously reported (and replicated) susceptibility loci for ER-negative breast cancer, by tumor grade
| Location | SNP | Grade 1
|
Grade 2
|
Grade 3
|
Heterogeneity P valuea | ||||||
|---|---|---|---|---|---|---|---|---|---|---|---|
| OR | 95% CI | P value | OR | 95% CI | P value | OR | 95% CI | P value | |||
| Loci identified by the present study | |||||||||||
| 2p23.3 | rs200648189 | 1.11 | 0.92–1.33 | 0.28 | 0.95 | 0.88–1.03 | 0.23 | 0.96 | 0.91–1.00 | 6.8 × 10⁻² | 0.70 |
| 6q23.1 | rs6569648 | 0.93 | 0.79–1.09 | 0.37 | 0.93 | 0.87–0.99 | 1.6 × 10⁻² | 0.94 | 0.91–0.98 | 3.8 × 10⁻³ | 0.34 |
| 8p23.3 | rs66823261 | 1.13 | 0.96–1.34 | 0.14 | 1.12 | 1.04–1.19 | 1.2 × 10⁻³ | 1.10 | 1.05–1.15 | 1.3 × 10⁻⁵ | 0.11 |
| 8q24.13 | rs17350191 | 1.16 | 1.01–1.34 3.0 × 10 | −2 | 1.05 | 0.99–1.11 | 0.10 | 1.09 | 1.05–1.12 | 4.1 × 10⁻⁶ | 0.94 |
| 11q22.3 | rs11374964 | 0.91 | 0.79–1.04 | 0.16 | 0.99 | 0.94–1.05 | 0.85 | 0.93 | 0.90–0.96 | 1.3 × 10⁻⁵ | 3.0 × 10⁻² |
| 11q22.3 | rs74911261 | 1.22 | 0.81–1.84 | 0.35 | 0.89 | 0.73–1.07 | 0.21 | 0.74 | 0.65–0.85 | 7.4 × 10⁻⁶ | 6.7 × 10⁻⁴ |
| 16p13.3 | rs11076805 | 0.90 | 0.76–1.06 | 0.21 | 0.93 | 0.87–0.99 | 3.2 × 10⁻² | 0.92 | 0.88–0.95 | 4.5 × 10⁻⁵ | 0.71 |
| 18q12.1 | rs36194942 | 0.97 | 0.84–1.13 | 0.73 | 0.93 | 0.88–0.99 | 2.2 × 10⁻² | 0.96 | 0.92–0.99 | 2.3 × 10⁻² | 0.98 |
| 19p13.2 | rs322144 | 0.94 | 0.81–1.08 | 0.38 | 0.95 | 0.90–1.01 | 0.11 | 0.96 | 0.93–1.00 | 6.4 × 10⁻² | 0.48 |
| 19q12 | rs113701136 | 1.02 | 0.89–1.18 | 0.77 | 1.06 | 1.01–1.13 | 3.0 × 10⁻² | 1.10 | 1.06–1.14 | 2.5 × 10⁻⁷ | 0.12 |
| Previously reported loci (associations replicated by the present study) | |||||||||||
| 1q32.1 | rs6678914 | 0.95 | 0.83–1.09 | 0.46 | 0.90 | 0.85–0.95 | 9.3 × 10⁻⁵ | 0.92 | 0.89–0.95 | 1.2 × 10⁻⁶ | 0.75 |
| 1q32.1 | rs4245739 | 1.02 | 0.88–1.19 | 0.75 | 1.05 | 0.99–1.12 | 8.7 × 10⁻² | 1.1) | 1.14–1.22 | 2.5 × 10⁻¹⁸ | 4.3 × 10⁻⁵ |
| 2p24.1 | rs12710696 | 1.08 | 0.94–1.23 | 0.28 | 1.10 | 1.04–1.16 | 9.6 × 10⁻⁴ | 1.04 | 1.01–1.08 | 1.6 × 10⁻² | 0.28 |
| 2p23.2 | rs4577244 | 1.02 | 0.88–1.20 | 0.77 | 0.95 | 0.89–1.01 | 9.4 × 10⁻² | 0.90 | 0.86–0.93 | 1.2 × 10⁻⁷ | 4.0 × 10⁻² |
| 5p15.33 | rs10069690 | 0.96 | 0.83–1.12 | 0.64 | 1.07 | 1.01–1.14 | 2.2 × 10⁻² | 1.21 | 1.17–1.26 | 1.5 × 10⁻²⁴ | 7.3 × 10⁻⁴ |
| 6q25.1 | rs3757322 | 1.16 | 1.01–1.34 | 0.04 | 1.13 | 1.07–1.20 | 7.5 × 10⁻⁶ | 1.18 | 1.14–1.22 | 4.5 × 10⁻²⁰ | 0.16 |
| 6q25.2 | rs2747652 | 0.86 | 0.75–0.98 | 0.02 | 0.92 | 0.87–0.97 | 1.9 × 10⁻³ | 0.90 | 0.87–0.93 | 1.6 × 10⁻⁹ | 0.61 |
| 13q22.1 | rs6562760 | 0.98 | 0.84–1.15 | 0.82 | 0.92 | 0.87–0.98 | 1.4 × 10⁻² | 0.91 | 0.88–0.95 | 1.2 × 10⁻⁵ | 0.52 |
| 16q12.2 | rs11075995 | 1.16 | 1.00–1.35 4.7 × 10 | −2 | 1.09 | 1.02–1.15 | 7.5 × 10⁻³ | 1.08 | 1.04–1.13 | 5.2 × 10⁻²⁸ | 0.42 |
| 19p13.11 | rs67397200 | 1.01 | 0.87–1.16 | 0.91 | 1.08 | 1.02–1.14 | 9.8 × 10⁻³ | 1.22 | 1.18–1.26 | 5.3 × 10−37 | 1.3 × 10⁻³ |
Only Breast Cancer Association Consortium (BCAC) data are shown. BCAC data were combined from 492 grade 1, 3,243 grade 2 and 8,568 grade 3 cases and 82,347 controls. OR, odds ratio per copy of the minor allele; CI, confidence interval.
Analysis of ER-negative cases only, by tumor grade (trend test, 1 degree of freedom).
Elsewhere, we report 65 new susceptibility loci for overall breast cancer1. Three of these are located within 500 kb of the new susceptibility loci for ER-negative disease reported here (variants rs200648189 (2p23.3), rs6569648 (6q23.1) and rs17350191 (8q24.13)). We assessed associations with risk of ER-negative disease, and with risk of overall breast cancer for BRCA1 mutation carriers, for SNPs at the remaining 62 loci, as well as for the 96 previously reported breast cancer susceptibility variants that were not specific to ER-negative disease. Of these 158 SNPs, 105 were associated (P < 0.05) with risk of ER-negative breast cancer and 24 were associated with overall risk for BRCA1 mutation carriers (Supplementary Tables 9 and 10). Results for BRCA2 mutation carriers are presented in Supplementary Table 11.
Pathway analysis based on mapping each SNP to the nearest gene was performed using summary association statistics from the meta-analysis of BCAC and CIMBA data combined61–64 (Online Methods). This identified several pathways implicated in ER-negative disease (enrichment score (ES) ≥ 0.41; Supplementary Fig. 14 and Supplementary Tables 12 and 13), including a subset of pathways that were not enriched in susceptibility to ER-positive disease (ES < 0; Supplementary Table 14). One of the latter subsets was the adenylate cyclase (AC)-activating pathway (ES = 0.62; Supplementary Fig. 15). Two of the predicted target genes for the ten new susceptibility variants for ER-negative breast cancer, based on the eQTL analysis (Supplementary Table 5), ADCY3 (PTCGA = 6.7 × 10⁻³) and ADCY9 (PMETABRIC = 1.3 × 10⁻⁴), are part of this pathway, and their association signals were critical to the elevated enrichment scores observed (Supplementary Fig. 14). ADCY9 is stimulated by β2 adrenergic receptor (β2AR) signaling65 in ER-negative breast cancer66 and in turn drives AC–cAMP signaling, including, for example, mitogenic signaling through the β-arrestin–Src–ERK pathway67.
To further explore the functional properties of the genome that contribute to heritability of ER-negative breast cancer, we conducted a partitioned heritability analysis using linkage disequilibrium (LD) score regression68. Considering 52 ‘baseline’ genomic features, we observed the greatest enrichment for super-enhancers (2.5-fold, P = 2 × 10⁻⁷) and the H3K4me3 histone mark (2.4-fold, P = 0.0005), with 33% depletion (P = 0.0002) observed for repressed regions (Supplementary Table 15). No differences in enrichment for these features were observed between susceptibility to ER-negative and ER-positive breast cancer, but baseline genomic features are not specific to cell type68. The estimated correlation between ER-negative and ER-positive breast cancer based on ~1 million common genetic variants69,70 was 0.60 (standard error (SE) = 0.03), indicating that, although these two breast cancer subtypes have a shared genetic component, a substantial proportion of their genetic bases is distinct. The estimated correlation between ER-negative disease in the general population and overall breast cancer for BRCA1 mutation carriers was 0.72 (SE = 0.11).
In summary, in this study of women of European origin, we have identified ten new susceptibility variants for ER-negative breast cancer and replicated associations with ER-negative disease for ten SNPs identified by previous GWAS. Most of these variants were not associated or were more weakly associated with ER-positive disease, consistent with the findings from pathway and partitioned heritability analyses showing that ER-negative breast cancer has a partly distinct genetic etiology. We also observed consistent associations with ER-negative disease for a further 105 susceptibility SNPs for breast cancer overall. Together, these 125 variants explain ~14% of an assumed twofold increased risk of developing ER-negative disease for the first-degree female relatives of women affected with this subtype (the newly identified SNPs explain ~1.5%; Supplementary Table 16) and ~40% of the estimated familial risk that is attributable to all variants imputable from the OncoArray (Online Methods). We have also identified 9 new breast cancer susceptibility variants for BRCA1 mutation carriers and confirmed associations for a further 30 previously reported SNPs; these 39 variants explain ~8% of the variance in polygenic risk for carriers of these mutations (Supplementary Table 17). However, the lower number of risk-associated variants in disease with BRCA1 mutation may merely be a consequence of the smaller sample size, as the genetic correlation with ER-negative breast cancer is high. These findings may inform improved risk prediction, both for the general population and BRCA1 mutation carriers30,71,72. Further investigation is required for other populations of non-European origin. Fine-mapping and functional studies should lead to a better understanding of the biological basis of ER-negative breast cancer and may perhaps inform the design of more effective preventive interventions, early detection and treatments for this disease.
URLs
Database of Genotypes and Phenotypes (dbGaP), https://www.ncbi.nlm.nih.gov/gap; Breast Cancer Association Consortium (BCAC), http://bcac.ccge.medschl.cam.ac.uk/; Consortium of Investigators of Modifiers of BRCA1/2 (CIMBA), http://cimba.ccge.medschl.cam.ac.uk/; PCcalc software, http://ccge.medschl.cam.ac.uk/software/pccalc/; SNPTEST, https://mathgen.stats.ox.ac.uk/genetics_software/snptest/snptest.html; GeneSets, http://baderlab.org/GeneSets; GenGen package, http://gengen.openbioinformatics.org/en/latest/.
METHODS
Methods, including statements of data availability and any associated accession codes and references, are available in the online version of the paper.
ONLINE METHODS
Study subjects
Supplementary Table 1 summarizes the studies from BCAC that contributed data. The majority were case–control studies. Sixty-eight BCAC studies participated in the ER-negative breast cancer component of the OncoArray, contributing 9,655 cases and 45,494 controls. All studies provided core data on disease status and age at diagnosis/observation, and the majority provided information on clinicopathological and lifestyle factors, which has been curated and incorporated into the BCAC database (version 6). ER status for most (~70%) cases was obtained from clinical records. After removal of overlapping participants, genotype data were also available from eight GWAS9,12,16,37,38 (4,480 ER-negative cases and 12,632 controls) and 40 studies previously genotyped using the Illumina iCOGS custom array20 (7,333 ER-negative cases and 42,468 controls).
A total of 21,468 ER-negative cases were included in the combined analyses. Of these, 5,793 had tumors that were also negative for progesterone receptor (PR) and human epidermal growth factor receptor 2 (HER2) and were defined as triple negative. PR and HER2 status were also obtained predominantly from clinical records. A further 4,217 cases were positive for PR or HER2 and were considered non–triple negative. The remainder had unknown PR or HER2 status. All participating studies were approved by their appropriate ethics review boards, and all subjects provided informed consent.
Subjects included from CIMBA were women of European ancestry aged 18 years or older with a pathogenic variant for BRCA1. The majority of the participants were sampled through cancer genetics clinics. Multiple members of the same family were included in some instances. Fifty-eight studies from 24 countries contributed OncoArray genotype data. After quality control and removal of participants overlapping with the BCAC OncoArray study, data were available on 15,566 BRCA1 mutation carriers, of whom 7,784 were affected with breast cancer (Supplementary Table 2). We also obtained iCOGS genotype data on 3,342 BRCA1 mutation carriers (1,630 with breast cancer) from 54 studies through CIMBA. All mutation carriers provided written informed consent and participated under ethically approved protocols.
OncoArray SNP selection
Approximately 50% of the SNPs for the OncoArray were selected as a ‘GWAS backbone’ (Illumina HumanCore), which aimed to provide high coverage for the majority of common variants through imputation. The remaining allocation was selected from lists supplied by each of six disease-based consortia, together with a seventh list of SNPs of interest to multiple disease study groups. Approximately 72,000 SNPs were selected specifically for their relevance to breast cancer, on the basis of prior evidence of association with overall or subtype-specific disease, with breast density or with breast- tissue-specific gene expression. Lists were merged as described previously34.
Genotype calling and quality control
Details of the genotype calling and quality control for the iCOGS and GWAS are described elsewhere19,20,23,30, and those for OncoArray are described in the Supplementary Note.
Imputation
Genotypes for ~21 million SNPs were imputed for all samples using the October 2014 (Phase 3) release of the 1000 Genomes Project data as the reference panel and based on 800 haplotypes. The iCOGS, OncoArray and six of the GWAS data sets were imputed using a two-stage imputation approach, with SHAPEIT73 for phasing and IMPUTEv2 (ref. 74) for imputation. Imputation was performed in 5-Mb non-overlapping intervals. All subjects were split into subsets of ~10,000 samples, with subjects from the same study grouped in the subset. The Breast and Prostate Cancer Cohort Consortium (BPC3) and Breast Cancer Family Registry (BCFR) GWAS performed imputation separately using MACH and Minimac75,76. We imputed genotypes for all SNPs that were polymorphic (MAF > 0.1%) in either European or Asian samples. For the BCAC GWAS, data were included in the analysis for all SNPs with MAF >0.01 and imputation r2 >0.3. For iCOGS and OncoArray, we included data for all SNPs with imputation r2 >0.3 and MAF >0.005.
Statistical analyses of BCAC data
Per-allele odds ratios and standard errors were generated for the OncoArray and iCOGS data sets and for each GWAS, adjusting for principal components, using logistic regression. The OncoArray and iCOGS analyses were additionally adjusted for country and study, respectively. For the OncoArray data set, principal-components analysis was performed using data for 33,661 SNPs (which included the 2,318 markers of continental ancestry) with MAF ≥0.05 and maximum correlation of 0.1, using purpose-written software (PCcalc; see URLs) to allow standard calculations to be performed sufficiently rapidly on a very large data set. We used the first ten principal components, as the inclusion of additional components did not further reduce inflation of the test statistics. We used nine principal components for the iCOGS data set and up to ten principal components for the other GWAS, where this was found to reduce inflation.
Odds ratio estimates were derived using MACH for the BCFR GWAS, ProbABEL77 was used for the BPC3 GWAS, SNPTEST (see URLs) was used for the remaining GWAS and purpose-written software was applied for the iCOGS and OncoArray data sets. Odds ratio estimates and standard errors were combined by a fixed-effects inverse-variance-weighted meta-analysis using METAL39. This was first done across the eight GWAS, applying genomic control, as described previously20. It was then applied (without genomic control) to combine findings from the three BCAC genotyping initiatives (GWAS, iCOGS and OncoArray).
The independence of the signals from two variants at 11q22.3 was assessed by fitting the logistic regression models described above with both variants as covariates. This was done separately for iCOGS and OncoArray data, and results for each variant were combined by meta-analysis.
For selected SNPs, we estimated per-allele odds ratios by ER status using all available BCAC data for 82,263 cases with known ER status and 87,962 controls from the iCOGS and OncoArray studies. We also estimated per-allele odds ratios by triple-negative status (triple-negative versus other ER-negative subtypes) and tumor grade, using available BCAC data for ER-negative cases and corresponding controls. Tests for heterogeneity by subtype were derived by applying logistic regression to cases only. This was done separately for the iCOGS and OncoArray data sets, adjusting as before, and results were then combined in a fixed-effects meta-analysis. Multinomial regression was applied to cases only to test for a linear trend for tumor grade, with the model constrained so that the difference between grade 1 and grade 3 was double that for the difference between grade 2 and grade 3; this method was also used to test for a linear trend with age at diagnosis, with ordinal values 1, 2, 3 and 4 representing ages <40, 40–49, 50–59 and ≥60 years, respectively.
Statistical analyses of CIMBA data
Associations between genotype and breast cancer risk for BRCA1 mutation carriers were evaluated using a 1-degree-of-freedom per-allele trend test (Ptrend), based on modeling the retrospective likelihood of the observed genotypes conditional on breast cancer phenotypes36. This was done separately for iCOGS and OncoArray data. To allow for non-independence among related individuals, an adjusted test statistic was used that took into account correlation in genotypes3. All analyses were stratified by country of residence and, for countries where the strata were sufficiently large (United States and Canada), by Ashkenazi Jewish ancestry. The results from the iCOGS and OncoArray data sets were then pooled using fixed-effects meta-analysis. We repeated these analyses modeling ovarian cancer as a competing risk and observed no substantial difference in the results obtained.
The independence of the signals from two variants at 11q22.3 was assessed using OncoArray data only, fitting a Cox regression model with per-allele effects for both variants, adjusting for birth cohort, stratifying by country of residence, and using robust standard errors and clustered observations for relatives. This approach provides valid significance tests of association, although the resulting hazard ratio estimates can be biased35.
Meta-analysis of BCAC and CIMBA
A fixed-effects meta-analysis of the results from BCAC and CIMBA was conducted using an inverse-variance-weighted approach assuming fixed effects, as implemented in METAL39. The effect estimates used were the logarithm of the per-allele hazard ratio estimate for association with breast cancer risk for BRCA1 mutation carriers from CIMBA and the logarithm of the per-allele odds ratio estimate for association with risk of ER-negative breast cancer based on BCAC data, both of which were assumed to approximate the same relative risk. We assessed genomic inflation using common (MAF > 1%) GWAS backbone variants. As λ is influenced by sample size, we calculated λ1,000 so that the values were comparable with those from other studies.
All statistical tests conducted were two-sided.
Definition of known association signals
We identified all associations previously reported from genome-wide or candidate analyses at a significance level of P < 5 × 10⁻⁸ in overall breast cancer, in ER-negative or ER-positive breast cancer, for BRCA1 or BRCA2 mutation carriers, or in meta-analyses of these categories. We included only one SNP in any 500-kb interval unless joint analysis provided genome-wide significant evidence (conditional P < 5 × 10⁻⁸) of more than one independent signal. Where multiple studies reported associations in the same region, we considered the first reported association unless a later study identified a different variant in the same region that was more strongly associated with breast cancer risk. One hundred and seven previously reported association signals were identified, 11 of which were found through GWAS of ER-negative disease or of breast cancer for BRCA1 mutation carriers or were reported as being more strongly associated with ER-negative breast cancer. These are listed in Table 2. The other 96 previously reported association signals are listed in Supplementary Table 10.
Definition of new association signals
To search for new loci, we assessed all SNPs excluding those within 500 kb of a known association signal. This approach identified 206 SNPs in nine regions that were associated with disease risk at P < 5 × 10⁻⁸ in the meta-analysis of BCAC ER-negative breast cancer and breast cancer for CIMBA BRCA1 mutation carriers. The SNP with the lowest P value from this analysis was considered to be the lead SNP. No additional loci were detected from analysis of BCAC data only. Imputation quality, as assessed by the IMPUTE2 imputation r2 value in the OncoArray data set, was ≥0.89 for the ten lead SNPs reported (Supplementary Table 3).
Candidate causal SNPs
To define the set of potentially causal variants at each of the new susceptibility loci, we selected all variants with P values within two orders of magnitude of the P value for the most significant SNP at each of the ten new loci. This is approximately equivalent to selecting variants whose posterior probability of causality is within two orders of magnitude of that of the most significant SNP40,41. This approach was applied to identify potentially causal variants for the signal given by the more common lead SNP at 11q22.3 (rs11374964). A similar approach was applied for the rarer lead SNP at this locus (rs74911261), but this was based on P values from analyses adjusted for rs11374964.
Proportion of familial risk explained
The relative risk of ER-negative breast cancer for the first-degree female relative of a woman with ER-negative disease has not been estimated. We therefore assumed that the twofold increase in risk observed for overall disease also applied to ER-negative disease. To estimate the proportion of this risk explained by the 125 variants associated with ER-negative disease, we used MAF and odds ratio estimates from the OncoArray-based genotype data and applied the formula
where pi is the MAF for variant i, βi is the log(OR) estimate for variant i, τi is the standard error of βi and λ = 2 is the assumed overall familial relative risk.
The corresponding estimate for the familial relative risk due to all variants is the frailty-scale heritability, defined as
where γi is the true relative risk conferred by variant i, assuming a log-additive model. We first obtained the estimated heritability based on the full set of summary estimates using LD score regression68, which derives a heritability estimate on the observed scale. We then converted this to an estimate on the frailty scale using the formula
where P is the proportion of samples in the population that are cases.
Proportion of polygenic risk-modifying variance explained for BRCA1 mutation carriers
The proportion of the variance in polygenic frailty modifying risk for BRCA1 mutation carriers explained by the set of associated SNPs was estimated by
where ci is the squared estimated coefficient of variation in incidence associated with SNP i (ref. 78) and σ2 is the total polygenic variance, estimated from segregation data79.
In silico annotation of candidate causal variants
We combined multiple sources of in silico functional annotation from public databases to help identify potential functional SNPs and target genes, on the basis of previous observations that breast cancer susceptibility alleles are enriched in cis-regulatory elements and alter transcriptional activity28,80–82. The influence of candidate causal variants on transcription factor binding sites was determined using the ENCODE-Motifs resource43. To investigate functional elements enriched across the region encompassing the strongest candidate causal SNPs, we analyzed chromatin biofeatures data from the Encyclopedia of DNA Elements (ENCODE) Project42 and the Roadmap Epigenomics Project44 together with other data obtained through the NCBI Gene Expression Omnibus (GEO), namely chromatin state segmentation by hidden Markov models (chrom-HMM), DHSs, and histone modifications for the epigenetic marks H3K4, H3K9 and H3K27 in HMECs, myoepithelial cells, and T47D and MCF7 breast cancer cells and transcription factor ChIP–seq in a range of breast cell lines (Supplementary Table 6). To identify the SNPs most likely to be functional, we used RegulomeDB45; to identify putative target genes, we examined potential functional chromatin interactions between distal and proximal regulatory transcription factor binding sites and promoters in the risk regions, using Hi-C data generated in HMECs47 and ChIA-PET data generated in MCF7 cells. This approach detects genome-wide interactions brought about by or associated with CCCTC-binding factor (CTCF), RNA polymerase II (Pol II) and ER, all of which are involved in transcriptional regulation47. Annotation of putative cis-regulatory regions and predicted target genes used the integrated method for predicting enhancer targets (IM-PET)46, the predicting specific tissue interactions of genes and enhancers (PreSTIGE) algorithm48, Hnisz51 and FANTOM49. Intersections between candidate causal variants and regulatory elements were identified using Galaxy, BedTools v2.24 and HaploReg v4.1 and were visualized in the UCSC Genome Browser. Publically available eQTL databases, including Gene-Tissue Expression (GTEx50; version 6, multiple tissues) and Westra52 (blood), were queried for candidate causal variants.
eQTL analyses
eQTL analyses were performed using data from the TCGA and METABRIC projects59,60.
The TCGA eQTL analysis was based on 79 ER-negative breast tumors that had matched gene expression, copy number and methylation profiles together with corresponding germline genotypes available. All 79 individuals were of European ancestry, as ascertained using the genotype data and the local ancestry in admixed populations (LAMP) software package (LAMP estimate cutoff > 95% European)83. Germline genotypes were imputed into the 1000 Genomes Project reference panel (October 2014 release) using IMPUTE2 (refs. 75,84). Gene expression had been measured on the Illumina HiSeq 2000 RNA-seq platform (gene-level RSEM normalized counts85), copy number estimates were derived from the Affymetrix SNP 6.0 array (somatic copy number alteration minus germline copy number variation called using the GISTIC2 algorithm86) and methylation β values were measured on the Illumina Infinium HumanMethylation450 array, as previously described59. Primary TCGA eQTL analysis focused on all potentially causal variants in the ten new regions associated with breast cancer risk in the meta-analysis of ER-negative cases and controls from BCAC and BRCA1 mutation carriers from CIMBA. We considered all genes located up to 1 Mb away on either side of each of these variants. The effects of tumor copy number and methylation on gene expression were first removed using a method described previously58, and eQTL analysis was performed by linear regression as implemented in the R package Matrix eQTL87.
The METABRIC eQTL analysis was based on 135 normal breast tissue samples resected from patients with breast cancer of European ancestry. Germline genotyping for the METABRIC study was also performed on the Affymetrix SNP 6.0 array, and ancestry estimation and imputation for this data set were conducted as described for TCGA. Gene expression in the METABRIC study had been measured using the Illumina HT12 microarray platform, and we used probe-level estimates. As for TCGA, we considered all genes in ten regions using Matrix eQTL.
We also performed additional eQTL analyses using the METABRIC data set for all variants within 1 Mb of L3MBTL3 and CDH2 and expression of these specific genes.
Global genomic enrichment analyses
We performed stratified LD score regression analyses68 for ER-negative breast cancer using the summary statistics based on meta-analyses of the OncoArray, GWAS, iCOGS and CIMBA data sets. We used all SNPs in the 1000 Genomes Project Phase 1 v3 release that had MAF >1% and imputation quality score R2 >0.3 in the OncoArray data. LD scores were calculated using the 1000 Genomes Project Phase 1 v3 EUR panel. Further details are provided in the Supplementary Note.
We tested the differences in functional enrichment between ER-positive and ER-negative subsets for individual features through a Wald test, using the regression coefficients and standard errors for the two subsets based on the models described above. Finally, we assessed the heritability due to genotyped and imputed SNPs70 and estimated the genetic correlation between ER-positive and ER-negative breast cancer69. The genetic correlation analysis was restricted to the ~1 million SNPs included in HapMap 3.
Pathway enrichment analyses
The pathway gene set database Human_GOBP_AllPathways_no_GO_iea_January_19_2016_symbol.gmt (GeneSets; see URLs)61 was used for all analyses. Pathway size was determined by the total number of genes in the pathway to which SNPs in the imputed GWAS data set could be mapped. To provide more biologically meaningful results and reduce false positives, only pathways that contained between 10 and 200 genes were considered.
SNPs were mapped to the nearest gene within 500 kb; SNPs that were further than 500 kb away from any gene were excluded. Gene significance was calculated by assigning the lowest P value observed across all SNPs mapped to a gene63,64, on the basis of the meta-analysis of BCAC and CIMBA data described above.
The gene set enrichment analysis (GSEA)61 algorithm, as implemented in the GenGen package (see URLs)62,63, was used to perform pathway analysis. Briefly, the algorithm calculates an enrichment score (ES) for each pathway based on a weighted Kolmogorov–Smirnov statistic62. Pathways that have most of their genes at the top of the ranked list of genes obtain higher ES values.
We defined an ES threshold (ES ≥ 0.41) to yield a true positive rate (TPR) of 0.20 and a false positive rate (FPR) of 0.14, with true positive pathways defined as those observed with false discovery rate (FDR) < 0.05 in a prior analysis carried out using the analytic approach defined above applied to iCOGS data for ER-negative disease.
To visualize the pathway enrichment analysis results, an enrichment map was created using the Enrichment Map (EM) v 2.1.0 app61 in Cytoscape v3.30 (ref. 88), applying an edge-weighted force-directed layout. To measure the contribution of each gene to enriched pathways and annotate the map, we reran the pathway enrichment analysis multiple times, each time excluding one gene. A gene was considered to drive the enrichment if the ES dropped to zero or less (pathway enrichment driver) after it was excluded. Pathways were grouped in the map if they shared >70% of their genes or their enrichment was driven by a shared gene.
See the Supplementary Note for further details.
Data availability
A subset of the data that support the findings of this study is publically available via dbGaP (see URLs; accessions phs001265.v1.p1 for BCAC data and phs001321.v1.p1 for CIMBA data). Requests for data can be made to the corresponding author or the Data Access Coordination Committees (DACCs) of BCAC (see URLs) and CIMBA (see URLs). BCAC DACC approval is required to access data from the ABCFS, ABCS, ABCTB, BBCC, BBCS, BCEES, BCFR-NY, BCFR-PA, BCFR-UT, BCINIS, BSUCH, CBCS, CECILE, CGPS, CTS, DIETCOMPLYF, ESTHER, GC-HBOC, GENICA, GEPARSIXTO, GESBC, HABCS, HCSC, HEBCS, HMBCS, HUBCS, KARBAC, KBCP, LMBC, MABCS, MARIE, MBCSG, MCBCS, MISS, MMHS, MTLGEBCS, NC-BCFR, OFBCR, ORIGO, pKARMA, POSH, PREFACE, RBCS, SKKDKFZS, SUCCESSB, SUCCESSC, SZBCS, TNBCC, UCIBCS, UKBGS and UKOPS studies (Supplementary Table 1). CIMBA DACC approval is required to access data from the BCFR-ON, CONSIT TEAM, DKFZ, EMBRACE, FPGMX, GC-HBOC, GEMO, G-FAST, HEBCS, HEBON, IHCC, INHERIT, IOVHBOCS, IPOBCS, MCGILL, MODSQUAD, NAROD, OCGN, OUH and UKGRFOCR studies (Supplementary Table 2).
Supplementary Material
Acknowledgments
We thank all the individuals who took part in these studies and all the researchers, clinicians, technicians and administrative staff who have enabled this work to be carried out.
Genotyping for the OncoArray was funded by the government of Canada through Genome Canada and the Canadian Institutes of Health Research (GPH-129344), the Ministère de l’Économie, de la Science et de l’Innovation du Québec through Génome Québec, the Quebec Breast Cancer Foundation for the PERSPECTIVE project, the US National Institutes of Health (NIH) (1 U19 CA 148065 for the Discovery, Biology and Risk of Inherited Variants in Breast Cancer (DRIVE) project and X01HG007492 to the Center for Inherited Disease Research (CIDR) under contract HHSN268201200008I), Cancer Research UK (C1287/A16563), the Odense University Hospital Research Foundation (Denmark), the National R&D Program for Cancer Control–Ministry of Health and Welfare (Republic of Korea) (1420190), the Italian Association for Cancer Research (AIRC; IG16933), the Breast Cancer Research Foundation, the National Health and Medical Research Council (Australia) and German Cancer Aid (110837).
Genotyping for the iCOGS array was funded by the European Union (HEALTH-F2-2009-223175), Cancer Research UK (C1287/A10710, C1287/A10118 and C12292/A11174]), NIH grants (CA128978, CA116167 and CA176785) and the Post-Cancer GWAS initiative (1U19 CA148537, 1U19 CA148065 and 1U19 CA148112 (GAME-ON initiative)), an NCI Specialized Program of Research Excellence (SPORE) in Breast Cancer (CA116201), the Canadian Institutes of Health Research (CIHR) for the CIHR Team in Familial Risks of Breast Cancer, the Ministère de l’Économie, Innovation et Exportation du Québec (PSR-SIIRI-701), the Komen Foundation for the Cure, the Breast Cancer Research Foundation and the Ovarian Cancer Research Fund.
Combination of the GWAS data was supported in part by the NIH Cancer Post-Cancer GWAS initiative (1 U19 CA 148065) (DRIVE, part of the GAME-ON initiative). LD score regression analysis was supported by grant CA194393. BCAC is funded by Cancer Research UK (C1287/A16563) and by the European Union via its Seventh Framework Programme (HEALTH-F2-2009-223175, COGS) and the Horizon 2020 Research and Innovation Programme (633784, B-CAST; 634935, BRIDGES). CIMBA is funded by Cancer Research UK (C12292/A20861 and C12292/A11174).
Footnotes
Note: Any Supplementary Information and Source Data files are available in the online version of the paper.
For a full description of funding and acknowledgments, see the Supplementary Note.
AUTHOR CONTRIBUTIONS
Writing group: R.L.M., K.B.K., K. Michailidou, J. Beesley, S. Kar, S. Lindström, S. Hui, G.D.B., P.D.P.P., F.J.C., D.F.E., P.K., G.C.-T., M.G.-C., M.K.S., A.C.A., J. Simard. Conception and coordination of OncoArray synthesis: D.F.E., A.C.A., J. Simard, C.I.A., J. Byun, S.J.C., E.D., D.J.H., A. Lee, P.D.P.P., J.T., Z.W. OncoArray genotyping: M.A., A.C.A., S.E.B., M.K.B., F.B., G.C.-T., J.M.C., K.F.D., D.F.E., N. Hammell, B. Hicks, K.J., C. Luccarini, L.M., J.M., E.P., J. Romm, M.K.S., X.S., J. Simard, P. Soucy, D.C.T., D.V., J. Vollenweider, L.X., B.Z. OncoArray genotype calling and quality control: X.C., J.D., E.D., D.F.E., K.B.K., J. Lecarpentier, A. Lee, M. Lush. Database management: D. Barrowdale, M.K.B., M.L., L.M., Q.W., R. Keeman, M.K.S. Statistical analysis: K.B.K., K. Michailidou, S. Hui, S. Kar, X.J., A. Rostamianfar, H. Finucane, S. Lindström, D. Barnes, P.K., P.D.P.P., G.D.B., R.L.M., A.C.A., D.F.E. Bioinformatic analysis: J. Beesley, P. Soucy, A. Lemaçon, D. Barnes, F.A.-E., A.D., J. Simard, G.C.-T. Provision of DNA samples and/or phenotypic data: ABCTB Investigators, C.M.A., J. Adlard, S. Agata, S. Ahmed, H.A., J. Allen, K.A., C.B.A., I.L.A., H.A.-C., N.N.A., A.C.A., V.A., N.A., K.J.A., B.A., P.L.A., M.G.E.M.A., J. Azzollini, J. Balmaña, M. Barile, L. Barjhoux, R.B.B., M. Barrdahl, D. Barnes, D. Barrowdale, C. Baynes, M.W.B., J. Beesley, J. Benitez, M. Bermisheva, L. Bernstein, Y.-J.B., K.R.B., M.J.B., C. Blomqvist, W.B., K.B., B. Boeckx, N.V.B., A. Bojesen, S.E.B., M.K.B., B. Bonanni, A. Bozsik, A.R.B., J.S.B., H. Brauch, H. Brenner, B.B.-d.P., C. Brewer, L. Brinton, P.B., A.B.-W., J. Brunet, T.B., B. Burwinkel, S.S.B., A.-L.B.-D., Q.C., T. Caldés, M.A.C., I. Campbell, F.C., O.C., A. Carracedo, B.D.C., J.E.C., L.C., V.C.-M., S.B.C., J.C.-C., S.J.C., X.C., G.C.-T., T.-Y.D.C., J. Chiquette, H.C., K.B.M.C., C.L.C., NBSS Collaborators, T. Conner, D.M.C., J. Cook, E.C.-D., S.C., F.J.C., I. Coupier, D.G.C., A. Cox, S.S.C., K. Cuk, K. Czene, M.B.D., F.D., H.D., R.D., J.D., P.D., O.D., Y.C.D., N.D., S.M.D., C.M.D., S.D., P.-A.D., M. Dumont, A.M.D., L.D., M. Dwek, B.D., T.D., EMBRACE, D.F.E., D.E., R.E., H. Ehrencrona, U.E., B.E., A.B.E., A.H.E., C.E., M.E., L. Fachal, L. Faivre, P.A.F., U.F., J.F., D.F.-J., O.F., H. Flyger, W.D.F., E.F., L. Fritschi, D.F., GEMO Study Collaborators, M. Gabrielson, P. Gaddam, M.D.G., M.G.-D., P.A.G., S.M.G., J. Garber, V.G.-B., M.G.-C., J.A.G.-S., M.M.G., M.G.-V., A. Gehrig, V.G., A.-M.G., G.G.G., G.G., A.K.G., M.S.G., D.E.G., A.G.-N., P. Goodfellow, M.H.G., G.I.G.A., M. Grip, J. Gronwald, A. Grundy, D.G.-K., Q.G., P. Guénel, HEBON, L.H., E. Hahnen, C.A.H., P. Hall, E. Hallberg, U.H., S. Hankinson, T.V.O.H., P. Harrington, S.N.H., J.M.H., C.S.H., A. Hein, S. Helbig, A. Henderson, J.H., P. Hillemanns, S. Hodgson, F.B.H., A. Hollestelle, M.J.H., B. Hoover, J.L.H., C.H., G.H., P.J.H., K.H., D.J.H., N. Håkansson, E.N.I., C.I., M.I., L.I., A.J., P.J., R.J., W.J., U.B.J., E.M.J., N.J., M.J., A.J.-V., R. Kaaks, M. Kabisch, K. Kaczmarek, D.K., K. Kast, R. Keeman, M.J.K., C.M.K., M. Keupers, S. Khan, E.K., J.I.K., J.A.K., I.K., V.-M.K., S.-W.K., P.K., V.N.K., T.A.K., K.B.K., A.K., Y.L., F. Lalloo, K.L., D.L., C. Lasset, C. Lazaro, L.l.M., J. Lecarpentier, M. Lee, A. Lee, E.L., J. Lee, F. Lejbkowicz, F. Lesueur, J. Li, J. Lilyquist, A. Lincoln, A. Lindblom, S. Lindström, J. Lissowska, W.-Y.L., S. Loibl, J. Long, J.T.L., J. Lubinski, C. Luccarini, M. Lush, A.-V.L., R.J.M., T.M., E.M., K.E.M., I.M.K., A. Mannermaa, S. Manoukian, J.E.M., S. Margolin, J.W.M.M., M.E.M., K. Matsuo, D.M., S. Mazoyer, L.M., C. McLean, H.M.-H., A. Meindl, P.M., H.M., K. Michailidou, A. Miller, N.M., R.L.M., G.M., M.M., K. Muir, A.M.M., C. Mulot, S.N., K.L.N., S.L.N., H.N., I.N., D.N., S.F.N., B.G.N., A.N., R.L.N., K. Offit, E.O., O.I.O., J.E.O., H.O., C.O., K. Ong, J.C.O., N.O., A.O., L.O., V.S.P., L.P., S.K.P., T.-W.P.-S., Y.P.-K., R.L., I.S.P., B. Peissel, A.P., J.I.A.P., P.P., J.P., G.P., P.D.P.P., C.M.P., M.P., D.P.-K., B. Poppe, M.E.P., R.P., N.P., D.P., M.A.P., K.P., B.R., P.R., N.R., J. Rantala, C.R.-F., H.S.R., G.R., V.R., K.R., A. Richardson, G.C.R., A. Romero, M.A.R., A. Rudolph, T.R., E.S., J. Sanders, D.P.S., S. Sangrajrang, E.J.S., D.F.S., M.K.S., R.K.S., M.J. Schoemaker, F.S., L. Schwentner, P. Schürmann, C. Scott, R.J.S., S. Seal, L. Senter, C. Seynaeve, M.S., P. Sharma, C.-Y.S., H. Shimelis, M.J. Shrubsole, X.-O.S., L.E.S., J. Simard, C.F.S., C. Sohn, P. Soucy, M.C.S., J.J.S., A.B.S., C. Stegmaier, J. Stone, D.S.-L., G.S., H. Surowy, C. Sutter, A.S., C.I.S., R.M.T., Y.Y.T., J.A.T., M.R.T., M.-I.T., L. Tong, M. Tengström, S.H.T., M.B.T., A.T., M. Thomassen, D.L.T., K. Thöne, M.G.T., L. Tihomirova, M. Tischkowitz, A.E.T., R.A.E.M.T., I.T., D.T., M. Tranchant, T.T., K. Tucker, N.T., H.-U.U., C.V., D.v.d.B., L.V., R.V.-M., A. Vega, A. Viel, J. Vijai, L.W., Q.W., S.W.-G., B.W., C.R.W., J.N.W., C.W., J.W., A.S.W., J.T.W., W.W., R.W., A.W., A.H.W., X.R.Y., D.Y., D.Z., W.Z., A.Z., E.Z., K.K.Z., I.d.-S.-S., kConFab AOCS Investigators, C.J.v.A., E.v.R., A.M.W.v.d.O. All authors read and approved the final version of the manuscript.
COMPETING FINANCIAL INTERESTS
The authors declare no competing financial interests.
References
- 1.Michailidou K, et al. Association analysis identifies 65 new breast cancer risk loci. Nature. doi: 10.1038/nature24284. (in press) [DOI] [PMC free article] [PubMed] [Google Scholar]
- 2.Ahmed S, et al. Newly discovered breast cancer susceptibility loci on 3p24 and 17q23.2. Nat Genet. 2009;41:585–590. doi: 10.1038/ng.354. [DOI] [PMC free article] [PubMed] [Google Scholar]
- 3.Antoniou AC, et al. A locus on 19p13 modifies risk of breast cancer in BRCA1 mutation carriers and is associated with hormone receptor–negative breast cancer in the general population. Nat Genet. 2010;42:885–892. doi: 10.1038/ng.669. [DOI] [PMC free article] [PubMed] [Google Scholar]
- 4.Cai Q, et al. Genome-wide association study identifies breast cancer risk variant at 10q21.2: results from the Asia Breast Cancer Consortium. Hum Mol Genet. 2011;20:4991–4999. doi: 10.1093/hmg/ddr405. [DOI] [PMC free article] [PubMed] [Google Scholar]
- 5.Cox A, et al. A common coding variant in CASP8 is associated with breast cancer risk. Nat Genet. 2007;39:352–358. doi: 10.1038/ng1981. [DOI] [PubMed] [Google Scholar]
- 6.Easton DF, et al. Genome-wide association study identifies novel breast cancer susceptibility loci. Nature. 2007;447:1087–1093. doi: 10.1038/nature05887. [DOI] [PMC free article] [PubMed] [Google Scholar]
- 7.Fletcher O, et al. Novel breast cancer susceptibility locus at 9q31.2: results of a genome-wide association study. J Natl Cancer Inst. 2011;103:425–435. doi: 10.1093/jnci/djq563. [DOI] [PubMed] [Google Scholar]
- 8.Ghoussaini M, et al. Genome-wide association analysis identifies three new breast cancer susceptibility loci. Nat Genet. 2012;44:312–318. doi: 10.1038/ng.1049. [DOI] [PMC free article] [PubMed] [Google Scholar]
- 9.Haiman CA, et al. A common variant at the TERT–CLPTM1L locus is associated with estrogen receptor–negative breast cancer. Nat Genet. 2011;43:1210–1214. doi: 10.1038/ng.985. [DOI] [PMC free article] [PubMed] [Google Scholar]
- 10.Hein R, et al. Comparison of 6q25 breast cancer hits from Asian and European genome wide association studies in the Breast Cancer Association Consortium (BCAC) PLoS One. 2012;7:e42380. doi: 10.1371/journal.pone.0042380. [DOI] [PMC free article] [PubMed] [Google Scholar]
- 11.Hunter DJ, et al. A genome-wide association study identifies alleles in FGFR2 associated with risk of sporadic postmenopausal breast cancer. Nat Genet. 2007;39:870–874. doi: 10.1038/ng2075. [DOI] [PMC free article] [PubMed] [Google Scholar]
- 12.Siddiq A, et al. A meta-analysis of genome-wide association studies of breast cancer identifies two novel susceptibility loci at 6q14 and 20q11. Hum Mol Genet. 2012;21:5373–5384. doi: 10.1093/hmg/dds381. [DOI] [PMC free article] [PubMed] [Google Scholar]
- 13.Stacey SN, et al. Common variants on chromosomes 2q35 and 16q12 confer susceptibility to estrogen receptor–positive breast cancer. Nat Genet. 2007;39:865–869. doi: 10.1038/ng2064. [DOI] [PubMed] [Google Scholar]
- 14.Stacey SN, et al. Common variants on chromosome 5p12 confer susceptibility to estrogen receptor–positive breast cancer. Nat Genet. 2008;40:703–706. doi: 10.1038/ng.131. [DOI] [PubMed] [Google Scholar]
- 15.Thomas G, et al. A multistage genome-wide association study in breast cancer identifies two new risk alleles at 1p11.2 and 14q24.1 (RAD51L1) Nat Genet. 2009;41:579–584. doi: 10.1038/ng.353. [DOI] [PMC free article] [PubMed] [Google Scholar]
- 16.Turnbull C, et al. Genome-wide association study identifies five new breast cancer susceptibility loci. Nat Genet. 2010;42:504–507. doi: 10.1038/ng.586. [DOI] [PMC free article] [PubMed] [Google Scholar]
- 17.Zheng W, et al. Genome-wide association study identifies a new breast cancer susceptibility locus at 6q25.1. Nat Genet. 2009;41:324–328. doi: 10.1038/ng.318. [DOI] [PMC free article] [PubMed] [Google Scholar]
- 18.Bojesen SE, et al. Multiple independent variants at the TERT locus are associated with telomere length and risks of breast and ovarian cancer. Nat Genet. 2013;45:371–384. e1–e2. doi: 10.1038/ng.2566. [DOI] [PMC free article] [PubMed] [Google Scholar]
- 19.Garcia-Closas M, et al. Genome-wide association studies identify four ER negative– specific breast cancer risk loci. Nat Genet. 2013;45:392–398. e1–e2. doi: 10.1038/ng.2561. [DOI] [PMC free article] [PubMed] [Google Scholar]
- 20.Michailidou K, et al. Large-scale genotyping identifies 41 new loci associated with breast cancer risk. Nat Genet. 2013;45:353–361. e1–e2. doi: 10.1038/ng.2563. [DOI] [PMC free article] [PubMed] [Google Scholar]
- 21.Cai Q, et al. Genome-wide association analysis in East Asians identifies breast cancer susceptibility loci at 1q32.1, 5q14.3 and 15q26.1. Nat Genet. 2014;46:886–890. doi: 10.1038/ng.3041. [DOI] [PMC free article] [PubMed] [Google Scholar]
- 22.Long J, et al. Genome-wide association study in east Asians identifies novel susceptibility loci for breast cancer. PLoS Genet. 2012;8:e1002532. doi: 10.1371/journal.pgen.1002532. [DOI] [PMC free article] [PubMed] [Google Scholar]
- 23.Michailidou K, et al. Genome-wide association analysis of more than 120,000 individuals identifies 15 new susceptibility loci for breast cancer. Nat Genet. 2015;47:373–380. doi: 10.1038/ng.3242. [DOI] [PMC free article] [PubMed] [Google Scholar]
- 24.Milne RL, et al. Common non-synonymous SNPs associated with breast cancer susceptibility: findings from the Breast Cancer Association Consortium. Hum Mol Genet. 2014;23:6096–6111. doi: 10.1093/hmg/ddu311. [DOI] [PMC free article] [PubMed] [Google Scholar]
- 25.Gaudet MM, et al. Identification of a BRCA2-specific modifier locus at 6p24 related to breast cancer risk. PLoS Genet. 2013;9:e1003173. doi: 10.1371/journal.pgen.1003173. [DOI] [PMC free article] [PubMed] [Google Scholar]
- 26.Meyer KB, et al. Fine-scale mapping of the FGFR2 breast cancer risk locus: putative functional variants differentially bind FOXA1 and E2F1. Am J Hum Genet. 2013;93:1046–1060. doi: 10.1016/j.ajhg.2013.10.026. [DOI] [PMC free article] [PubMed] [Google Scholar]
- 27.Orr N, et al. Fine-mapping identifies two additional breast cancer susceptibility loci at 9q31.2. Hum Mol Genet. 2015;24:2966–2984. doi: 10.1093/hmg/ddv035. [DOI] [PMC free article] [PubMed] [Google Scholar]
- 28.French JD, et al. Functional variants at the 11q13 risk locus for breast cancer regulate cyclin D1 expression through long-range enhancers. Am J Hum Genet. 2013;92:489–503. doi: 10.1016/j.ajhg.2013.01.002. [DOI] [PMC free article] [PubMed] [Google Scholar]
- 29.Dunning AM, et al. Breast cancer risk variants at 6q25 display different phenotype associations and regulate ESR1, RMND1 and CCDC170. Nat Genet. 2016;48:374–386. doi: 10.1038/ng.3521. [DOI] [PMC free article] [PubMed] [Google Scholar]
- 30.Couch FJ, et al. Identification of four novel susceptibility loci for oestrogen receptor negative breast cancer. Nat Commun. 2016;7:11375. doi: 10.1038/ncomms11375. [DOI] [PMC free article] [PubMed] [Google Scholar]
- 31.Lawrenson K, et al. Functional mechanisms underlying pleiotropic risk alleles at the 19p13.1 breast–ovarian cancer susceptibility locus. Nat Commun. 2016;7:12675. doi: 10.1038/ncomms12675. [DOI] [PMC free article] [PubMed] [Google Scholar]
- 32.Wyszynski A, et al. An intergenic risk locus containing an enhancer deletion in 2q35 modulates breast cancer risk by deregulating IGFBP5 expression. Hum Mol Genet. 2016;25:3863–3876. doi: 10.1093/hmg/ddw223. [DOI] [PMC free article] [PubMed] [Google Scholar]
- 33.Mavaddat N, et al. Pathology of breast and ovarian cancers among BRCA1 and BRCA2 mutation carriers: results from the Consortium of Investigators of Modifiers of BRCA1/2 (CIMBA) Cancer Epidemiol Biomarkers Prev. 2012;21:134–147. doi: 10.1158/1055-9965.EPI-11-0775. [DOI] [PMC free article] [PubMed] [Google Scholar]
- 34.Amos CI, et al. The OncoArray Consortium: a network for understanding the genetic architecture of common cancers. Cancer Epidemiol Biomarkers Prev. 2017;26:126–135. doi: 10.1158/1055-9965.EPI-16-0106. [DOI] [PMC free article] [PubMed] [Google Scholar]
- 35.Antoniou AC, et al. A weighted cohort approach for analysing factors modifying disease risks in carriers of high-risk susceptibility genes. Genet Epidemiol. 2005;29:1–11. doi: 10.1002/gepi.20074. [DOI] [PubMed] [Google Scholar]
- 36.Barnes DR, Lee A, Easton DF, Antoniou AC. Evaluation of association methods for analysing modifiers of disease risk in carriers of high-risk mutations. Genet Epidemiol. 2012;36:274–291. doi: 10.1002/gepi.21620. [DOI] [PubMed] [Google Scholar]
- 37.Ahsan H, et al. A genome-wide association study of early-onset breast cancer identifies PFKM as a novel breast cancer gene and supports a common genetic spectrum for breast cancer at any age. Cancer Epidemiol Biomarkers Prev. 2014;23:658–669. doi: 10.1158/1055-9965.EPI-13-0340. [DOI] [PMC free article] [PubMed] [Google Scholar]
- 38.Stevens KN, et al. 19p13.1 is a triple-negative-specific breast cancer susceptibility locus. Cancer Res. 2012;72:1795–1803. doi: 10.1158/0008-5472.CAN-11-3364. [DOI] [PMC free article] [PubMed] [Google Scholar]
- 39.Willer CJ, Li Y, Abecasis GR. METAL: fast and efficient meta-analysis of genomewide association scans. Bioinformatics. 2010;26:2190–2191. doi: 10.1093/bioinformatics/btq340. [DOI] [PMC free article] [PubMed] [Google Scholar]
- 40.Maller JB, et al. Bayesian refinement of association signals for 14 loci in 3 common diseases. Nat Genet. 2012;44:1294–1301. doi: 10.1038/ng.2435. [DOI] [PMC free article] [PubMed] [Google Scholar]
- 41.Udler MS, Tyrer J, Easton DF. Evaluating the power to discriminate between highly correlated SNPs in genetic association studies. Genet Epidemiol. 2010;34:463–468. doi: 10.1002/gepi.20504. [DOI] [PubMed] [Google Scholar]
- 42.ENCODE Project Consortium. A user’s guide to the Encyclopedia of DNA Elements (ENCODE) PLoS Biol. 2011;9:e1001046. doi: 10.1371/journal.pbio.1001046. [DOI] [PMC free article] [PubMed] [Google Scholar]
- 43.Kheradpour P, Kellis M. Systematic discovery and characterization of regulatory motifs in ENCODE TF binding experiments. Nucleic Acids Res. 2014;42:2976–2987. doi: 10.1093/nar/gkt1249. [DOI] [PMC free article] [PubMed] [Google Scholar]
- 44.Kundaje A, et al. Integrative analysis of 111 reference human epigenomes. Nature. 2015;518:317–330. doi: 10.1038/nature14248. [DOI] [PMC free article] [PubMed] [Google Scholar]
- 45.Boyle AP, et al. Annotation of functional variation in personal genomes using RegulomeDB. Genome Res. 2012;22:1790–1797. doi: 10.1101/gr.137323.112. [DOI] [PMC free article] [PubMed] [Google Scholar]
- 46.He B, Chen C, Teng L, Tan K. Global view of enhancer–promoter interactome in human cells. Proc Natl Acad Sci USA. 2014;111:E2191–E2199. doi: 10.1073/pnas.1320308111. [DOI] [PMC free article] [PubMed] [Google Scholar]
- 47.Rao SS, et al. A 3D map of the human genome at kilobase resolution reveals principles of chromatin looping. Cell. 2014;159:1665–1680. doi: 10.1016/j.cell.2014.11.021. [DOI] [PMC free article] [PubMed] [Google Scholar]
- 48.Corradin O, et al. Combinatorial effects of multiple enhancer variants in linkage disequilibrium dictate levels of gene expression to confer susceptibility to common traits. Genome Res. 2014;24:1–13. doi: 10.1101/gr.164079.113. [DOI] [PMC free article] [PubMed] [Google Scholar]
- 49.Forrest AR, et al. A promoter-level mammalian expression atlas. Nature. 2014;507:462–470. doi: 10.1038/nature13182. [DOI] [PMC free article] [PubMed] [Google Scholar]
- 50.GTEx Consortium. The Genotype-Tissue Expression (GTEx) pilot analysis: multitissue gene regulation in humans. Science. 2015;348:648–660. doi: 10.1126/science.1262110. [DOI] [PMC free article] [PubMed] [Google Scholar]
- 51.Hnisz D, et al. Super-enhancers in the control of cell identity and disease. Cell. 2013;155:934–947. doi: 10.1016/j.cell.2013.09.053. [DOI] [PMC free article] [PubMed] [Google Scholar]
- 52.Westra HJ, et al. Systematic identification of trans eQTLs as putative drivers of known disease associations. Nat Genet. 2013;45:1238–1243. doi: 10.1038/ng.2756. [DOI] [PMC free article] [PubMed] [Google Scholar]
- 53.James LI, et al. Small-molecule ligands of methyl-lysine binding proteins: optimization of selectivity for L3MBTL3. J Med Chem. 2013;56:7358–7371. doi: 10.1021/jm400919p. [DOI] [PMC free article] [PubMed] [Google Scholar]
- 54.Sukari A, Muqbil I, Mohammad RM, Philip PA, Azmi AS. F-BOX proteins in cancer cachexia and muscle wasting: emerging regulators and therapeutic opportunities. Semin Cancer Biol. 2016;36:95–104. doi: 10.1016/j.semcancer.2016.01.002. [DOI] [PMC free article] [PubMed] [Google Scholar]
- 55.Ling Zheng L, et al. Interaction of heat shock protein Cpn10 with the cyclin E/Cdk2 substrate nuclear protein ataxia-telangiectasia (NPAT) is involved in regulating histone transcription. J Biol Chem. 2015;290:29290–29300. doi: 10.1074/jbc.M115.659201. [DOI] [PMC free article] [PubMed] [Google Scholar]
- 56.Easton DF, et al. Gene-panel sequencing and the prediction of breast-cancer risk. N Engl J Med. 2015;372:2243–2257. doi: 10.1056/NEJMsr1501341. [DOI] [PMC free article] [PubMed] [Google Scholar]
- 57.Rogers S, et al. Cyclin E2 is the predominant E-cyclin associated with NPAT in breast cancer cells. Cell Div. 2015;10:1. doi: 10.1186/s13008-015-0007-9. [DOI] [PMC free article] [PubMed] [Google Scholar]
- 58.Li Q, et al. Integrative eQTL-based analyses reveal the biology of breast cancer risk loci. Cell. 2013;152:633–641. doi: 10.1016/j.cell.2012.12.034. [DOI] [PMC free article] [PubMed] [Google Scholar]
- 59.Cancer Genome Atlas Network. Comprehensive molecular portraits of human breast tumours. Nature. 2012;490:61–70. doi: 10.1038/nature11412. [DOI] [PMC free article] [PubMed] [Google Scholar]
- 60.Curtis C, et al. The genomic and transcriptomic architecture of 2,000 breast tumours reveals novel subgroups. Nature. 2012;486:346–352. doi: 10.1038/nature10983. [DOI] [PMC free article] [PubMed] [Google Scholar]
- 61.Merico D, Isserlin R, Stueker O, Emili A, Bader GD. Enrichment map: a network-based method for gene-set enrichment visualization and interpretation. PLoS One. 2010;5:e13984. doi: 10.1371/journal.pone.0013984. [DOI] [PMC free article] [PubMed] [Google Scholar]
- 62.Wang K, Li M, Bucan M. Pathway-based approaches for analysis of genomewide association studies. Am J Hum Genet. 2007;81:1278–1283. doi: 10.1086/522374. [DOI] [PMC free article] [PubMed] [Google Scholar]
- 63.Wang K, Li M, Hakonarson H. Analysing biological pathways in genome-wide association studies. Nat Rev Genet. 2010;11:843–854. doi: 10.1038/nrg2884. [DOI] [PubMed] [Google Scholar]
- 64.Wang L, Jia P, Wolfinger RD, Chen X, Zhao Z. Gene set analysis of genome-wide association studies: methodological issues and perspectives. Genomics. 2011;98:1–8. doi: 10.1016/j.ygeno.2011.04.006. [DOI] [PMC free article] [PubMed] [Google Scholar]
- 65.Hacker BM, et al. Cloning, chromosomal mapping, and regulatory properties of the human type 9 adenylyl cyclase (ADCY9) Genomics. 1998;50:97–104. doi: 10.1006/geno.1998.5293. [DOI] [PubMed] [Google Scholar]
- 66.Melhem-Bertrandt A, et al. β-blocker use is associated with improved relapse-free survival in patients with triple-negative breast cancer. J Clin Oncol. 2011;29:2645–2652. doi: 10.1200/JCO.2010.33.4441. [DOI] [PMC free article] [PubMed] [Google Scholar]
- 67.Pon CK, Lane JR, Sloan EK, Halls ML. The β2-adrenoceptor activates a positive cAMP–calcium feedforward loop to drive breast cancer cell invasion. FASEB J. 2016;30:1144–1154. doi: 10.1096/fj.15-277798. [DOI] [PMC free article] [PubMed] [Google Scholar]
- 68.Finucane HK, et al. Partitioning heritability by functional annotation using genome-wide association summary statistics. Nat Genet. 2015;47:1228–1235. doi: 10.1038/ng.3404. [DOI] [PMC free article] [PubMed] [Google Scholar]
- 69.Bulik-Sullivan B, et al. An atlas of genetic correlations across human diseases and traits. Nat Genet. 2015;47:1236–1241. doi: 10.1038/ng.3406. [DOI] [PMC free article] [PubMed] [Google Scholar]
- 70.Bulik-Sullivan BK, et al. LD Score regression distinguishes confounding from polygenicity in genome-wide association studies. Nat Genet. 2015;47:291–295. doi: 10.1038/ng.3211. [DOI] [PMC free article] [PubMed] [Google Scholar]
- 71.Milne RL, Antoniou AC. Genetic modifiers of cancer risk for BRCA1 and BRCA2 mutation carriers. Ann Oncol. 2011;22(Suppl. 1):i11–i17. doi: 10.1093/annonc/mdq660. [DOI] [PubMed] [Google Scholar]
- 72.Mavaddat N, et al. Prediction of breast cancer risk based on profiling with common genetic variants. J Natl Cancer Inst. 2015;107:djv036. doi: 10.1093/jnci/djv036. [DOI] [PMC free article] [PubMed] [Google Scholar]
- 73.Delaneau O, Marchini J, Zagury JF. A linear complexity phasing method for thousands of genomes. Nat Methods. 2011;9:179–181. doi: 10.1038/nmeth.1785. [DOI] [PubMed] [Google Scholar]
- 74.Howie BN, Donnelly P, Marchini J. A flexible and accurate genotype imputation method for the next generation of genome-wide association studies. PLoS Genet. 2009;5:e1000529. doi: 10.1371/journal.pgen.1000529. [DOI] [PMC free article] [PubMed] [Google Scholar]
- 75.Howie B, Fuchsberger C, Stephens M, Marchini J, Abecasis GR. Fast and accurate genotype imputation in genome-wide association studies through pre-phasing. Nat Genet. 2012;44:955–959. doi: 10.1038/ng.2354. [DOI] [PMC free article] [PubMed] [Google Scholar]
- 76.Li Y, Willer CJ, Ding J, Scheet P, Abecasis GR. MaCH: using sequence and genotype data to estimate haplotypes and unobserved genotypes. Genet Epidemiol. 2010;34:816–834. doi: 10.1002/gepi.20533. [DOI] [PMC free article] [PubMed] [Google Scholar]
- 77.Aulchenko YS, Struchalin MV, van Duijn CM. ProbABEL package for genome-wide association analysis of imputed data. BMC Bioinformatics. 2010;11:134. doi: 10.1186/1471-2105-11-134. [DOI] [PMC free article] [PubMed] [Google Scholar]
- 78.Antoniou AC, Easton DF. Polygenic inheritance of breast cancer: implications for design of association studies. Genet Epidemiol. 2003;25:190–202. doi: 10.1002/gepi.10261. [DOI] [PubMed] [Google Scholar]
- 79.Antoniou AC, et al. The BOADICEA model of genetic susceptibility to breast and ovarian cancers: updates and extensions. Cancer Br J. 2008;98:1457–1466. doi: 10.1038/sj.bjc.6604305. [DOI] [PMC free article] [PubMed] [Google Scholar]
- 80.Darabi H, et al. Polymorphisms in a putative enhancer at the 10q21.2 breast cancer risk locus regulate NRBF2 expression. Am J Hum Genet. 2015;97:22–34. doi: 10.1016/j.ajhg.2015.05.002. [DOI] [PMC free article] [PubMed] [Google Scholar]
- 81.Glubb DM, et al. Fine-scale mapping of the 5q11.2 breast cancer locus reveals at least three independent risk variants regulating MAP3K1. Am J Hum Genet. 2015;96:5–20. doi: 10.1016/j.ajhg.2014.11.009. [DOI] [PMC free article] [PubMed] [Google Scholar]
- 82.Ghoussaini M, et al. Evidence that breast cancer risk at the 2q35 locus is mediated through IGFBP5 regulation. Nat Commun. 2014;4:4999. doi: 10.1038/ncomms5999. [DOI] [PMC free article] [PubMed] [Google Scholar]
- 83.Baran Y, et al. Fast and accurate inference of local ancestry in Latino populations. Bioinformatics. 2012;28:1359–1367. doi: 10.1093/bioinformatics/bts144. [DOI] [PMC free article] [PubMed] [Google Scholar]
- 84.Abecasis GR, et al. An integrated map of genetic variation from 1,092 human genomes. Nature. 2012;491:56–65. doi: 10.1038/nature11632. [DOI] [PMC free article] [PubMed] [Google Scholar]
- 85.Li B, Dewey CN. RSEM: accurate transcript quantification from RNA-Seq data with or without a reference genome. BMC Bioinformatics. 2011;12:323. doi: 10.1186/1471-2105-12-323. [DOI] [PMC free article] [PubMed] [Google Scholar]
- 86.Mermel CH, et al. GISTIC2.0 facilitates sensitive and confident localization of the targets of focal somatic copy-number alteration in human cancers. Genome Biol. 2011;12:R41. doi: 10.1186/gb-2011-12-4-r41. [DOI] [PMC free article] [PubMed] [Google Scholar]
- 87.Shabalin AA. Matrix eQTL: ultra fast eQTL analysis via large matrix operations. Bioinformatics. 2012;28:1353–1358. doi: 10.1093/bioinformatics/bts163. [DOI] [PMC free article] [PubMed] [Google Scholar]
- 88.Shannon P, et al. Cytoscape: a software environment for integrated models of biomolecular interaction networks. Genome Res. 2003;13:2498–2504. doi: 10.1101/gr.1239303. [DOI] [PMC free article] [PubMed] [Google Scholar]
Associated Data
This section collects any data citations, data availability statements, or supplementary materials included in this article.
Supplementary Materials
Data Availability Statement
A subset of the data that support the findings of this study is publically available via dbGaP (see URLs; accessions phs001265.v1.p1 for BCAC data and phs001321.v1.p1 for CIMBA data). Requests for data can be made to the corresponding author or the Data Access Coordination Committees (DACCs) of BCAC (see URLs) and CIMBA (see URLs). BCAC DACC approval is required to access data from the ABCFS, ABCS, ABCTB, BBCC, BBCS, BCEES, BCFR-NY, BCFR-PA, BCFR-UT, BCINIS, BSUCH, CBCS, CECILE, CGPS, CTS, DIETCOMPLYF, ESTHER, GC-HBOC, GENICA, GEPARSIXTO, GESBC, HABCS, HCSC, HEBCS, HMBCS, HUBCS, KARBAC, KBCP, LMBC, MABCS, MARIE, MBCSG, MCBCS, MISS, MMHS, MTLGEBCS, NC-BCFR, OFBCR, ORIGO, pKARMA, POSH, PREFACE, RBCS, SKKDKFZS, SUCCESSB, SUCCESSC, SZBCS, TNBCC, UCIBCS, UKBGS and UKOPS studies (Supplementary Table 1). CIMBA DACC approval is required to access data from the BCFR-ON, CONSIT TEAM, DKFZ, EMBRACE, FPGMX, GC-HBOC, GEMO, G-FAST, HEBCS, HEBON, IHCC, INHERIT, IOVHBOCS, IPOBCS, MCGILL, MODSQUAD, NAROD, OCGN, OUH and UKGRFOCR studies (Supplementary Table 2).