

Abstract
Tauopathies, including Alzheimer's disease (AD), are associated with the aggregation of modified microtubule associated protein tau. This pathological state of tau is often referred to as “hyperphosphorylated”. Due to limitations in technology, an accurate quantitative description of this state is lacking. Here, a mass spectrometry-based assay, FLEXITau, is presented to measure phosphorylation stoichiometry and provide an unbiased quantitative view of the tau post-translational modification (PTM) landscape. The power of this assay is demonstrated by measuring the state of hyperphosphorylation from tau in a cellular model for AD pathology, mapping, and calculating site occupancies for over 20 phosphorylations. We further employ FLEXITau to define the tau PTM landscape present in AD post-mortem brain. As shown in this study, the application of this assay provides mechanistic understanding of tau pathology that could lead to novel therapeutics, and we envision its further use in prognostic and diagnostic approaches for tauopathies.
Graphical abstract
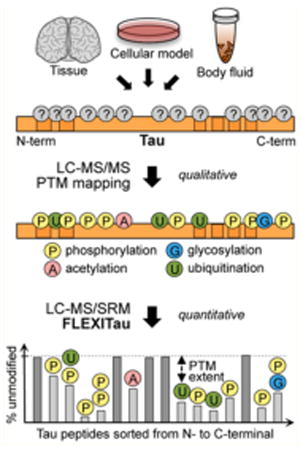
Tau is a microtubule (MT)-associated protein that is predominantly expressed in neurons, where it mostly localizes to axonal regions. Major functions of tau include MT stabilization, maintenance of axonal transport, and regulation of neurite outgrowth.6,7 Perturbation of tau regulation can lead to the formation of intraneuronal insoluble aggregates of abnormally phosphorylated tau, in the form of paired helical filaments (PHFs). Tau aggregates are the pathological hallmark of a number of neurodegenerative disorders that are collectively called tauopathies, the most common being Alzheimer's disease (AD), a so-called “secondary tauopathy”. Phosphorylation on multiple sites is considered to be a major early event in the formation of tau inclusions.8,9 part from phosphorylation, several other post-translational modifications (PTMs) have been implicated in disease pathogenesis, including acetylation,3,10 ubiquitination,1,11 methylation,5 and glycosylation,12,13 among others.
The characterization of tau PTMs and their exact relationship to tau pathology has been a major goal in the field of neurodegeneration, as understanding the nature of tau biochemistry will identify molecular targets for therapeutics or diagnostic approaches; however a comprehensive picture is missing. The study of tau PTMs is extremely challenging due to the large number of modified sites and by the coexistence of multiple types of modifications, sometimes competing for the same sites.5,16,17 To untangle the PTM landscape, many possible sites have to be analyzed in a qualitative as well as quantitative level. In the case of phosphorylation, to date over 70 sites (out of the 85 putative sites) have been described.2,18 While 28 phosphorylation sites have been exclusively found in tau from AD brain, many others overlap between AD and normal adult brain, but are phosphorylated to a different extent, in most cases higher in AD compared to control. In this context, the term “hyperphosphorylation” has been used widely in the literature, often when a positive signal is obtained from specific antibodies. One prominent example is the AT8 antibody, which binds to phosphorylated residues serine (S) and threonine (T) S202/T205. However, the term hyper-phosphorylation is ambiguous, as in most cases phosphorylation stoichiometry is not measured. Moreover, information about the total number of phosphorylations or other modifications, as well as their occupancy, is lacking. Thus, the complexity of the tau PTM landscape poses a major analytical challenge.
Immunochemistry approaches are the traditional methods used to analyze tau PTMs and a large array of tau antibodies specific to phosphorylated or otherwise modified epitopes are available, such as the above-mentioned AT8. While these antibodies are useful in the study of tau pathology, rigorous quantification using antibodies is difficult because of variable affinity specificity and selectivity.19–21 Further complicating quantification using antibodies is the lack of reference standards that need to be generated for every possible PTM/epitope. Finally, a priori knowledge of particular PTMs is required, and for some sites, no antibodies exist while for other sites antibodies cannot be raised. These limitations severely constrain the potential of antibody-based methods as tools to study tau PTMs in a comprehensive and quantitative manner.
Emerging MS-based proteomics approaches are powerful alternative methods used to identify proteins and characterize modifications. In the case of tau, exploitation of this technology resulted in greatly enhanced protein sequence coverage. Many MS-based tau PTM studies led to the discovery of thus far undescribed tau modifications as well as novel phosphorylation sites and allowed for the simultaneous analysis of dozens of modification sites.1,2,5,22–24 Although they enabled the parallel analysis of different types of modification, these studies generally characterized only a limited number of PTM types, with the strongest emphasis on phosphorylation and little focus on less common PTMs. Furthermore, the majority of these MS-based experiments employed data-dependent acquisition (DDA), a data collection mode that relies on the “detectability” of the peptide species of interest, biasing the analysis toward peptides of highest intensity. This particularly handicaps the identification of PTMs, as the modified species can be present in very low stoichiometries and/or exhibit decreased flyability compared to the unmodified counterpart.
To address a critical need for an analytical method to measure tau PTMs, we developed the FLEXITau (Full-Length Expressed stable Isotope-labeled Tau) strategy.25 This assay allows for the unbiased analysis of tau modifications in a highly quantitative fashion, where the addition of a stable isotope-labeled tau standard to the biological sample is key to the quantification. To maximize reproducibility and sensitivity, we expanded on the original workflow by implementing a selected reaction monitoring (SRM) acquisition method and developed a sensitive, robust, tau-specific assay. The assay was then used to study human tau expressed in Sf9 insect cells, a cellular model system that generates tau in a highly phosphorylated, AD-like state.26,27 The precise phosphorylation state of Sf9-tau was measured, mapping and quantifying 23 phosphorylations in a site-specific manner. To demonstrate the versatility of the assay, we then applied our workflow to tau aggregates derived from post-mortem AD brain tissue. We found that the performance of the assay is not compromised by the complexity of the human sample or the heterogeneity of the modifications on tau. Due to its sensitivity and versatility, FLEXITau is a powerful, robust tool for investigating tau modifications both in vitro and in vivo. The application of this method will greatly enhance our understanding of tau modifications and their role in pathogenesis. Thus, FLEXITau provides a foundation for the development of better diagnostic tools and tau-modulating therapeutic strategies.
Experimental Procedures
All details to experimental procedures are included in the Supporting Information (SI).
Results and Discussion
Development of the Quantitative SRM FLEXITau Assay
The overall goal of this study was to develop an SRM workflow to quantify tau modifications in an unbiased manner. Our approach utilizes a stable isotope-labeled (“heavy”) full-length tau protein standard that is added to biological specimens prior to sample processing and MS analysis (Figure 1A). The premise of FLEXITau is to measure the change in the unmodified peptide species rather than measuring the modified species.25 For example, if 66.7% of a particular site carries a specific modification, then the abundance of the unmodified species is decreased to 33.3%.
Figure 1.
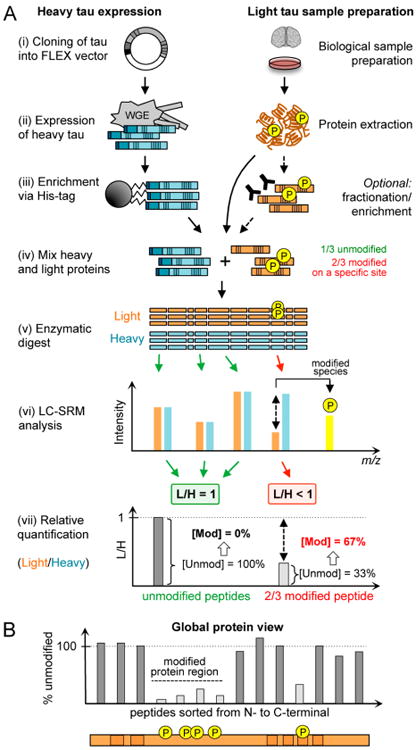
FLEXITau experimental workflow. (A) In a typical FLEXITau experiment the heavy tau standard is generated in the presence of heavily labeled amino acids and added to an unlabeled endogenous sample in a ratio of approximately 1:1. After enzymatic digest and LC-MS analysis all unmodified tau peptides will be observed as pairs, featuring the light and heavy isotopologues. For modified peptides, the modification causes a mass shift, reducing the amount of detectable unmodified peptide and causing a deviation of the mixing ratio. The extent of modification on that peptide can be inferred by the amount of “missing” unmodified species. (B) Plotting of peptide L/H ratios sorted from protein N- to C-terminus allows for a global visualization of modified peptides and protein regions. Blue, heavy tau; dark orange, light tau; P, phosphorylation.
In a FLEXITau experiment, the tau standard is purified and added to the unlabeled endogenous (“light”) sample, which is digested using trypsin or other enzymes (Figure 1A). Due to the mixing of light and heavy species early in the sample processing, we minimize quantification errors that might arise due to sample loss and technical variability between samples during preparation. Notably, variability in various batches of extraction/purification prior to mixing may lead to differences in absolute amounts of the light and heavy proteins; however this does not affect the relative quantification by FLEXITau which happens on the peptide level. The digested peptide mixture, containing light and heavy tau peptide species, is then analyzed by MS. All observed tau peptides are present as pairs, featuring the light and the heavy isotopologues. The initial mixing ratio is calculated by determining the light-to-heavy (L/H) ratio of unmodified peptides. As mentioned above, if a peptide from the sample is modified, this modification results in a reduction in the amount of unmodified peptide; thus, any deviation of the L/H ratio indicates modification. The extent of modification of a peptide is calculated by measuring the difference in L/H ratio of the unmodified peptide species and the mixing ratio. Plotting the FLEXITau data for all tau peptides sorted from N- to C-terminal results in an intuitive representation of the PTM landscape across the entire protein. This plot indicates where individual modifications occur and which domains of a protein are highly modified (Figure 1B).
The quality of the FLEXITau data strongly depends on the sensitive and reproducible MS-based detection of the unmodified peptide species. To ensure this, we devised a targeted assay specifically tailored to monitor the unmodified tau, using SRM. SRM is increasingly being used in protein quantification because of its outstanding specificity, reproducibility, and sensitivity.28–32 To maximize the sequence coverage of tau, we developed SRM assays for tau digested by either trypsin or LysC (SI Table S1). When analyzing purified trypsin-digested standard using the developed SRM assay, we reproducibly achieved a sequence coverage of 71% (23 peptides), and the five complementary LysC peptides increased this number to 75.3% (SI Figure S1B). The sensitivity of the SRM method can be maximized by acquisition of the transitions in a small retention time window (termed scheduled SRM). Therefore, we developed a scheduled 30 min LC-SRM method suitable for pure/low complex tau samples enabling tau modification profile quantification from pure/low complex tau samples in a sensitive and time efficient manner. Notably, for the analysis of highly complex samples, we suggest use of a longer gradient in order to maintain specificity and minimize interfering background signals. Both the tau peptides and the iRT standard peptides (Biognosys) implemented in the assay allow for quick and accurate peptide retention time calculation in other gradient lengths.33
Sensitivity of the FLEXITau Assay
To determine the detection limit of the assay and the dependence of the sequence coverage on concentration, a dilution series of digested heavy tau standard from 800 fmol to 8 amol in 11 dilution steps was analyzed. Samples were measured in triplicate using the developed scheduled SRM assay, and the signal intensities of the heavy peptides were monitored. We found that for maximal sequence coverage at least 2 fmol of tau must be injected (Figure 2A); any concentrations below 2 fmol resulted in a decrease in sequence coverage. At 80 amol, a sequence coverage of 51% (25 quantifiable peptides) was measured, and at the lowest end of the dilution series of 8 amol, the sequence coverage was 38.7% with 15 quantifiable peptides (Figure 2B). Figure 2C shows representative dilution curves for eight peptides. The average R2 value was 0.97 (SI Figure S2). For the concentration range of 0.4–400 fmol a R2 value of >0.98 was observed for approximately 90% of the targeted peptides.
Figure 2.
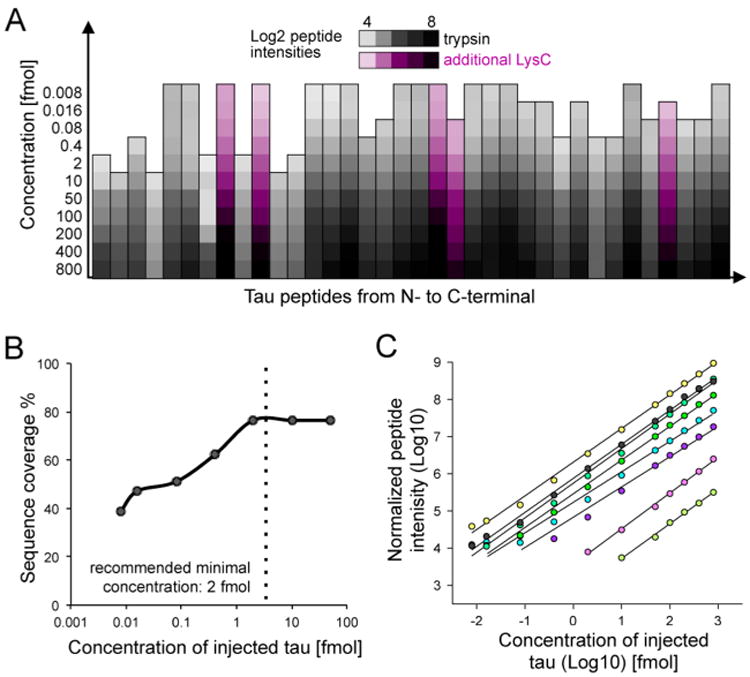
FLEXITau sequence coverage and detection limit. (A) A dilution series of tau was performed and peptide intensities were measured using the developed FLEXITau SRM assay. log 2 peptide abundances (mean value of triplicate measurements) are shown as a heat map for the quantified peptides, sorted from N- to C-terminus. (B) Achieved sequence coverage of tau relative to injection amount. Minimal concentration for maximum sequence coverage is indicated by dotted line. (C) Representative curves of eight peptides (mean value of triplicate measurements).
In summary, the sensitivity of the assay is highlighted by the successful quantification of peptides across 5 orders of magnitude, down to 8 amol of injected tau. To achieve maximum sequence coverage and linearity of quantification, a working range between 2 and 400 fmol of tau is required. It is worth noting that the optimal working range and reproducibility of the assay can be affected by interfering signals and should be reassessed in each individual sample background, particularly in highly complex samples.
Analytical Precision of the FLEXITau Assay
To evaluate precision of the assay, we took advantage of an in vitro tau expression system in which the modifications present are well-defined, i.e., human tau protein produced in insect Sf9 cells via baculovirus transfection.27,34,35 Tau expressed in these cells is phosphorylated at multiple sites and is thought to have a similar phosphorylation pattern as PHF tau from AD.35 This Sf9 cellular model system has been used to study tau aggregation26 and sequential phosphorylation by multiple kinases.36 This state of phosphorylated tau is often called hyperphosphorylated, and despite its ambiguity, we use this term throughout this work for the sake of simplicity.
We analyzed four different species: (i) tau from untreated Sf9 cells, phosphorylated at a native level (hereafter termed P-tau), (ii) tau from Sf9 cells treated with a phosphatase inhibitor (okadaic acid, OA), resulting in an increased level of phosphorylation (PP-tau), (iii) tau purified from Sf9 cells subsequently treated with alkaline phosphatase (AP) to remove the phosphorylations (deP-tau), and (iv) tau expressed in Escherichia coli (E. coli) as unmodified control (ctrl-tau) (Figure 3A). We subjected three independent preparations of each species to the FLEXITau workflow, and analyzed each sample 3 times. This analysis resulted in the quantification of 28 targeted peptides in all samples achieving a sequence coverage of 75% (SI Figure S1B).
Figure 3.
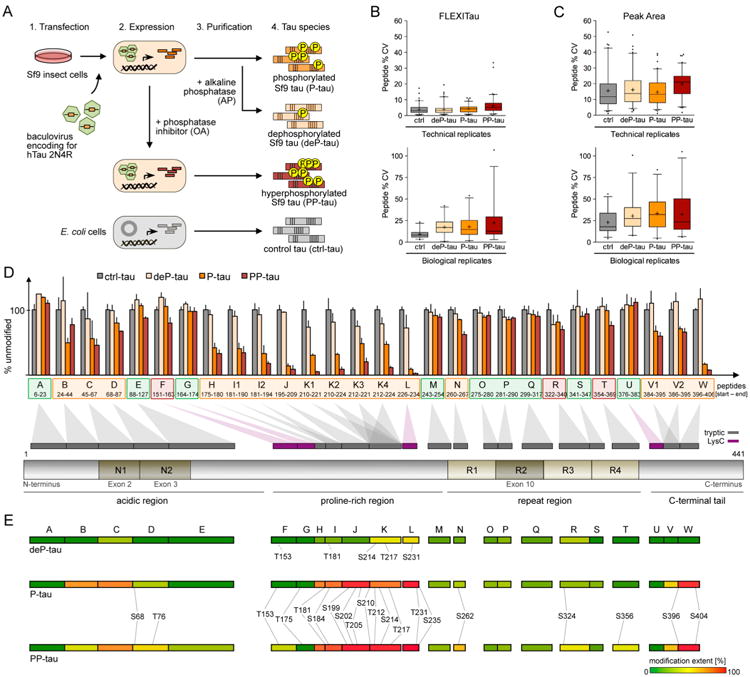
Quantification of “hyperphosphorylated” tau by FLEXITau (A) Sf9-tau sample preparation. Sf9 insect cells were transfected with recombinant baculovirus encoding for human 2N4R wild type tau. Purified Sf9-tau (P-tau) was treated with AP to generate dephosphorylated Sf9-tau (deP-tau). Phosphatase inhibition by OA prior to cell harvest and tau purification gives rise to hyperphosphorylated Sf9 (PP-tau). As control, unmodified tau was expressed in E. coli. (B) Three independent preparations of Sf9-tau were subjected to FLEXITau SRM analysis (three SRM measurements each). Technical reproducibility (top panel) and biological reproducibility (bottom panel) of L/H ratio was calculated as %CV. Data are represented in a boxplot (5–95% whiskers; mean indicated by +). (C) Peak areas were extracted from the same data set and the %CV calculated. Data are represented as boxplot (5–95% whiskers; mean indicated by +). (D) FLEXITau data are shown for each tau species (average of three independent Sf9-tau preparations; bar shows relative error (%CV)). Peptides sorted from N- to C-terminus are projected onto a schematic of 2N4R tau protein, respective to their amino acid location. Exons prone to splicing (exons 2, 3, and 10) are depicted in dark brown. Peptides not modified in P-tau and PP-tau are shown in green; peptides significantly different from ctrl-tau in orange, and peptides different in PP-tau only in red (student t-test, p < 0.05). (E) Phosphorylated sites identified by LC-MS/MS shotgun analysis were mapped onto tau peptides that are color coded according to their modification extent as quantified by the SRM analysis. For the full list of modified peptides see SI Table S2.
First we assessed the quantification precision of technical replicates (replicate injections) and biological replicates (different Sf9 cell batches). On average, the median coefficient of variation (CV) across replicate injections was 3.9% (Figure 3B). ctrl-tau presented the lowest (3%), and PP-tau the highest variability (5.2%). On average, the biological variability was higher than the technical variability, with a median %CV of 13.2% (3.5-fold compared to CV of technical replicates). Again, ctrl-tau presented the lowest variability (median %CV of 8.2%). In comparison to the technical variability, apart from the increase in median %CV we also observed a broadening of the CV distribution (SI Figure S3A,B).
Next, to evaluate if the use of an internal standard improves the quantitation reproducibility, we compared the FLEXITau results to quantification using only peak intensities of endogenous tau peptides. To this end, we extracted light peak areas for all monitored peptides in the same data set. Quantification using peak area intensity resulted in a 4-fold increase of technical variability (15.3%CV) and 2-fold increase in biological variability (25.3%CV) compared to the FLEXITau quantification of 3.9%CV and 13.2%CV, respectively (Figure 3C). This corroborates that the employment of the internal standard is highly beneficial to the precision of the analysis.
Quantitative PTM Profiling of “Hyperphosphorylated” Tau
Next, we assessed the peptide modification landscape in these Sf9-tau samples. Figure 3D shows the quantification of unmodified tau peptides in the global FLEXITau representation. Peptides were defined as “modified” if the average of the biological replicates resulted in a value below 100% and were significantly different from ctrl-tau (student t-test, p < 0.05). Table 1 lists all quantified peptides and their respective modification extent, including the significance value. On average (mean value of all modified peptides), the modification extent of PP-tau was 25% higher compared to P-tau (33.0% for P-tau, compared to 42.7% for PP-tau). Nine peptides (39% of the quantified sequence) appeared to be unmodified in both species, while the remaining 19 peptides (nearly half of the quantified sequence) were found to be modified in P-tau and/or PP-tau. From these, the vast majority was modified both in P-tau and PP-tau; only three peptides (peptides F, R, and T) were modified in PP-tau only, suggesting that phosphorylation sites in these regions are more accessible to phosphatases, which are inhibited by the okadaic acid (151IATPRGAAPPGQK163, 322CGSLGNIHHKPGGGQ-VEVK340, and 354IGSLDNITHVP-GGGNK369; Table 1, pep-tides highlighted in red).
Table 1. Peptides Quantified by FLEXITau Assay and Corresponding PTMsa.
| Region | ID | Location [AA] | FLEXITau peptide | Peptide modification extent [%] | PTM contributing to modification extent | |||||
|---|---|---|---|---|---|---|---|---|---|---|
| Start | End | P-tau | p-value | PP-tau | p-value | detected | hypothesized | |||
| acidic | A | 6 | 23 | QEFEVMEDHAGTYGLGDR | - | |||||
| B | 24 | 44 | KDQGGYTMHQDQEGDTDAGLK | 50.8 | * | 22.2 | * | - | Y29, T30, T39 | |
| C | 45 | 67 | ESPLQTPTEDGSEEPGSETSDAK | 44.7 | * | 54.0 | ** | S68 | S46, T50, T52, S56 | |
| D | 68 | 87 | STPTAEDVTAPLVDEGAPGK | 19.9 | * | 33.4 | ** |
|
||
| E | 88 | 126 | QAAAQPHTEIPEGTTAEEAGIGDTPSLEDEAAGHVTQAR | 12.9 | - | |||||
| proline-rich | F | 151 | 163 | IATPRGAAPPGQK | 4.2 | 20.1 | * | T153 | ||
| G | 164 | 174 | GQANATRIPAK | 2.1 | 3.0 | T175 | ||||
| H | 175 | 180 | TPPAPK | 58.4 | ** | 67.4 | ** | T175, T181 | ||
| 11 | 181 | 190 | TPPSSGEPPK | 59.1 | ** | 66.0 | ** | T181, S184 | ||
| 12 | 181 | 194 | TPPSSGEPPKSGDR | 66.4 | ** | 82.3 | *** | T181, S184 | S195 | |
| J | 195 | 209 | SGYSSPGSPGTPGSR | 86.1 | *** | 90.7 | ** | S199, S202, T205, S210 | S195 | |
| K1 | 210 | 221 | SRTPSLPTPPTR | 69.7 | ** | 94.8 | ** | S210, T212, S214.T217 | ||
| K2 | 210 | 224 | SRTPSLPTPPTREPK | 68.8 | * | 91.1 | ** | S210, T212, S214, T217 | ||
| K3 | 212 | 221 | TPSLPTPPTR | 52.2 | ** | 80.1 | *** | T212, S214, T217 | ||
| K4 | 212 | 224 | TPSLPTPPTREPK | 53.7 | ** | 88.0 | *** | T212, S214, T217 | ||
| L | 226 | 234 | VAWRTPPK | 90.6 | *** | 97.2 | *** | T231.S235 | ||
| binding repeats | M | 243 | 254 | LQTAPVPMPDLK | 9.2 | 12.0 | - | |||
| N | 260 | 267 | IGSTENLK | 15.7 | * | 38.6 | ** | S262 | ||
| 0 | 275 | 280 | VQIINK | 11.6 | 9.0 | - | ||||
| P | 281 | 290 | KLDLSNVQSK | 15.2 | 13.2 | - | ||||
| Q | 299 | 317 | HVPGGGSVQIVYKPVDLSK | 7.9 | 10.2 | - | ||||
| R | 322 | 340 | CGSLGNIHHKPGGGQVEVK | 12.4 | 31.0 | * | S324 | |||
| S | 341 | 347 | SEKLDFK | 10.2 | 6.4 | - | ||||
| T | 354 | 369 | IGSLDNITHVPGGGNK | 1.8 | 23.8 | * | S356 | |||
| C-terminal | U | 376 | 383 | LTFRENAK | - | |||||
| V1 | 384 | 395 | AKTDHGAEIVYK | 33.2 | * | 41.1 | * | S396 | ||
| V2 | 386 | 395 | TDHGAEIVYK | 29.4 | * | 34.2 | * | S396 | ||
| w | 396 | 406 | SPWSGDTSPR | 84.1 | *** | 92.4 | *** | S396, S404 | ||
Three independent preparations of Sf9-tau were subjected to FLEXITau SRM analysis (three SRM measurements each).
Average of normalized L/H ratio was calculated for each tau species. Peptide modification extent was determined by the difference of normalized L/H ratio to ctrl-tau, where 100% represents a peptide that is fully modified (no unmodified peptide detected). P-values were calculated in comparison to control tau (student t-test). Peptides detected are shown with their sequence ordered by their amino acid location in tau (N- to C-terminal). Corresponding phosphorylation sites detected by complementary LC-MS/MS analysis are shown (see also Figure 3C). Note that a modification site on the first amino acid after the cleavage site will contribute to the previous (N-terminal) peptide as well and will be listed twice (e.g., T175). Phosphorylations only detected in PP-tau is written in red font. Highlighted peptides: green, peptides not significantly different from control; orange, peptides different from control; red, peptides different from control in PP-tau only.
To gain a more functional view of the data, we grouped the peptides into their corresponding tau domains, from N- to C-terminal: acidic region, proline-rich region, repeat region, and C-terminal tail (Figure 3D, bottom). Our data indicated that each tau domain presented with a characteristic modification extent (and this trend was maintained upon treatment with phosphatase inhibitor). The repeat region was the least modified with an average modification extent of 10.1% and 14.8% for P-tau and PP-tau, respectively; most of the peptides in this region were unmodified (student t-test, p > 0.05; see above). The acidic region and C-terminal tail showed moderate modification extents (acidic region, 23.1% and 24.5%, and C-terminal tail, 48.9% and 55.9%, for P-tau and PP-tau, respectively). The proline-rich region depicted the highest modification extent (on average 55.2% and 71.0% for P-tau and PP-tau, respectively). Interestingly, this region contains residual phosphorylation in the dephosphorylated Sf9-tau species, deP-tau (consistent with previous reports26). The highest modification extent for deP-tau was observed on peptide K and L at 27% for both. This region also harbored the peptide with the highest modification extent of all peptides, with 90.6% in P-tau and 97.2% in PP-tau (peptide L, 226VAVVRTPPK234, Figure 3D and Table 1).
Creating a Quantitative PTM Map
The FLEXITau experiments measured the absolute extent of modification of tau peptides and relative differences between P-tau and PP-tau. Next we identified the modifications present on these peptides associated with the quantitative data. To this end, these samples were analyzed using DDA workflows and mapped the identified PTMs to their corresponding quantification data (Figure 3E and Table 1). At this point it is important to note that if an identified phosphorylation is located on the first amino acid after a tryptic cleavage site, this phosphorylation leads to a miscleavage producing a longer peptide. Thus, this modification will contribute to the reduction in the abundance of the modified peptide (containing the modified site) as well as its N-terminal neighboring peptide. In these cases, the respective site is listed twice in Table 1.
In total, we identified 21 phosphorylation sites on Sf9 P-tau—12 serine and 7 threonine phosphorylation sites; on PP-tau, 23 phosphorylation sites were identified, including all P-tau sites, with two additional phosphorylation sites being mapped at T76 and S356. Biological modifications other than phosphorylation, such as ubiquitination, acetylation, or glycosylation, were not identified in this analysis (nor has it been previously reported for Sf9-tau2). Consistent with the FLEXITau data, the proline-rich domain depicted the highest density of phosphorylation sites with 13 sites total, for both P-tau and PP-tau (this is also consistent with previous reports2). A comprehensive list of detected modified peptide species can be found in SI Table S2. Of the 16 peptides identified as significantly modified by FLEXITau (in both P-tau and PP-tau) 15 were associated with the presence of one or more phosphorylation sites. Only for peptide B (24KDQGGYTMQDQEGDTDAGLK44) no corresponding modification could be identified. In this case, FLEXITau analysis showed a significant modification extent in both P-tau and PP-tau (51%, p = 0.008, and 22%, p = 0.046, respectively), clearly indicating the presence of a modification. Putative phosphorylation sites on peptide B include Y29, T30, and T39 (Table 1).
FLEXITau showed three peptides to be exclusively modified in PP-tau but not on P-tau (Table 1, peptide sequences highlighted in red). In the DDA data, phosphorylation sites T153, S324, and S356 were identified on these peptides. Unexpectedly, T153 and S324 were not only detected in PP-tau but also on P-tau. However, the quantitative FLEXITau data showed that the extent of modification of these peptides in P-tau is minimal (4.2% and 12.4%, respectively; p-value across biological replicates nonsignificant).
The DDA data did not map any PTMs to peptides that were determined as “unmodified” by FLEXITau, corroborating the quantitative results. The only exception is the peptide 164GQA-NATRIPAK174, on which T175 was detected as being phosphorylated both in P-tau and PP-tau. However, the FLEXITau data determined that the modification stoichiometry is low (<3% for both species), which is below the precision of the assay (%CV = 3.9%; see above).
The quantitative precision of FLEXITau can point to additional PTMs that are not detected in DDA experiments as for peptide B above. In one special case (peptide C, 45ESPLQTPTEDGSEEPGSETSDAK67), we identified a matching modification as S68; however FLEXITau data suggested an additional PTM. S68 is located on the first amino acid after the cleavage site where this phosphorylation contributes to a reduction in the abundance of unmodified peptide C as well as the following peptide D (68STPTAEDVTAPLVDEGAPGK87), as described above. Peptide D carries an additional modification; thus we expect the abundance of unmodified peptide D to be lower than that of peptide C. However, the abundance of unmodified peptide D was higher than that of peptide C, reflected by the smaller modification extent (P-tau, −19.9%; PP-tau, −33.4%), compared to that of peptide C (P-tau, −44.7%; PP-tau, −54.0%). This led us to speculate that peptide C harbored an additional modification site that was not detected by the DDA experiment. In the literature, many studies of in vitro and in vivo phosphorylated tau, often employing enrichment strategies,1,5,22,23 have been performed. Remarkably, despite the vast amount of information (see also http://cnr.iop.kcl.ac.uk/hangerlab/tautable, an up-to-date list of all tau phosphorylation sites), in the N-terminal region only one site has been previously described in vivo.37,38 Putative phosphorylation sites in this region are T50, T52, and S56. Importantly, although PTMs other than phosphorylation can be found in the baculovirus infected insect expression system, neither others nor we have identified these.
In summary, while normal workflows such as DDA experiments cannot possibly map all modified sites at once,16 the quantitative unbiased view of the modification landscape provided by FLEXITau can point to additional areas of tau that might be modified, independent of the type of modification.
Calculation of Site Occupancy Using FLEXITau
In the above analysis, we obtained peptide abundance data for the unmodified peptides and mapped modification sites using this knowledge. For peptides harboring a single modification, the peptide modification extent directly reflects the occupancy of the modified site. Notably this only holds true under the premise that no modification other than the one detected is present on the respective peptide. In this data set, this situation applies to T175, S262, S324, S356, and S416/422. However, for many peptides we identified multiple phosphorylated sites, in particular in the proline-rich region, as well as in the C-terminal tail (Table 1 and Figure 3). In these cases, the direct correlation of peptide modification extent and site occupancy cannot be made. Each site may contribute to the overall peptide modification extent. Thus, for multiply modified peptides, the peptide modification extent is the sum of all individual site occupancies.
To determine the individual site occupancies for multiply phosphorylated peptides, a combinatorial strategy that uses information from “overlapping” peptides was employed (for a schematic, see Figure 4A). Overlapping peptides are produced by a missed tryptic cleavage—typically caused by closely located lysines and arginines (Figure 4A, peptides I1/I2, K1 – K4, and V1/V2). In these cases, when trypsin is used, the primary tryptic peptide has a miscleaved counterpart whose sequence encompasses the primary tryptic peptide species with an addition of the following amino acids until the next cleavage site. A missed cleavage can also occur if a phosphorylation is present on the amino acid in the first position after the cleavage site (peptides G/H, I2/J, J/K, and V2/W), as briefly mentioned earlier. In these cases, cleavage is impaired due to the presence of the phosphate group. Thus, the phosphate on the second peptide causes the reduction in the abundance of both unmodified peptides, N- and C-terminal to the cleavage site.
Figure 4.
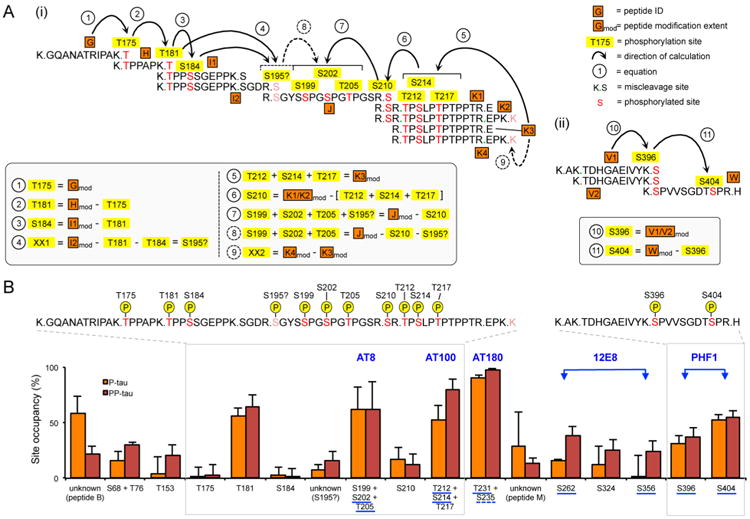
Calculation of site occupancies for singly and multiply modified peptides. (A) For peptides containing a single modification site, the site occupancy equals the peptide modification extent calculated by the FLEXITau assay (see Table 1). For multiply modified peptides, we designed a combinatorial approach to stepwise calculate individual site occupancies by using quantitative information from overlapping peptides: (i) the proline-rich region; eqs 1–9, with eq 1 starting from N-terminus and eq 5 starting from the C-terminus; (ii) C-terminal tail, eqs 10 and 11. (B) Phosphorylation extents for all identified sites are shown in percent (average ± std dev of three biological replicates, three measurements each). Sites are sorted by the amino acid location in the tau sequence N- to C-terminus. Commonly used diagnostic AD antibodies are shown in blue, with binding epitopes underlined; dotted line indicating controversy regarding antibody epitope. The gray boxes indicate the highly modified regions i and ii shown in A. P, phosphate groups.
Our strategy to calculate site occupancy of multiply phosphorylated peptides is to start with a single peptide with a single modification, whose site occupancy is therefore defined (Figure 4A). The stoichiometries of additional sites are then calculated stepwise by using the quantitative information on each subsequent overlapping peptide. For example, in the case of the proline-rich region, we started at the N-terminus of this region with peptide G. Its modification extent equals the occupancy of its single phosphorylation site on residue T175. The adjacent overlapping peptide (peptide H) contained two detected phosphorylations, T175 as well as T181. Here, the modification extent of T181 is the difference in modification extent of peptide G (T175) and peptide H (T181+T175), in this case 56.3% (P-tau) and 64.4% (PP-tau). This combinatorial strategy allowed us to successfully quantify the individual stoichiometry of sites T181, S184, S210, S396, and S404. In the case of peptide I (181TPPSSGEPPKSGDR195) we mapped two phosphorylation sites, T181 and S184 using DDA experiments. However, the total modification extent was higher than the sum of its quantified single components. Thus, we speculate that the remaining value (7.3% and 16.3% in P-tau and PP-tau, respectively) corresponds to an additional modification, tentatively assigned as S195, a site reported previously in AD.39 A summary of site occupancies for all phosphorylations detected in P-tau and PP-tau is shown in Figure 4B (see also SI Table S3). The average amino acid resolved site occupancy was 29.5% (P-tau) and 35.7% (PP-tau). As expected, these values are lower than the peptide modification extent mentioned above (33.0% and 42.7%, P-tau and PP-tau, respectively), as there are peptides containing several sites. The strategy to determine specific amino acid resolved site occupancies described above cannot always be applied for two reasons: (i) the sites are in close proximity and/or (ii) there are no adjacent miscleaved peptides. This is the case for the following regions: S68/T76, S199/S202/T205, T212/S214/T217, and T231/S235. For these sites the joined occupancy is determined.
In general, the quantitative PTM landscape suggests that most of the phosphorylation sites present with low stoichiometries. In P-tau, nearly two-thirds (and in PP-tau, a third) of all sites are phosphorylated to an extent below 20%. The combination of sites T231/S235 has the highest occupancy (90.6% and 97.3% for P-tau and PP-tau, respectively). Four other sites are also phosphorylated at a stoichiometry larger than 50% (T181, S199/S202/T205, T212/S214/T217, and S404). Notably, all of these are epitopes of commonly used AD diagnostic antibodies (AT8, AT100, AT180, and PHF1) (see also Figure 4B). Thus, apart from validating the elevated extent of phosphorylation for these regions, FLEXITau is also able to precisely quantify this state referred to as hyperphosphorylated by antibodies used ubiquitously in the study of tauopathies.
Using FLEXITau To Determine the Average Number of Phosphorylations per Tau Molecule
We showed that FLEXITau provides the stoichiometries of identified phosphorylation sites. Using a recursive approach we next calculated the polynomial probability distribution of a particular number of sites being phosphorylated at a given time (SI Figure S4A; for details, see Supporting Information). A shift in the distribution of PP-tau toward to a higher phosphorylation state by one phosphate compared to P-tau was observed, with PP-tau showing a maximum likelihood of eight phosphates per tau molecule, compared to seven for P-tau. The broad base observed for both P-tau and PP-tau shows that there is a wide range of phosphorylation states for tau ranging from 1 to 14 phosphates in the case of P-tau and from 2 to 15 for PP-tau (full width at half-maximum (fwhm) of 4.7 and 5, P-tau and PP-tau, respectively). For joined occupancies, we assume two possible extreme scenarios: the respective sites are present either exclusively alone or exclusively together (SI Figure S4B,C).
Notably, it is possible that some of the phosphorylations sites that we quantify are dependent on one another; i.e., a priming site is required for another phosphorylation to occur.36 The probability estimation does not take into account any site dependencies; if such data are available, it should be incorporated into this calculation, as this will provide additional accuracy for the distribution estimation.
It was reported that P-tau and PP-tau carried 12 and 20 phosphates on average, respectively.26 The discrepancy may be explained by the limited accuracy of low-resolution MALDITOF analyses used in these studies, and by the lack of a labeled standard for the different phospho-protein species.40 In contrast, our assay uses an internal standard providing accurate quantification for each peptide. However, the FLEXITau assay covers only 75% of the amino acid sequence of tau; thus we cannot exclude the possibility of additional phosphorylated residues in the undetected sequence. Hence the calculation may underestimate the total number of phosphates present on tau. Importantly, a multimodal distribution of tau species with differing numbers of tau modifications may exist. Combinatorial PTM patterns could be measured using complementary top-down mass spectrometry.41,42
Using FLEXITau To Examine the PTM Landscape of Human AD-Tau
Above, we exemplify the power of the FLEXITau approach to quantify the modification landscape of purified, hyperphosphorylated Sf9-tau, i.e., an “artificial” substrate. However, this assay could be applied in many biological settings, including more complex mixtures. Thus, to show its versatility, we next aimed to apply FLEXITau to a tau species in a complex, disease-related human sample and analyzed tau aggregates derived from AD patient brains using FLEXITau, and to compare this quantitative data to the Sf9-tau to evaluate this cellular model as a proxy to disease.
A traditional sarkosyl fractionation of post-mortem cortical brain tissue was used to enrich for insoluble AD tau species (AD-tau) (SI Table S4). AD-tau was subjected to the FLEXITau workflow, and quantitative data were acquired. The overall modification extent of AD-tau was more than 2-fold higher than that of the Sf9 model tau (AD-tau 77.2%, compared to 34.1% in P-tau and 42.4% PP-tau, respectively). AD-tau FLEXITau data are presented as a heat map from N- to C-terminus in comparison to P-tau and PP-tau (Figure 5A). The data indicate that the N-terminus is considerably more modified in AD-tau compared with Sf9-tau. Notably, the proline-rich region shows high-modification extent for both Sf9- and AD-tau, while the repeat regions are less modified in both, particularly R3 and R4.
Figure 5.
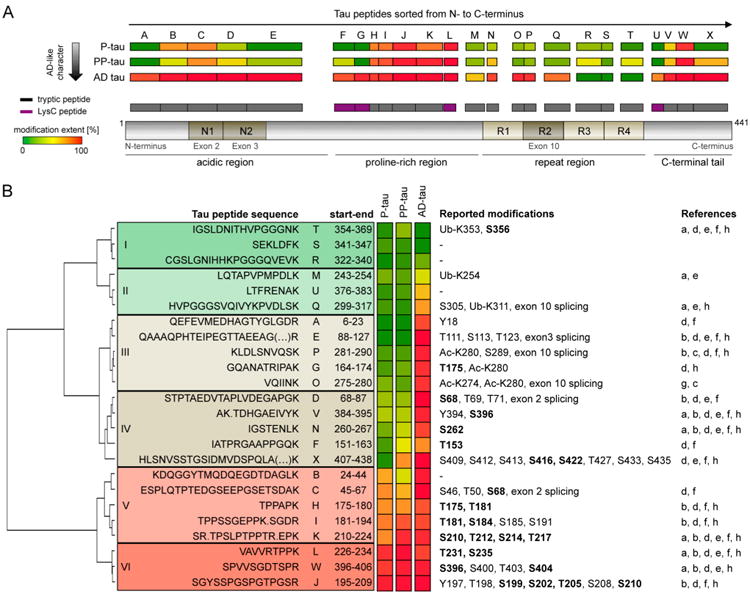
Applicability of FLEXITau to human disease. (A) Sarkosyl insoluble tau from post-mortem brains of three different AD patients was subjected to the FLEXITau workflow (triplicate SRM measurements). The modification extent of each peptide was compared to Sf9-tau (see also Figure 3D) and in-scale mapped to a schematic tau protein. The color code depicts the respective modification extent (green, no modification; red, 100% modification). (B) Peptides were sorted using hierarchical clustering of the FLEXITau data (Euclidean distance, Ward's criteria). PTMs reported on AD-tau in the literature are listed next to the corresponding peptide. If no prefix is present, the amino acid site refers to phosphorylation: ub, ubiquitination, ac, acetylation, bold, modifications detected in Sf9-tau. References: (a) Cripps et al.,1 (b) Hanger et al.,2 (c) Cohen et al.,3 (d) Martin et al.,4 (e) Thomas et al.,5 (f) Noble et al.,14 (g) Grinberg et al.,15 and (h) Dammer et al.22
To systematically assess the quantitative differences in the extent of modification for Sf9-tau and AD-tau, we performed a hierarchical cluster analysis of the FLEXITau data (Euclidean distance, Ward criteria). This analysis grouped the peptides into six distinct classes (I–VI, Figure 5B). Classes I and II contained peptides with no or little modification extent in Sf9-tau (below 15%), with class I showing none at all and class II showing minor modification in AD-tau (below 60%). Class III and IV peptides showed drastic differences between Sf9-tau and AD-tau: peptides in classes III and IV showed high-modification stoichiometry in AD-tau (on average 88%), while Sf9-tau showed little or no modification respectively Finally, class V and VI peptides were highly modified in all three species: class V contained peptides that showed enhanced modification in AD-tau, and class VI peptides were modified to a similar extent in all tau samples. In summary, one-third of the quantified peptides (31% of tau sequence analyzed) were modified to a similar extent in AD-tau as in the Sf9 species, while the remaining two-thirds of the peptides showed significantly higher modification extent in AD-tau.
As mentioned above, many PTMs of PHF-tau from AD brain have been described using different types of enrichment strategies1–3,5,15,22 (reviewed in refs 4 and 14). To investigate the quantitative differences between AD-tau and Sf9 qualitatively, we took advantage of these data sets and mapped all reported modifications to the peptides from the FLEXITau data set (Figure 5B, right panel). Most of the differences of AD-tau to Sf9-tau could be explained by additional modifications on the respective peptides. The peptides that reflected the biggest changes between Sf9-tau and AD-tau (class III and class IV peptides) harbor multiple additional phosphorylation as well as acetylation sites (such as ac-K274 and ac-K280), highlighting the importance of modifications other than phosphorylation when studying tau aggregation. In addition, we note that classes III and IV include peptides from exons 2, 3, and 10 that can be spliced out and can thus contribute to the reduced levels of unmodified peptides in these regions. Interestingly, we noticed that all ubiquitinylation sites reported so far1 are located on peptides that contain few other modifications and display low modification extent (class I and II peptides). Furthermore, peptides highly modified in both AD-tau and Sf9-tau (classes V and VI) exclusively harbored phosphorylation (and no other type of modification). Notably, the epitopes of the most commonly used AD diagnostic antibodies are located on these peptides. However, multiple additional phosphorylation sites are present on AD-tau that were not identified on Sf9-tau.
We also applied the recursive approach mentioned above to calculate the distribution of the average number of phosphates per tau molecule. We determined that, on average, AD-tau contains 10 phosphates per tau molecule and the distribution of sites per tau molecule ranges between a minimum of 4 to a maximum of 19 (SI Figure S4D,E).
While possibly representing a model for specific phosphor-ylation sites in the proline-rich domain, altogether these data reveal significant qualitative and quantitative differences between Sf9-tau and AD-tau, even with respect to phosphorylation. These findings corroborate the usefulness and necessity of a global unbiased assay such as FLEXITau when assessing the PTM state of tau or comparing different tau species.
Conclusion
The number and diversity of tau modifications is large, and misregulation of tau PTMs is believed to directly or indirectly lead to tau aggregation. However, current approaches to study tau modifications are not capable of capturing the many possible combinations of PTMs simultaneously, let alone in a quantitative manner. We designed FLEXITau, a highly sensitive and robust SRM-based assay that measures unmodified peptide species of tau relative to a heavy standard, rather than aiming for identification of specific PTMs. The key advantage herein is that FLEXITau can be used to study a limitless number of modification sites and species without requiring prior information, thus circumventing many issues typically encountered when using other approaches.25
Unlike other methods, our assay provides an unbiased, comprehensive understanding of the existing PTM landscape. The resulting “signature” can be used to determine relative differences between tau species in a precise manner. In combination with DDA data, site-specific occupancies as well as the average number of occupied sites at a given time can be calculated. Due to its unbiased quantitation the assay can also point toward undetected or even undescribed modifications; those hypothetical sites can be followed up using directed and targeted analysis, emphasizing the versatility of the assay as a tool to identify novel modifications without relying on their immediate detection.
Given its precision and versatility, in the future we envision the application of this assay to a wide range of biological and clinical settings. For examples, with its ability to measure small changes in the PTM landscape, our assay could facilitate the screening of small compounds and monitoring the effect of treatment. This is especially important given the recent interest in tau-targeted therapeutic approaches since the failure of many amyloid-β-targeted therapeutics in phase III clinical trials.43 Offering both the necessary sensitivity and specificity, FLEXITau also has potential as in vivo diagnostic biomarker for tau derived from peripheral fluids such as cerebrospinal fluid or blood, an effort that has been hampered so far by the lack of methods capable of dealing with the molecular heterogeneity and low abundance of tau present in body fluids.
In summary, here we report a method that provides a comprehensive, global analysis of tau PTMs. With its ability to resolve both distribution and occupancy of tau PTMs, we believe that FLEXITau will massively enhance our mechanistic understanding of tau function and untangle the role of tau modifications in physiological and pathological conditions. As such, it will provide a foundation for the development of better diagnostic tools and tau-modulating therapeutic approaches for tauopathies.
Supplementary Material
Experimental details and Figures S1-S5 showing FLEXTau SRM assay development and sequence coverage, detection limit and linearity of the peptide quantification, peptide distributions, frequency distributions of number of phosphates per tau molecule, and purity of Sf9-tau preparation (PDF)
Table S1 listing transitions of FLEXTau (XLSX)
Table S2 summarizing phoshporylated tau peptide species and phosphorylation sites (XLSX)
Table S3 summarizing site occupancies for quantified tau phosphorylation sites (XLSX)
Table S4 listing characteristics of patient material (XLSX)
Acknowledgments
This work was funded by the Tau consortium. The instruments used for this work were funded by U.S. National Institutes of Health (NIH) Grants RC4GM096319 (QTRAP 5500, to H.S.), S10OD010706 (TripleTOF 5600, to H.S.), and ROINS066973 (Q Exactive, to J.A.S.). We thank the Human Brain and Spinal Fluid Resource Center (VA West Los Angeles Healthcare Center, Los Angeles, CA, USA), which is sponsored by NIH, the National Multiple Sclerosis Society, and the U.S. Department of Veterans Affairs. Human tissue samples were also provided by the Neurodegenerative Disease Brain Bank at the University of California, San Francisco that receives funding support from the Tau Consortium, the Consortium for Frontotemporal Dementia Research, and NIA Grants AG023501 and AG19724. We thank Thomas Timm for analysis of the Sf9 proteins by MALDI-TOF and fruitful discussion. We thank Ertrugul Cansizoglu and Eva Maria Mandelkow for critical reading of the manuscript and for fruitful discussions.
Footnotes
Supporting Information: The Supporting Information is available free of charge on the ACS Publications website at DOI: 10.1021/acs.anal-chem.5b04509.
Author Contributions: W.M. performed all LC-MS/MS experiments and data evaluation; J.M. contributed to MS analysis, data evaluation, and writing the manuscript; J.B. and K.T. prepared Sf9-tau preparations; S.T. was involved in data analysis; W.W.S. discussed and planned experiments and selected and provided tissues; K.S.K. discussed and designed experiments; E.M. discussed experiments and provided tau protein (Sf9-tau and E. coli hTau40); J.A.S. and H.S. conceived the project; J.A.S. oversaw the experiments and supervised the work; W.M. and J.A.S. wrote the manuscript; all authors critically read and revised the manuscript.
Notes: The authors declare no competing financial interest.
References
- 1.Cripps D, Thomas SN, Jeng Y, Yang F, Davies P, Yang AJ. J Biol Chem. 2006;281:10825–10838. doi: 10.1074/jbc.M512786200. [DOI] [PubMed] [Google Scholar]
- 2.Hanger DP, Byers HL, Wray S, Leung KY, Saxton MJ, Seereeram A, Reynolds CH, Ward MA, Anderton BH. J Biol Chem. 2007;282:23645–23654. doi: 10.1074/jbc.M703269200. [DOI] [PubMed] [Google Scholar]
- 3.Cohen TJ, Guo JL, Hurtado DE, Kwong LK, Mills IP, Trojanowski JQ, Lee VMY. Nat Commun. 2011;2:252. doi: 10.1038/ncomms1255. [DOI] [PMC free article] [PubMed] [Google Scholar]
- 4.Martin L, Latypova X, Terro F. Neurochem Int. 2011;58:458–471. doi: 10.1016/j.neuint.2010.12.023. [DOI] [PubMed] [Google Scholar]
- 5.Thomas SN, Funk KE, Wan Y, Liao Z, Davies P, Kuret J, Yang A. J Acta Neuropathol. 2012;123:105–117. doi: 10.1007/s00401-011-0893-0. [DOI] [PMC free article] [PubMed] [Google Scholar]
- 6.Avila J, Lucas JJ, Perez M, Hernandez F. Physiol Rev. 2004;84:361–384. doi: 10.1152/physrev.00024.2003. [DOI] [PubMed] [Google Scholar]
- 7.Dixit R, Ross JL, Goldman YE, Holzbaur ELF. Science (Washington, DC, U S) 2008;319:1086–1089. doi: 10.1126/science.1152993. [DOI] [PMC free article] [PubMed] [Google Scholar]
- 8.Bancher C, Brunner C, Lassmann H, Budka H, Jellinger K, et al. Brain Res. 1989;477:90–99. doi: 10.1016/0006-8993(89)91396-6. [DOI] [PubMed] [Google Scholar]
- 9.Kopke E, Tung YC, Shaikh S, Alonso AC, Iqbal K, Grundke-Iqbal I. J Biol Chem. 1993;268:24374–24384. [PubMed] [Google Scholar]
- 10.Min SW, Cho SH, Zhou Y, Schroeder S, Haroutunian V, et al. Neuron. 2010;67:953–966. doi: 10.1016/j.neuron.2010.08.044. [DOI] [PMC free article] [PubMed] [Google Scholar]
- 11.Iqbal K, Grundke-Iqbal I. Mol Neurobiol. 1991;5:399–410. doi: 10.1007/BF02935561. [DOI] [PubMed] [Google Scholar]
- 12.Wang JZ, Grundke-Iqbal I, Iqbal K. Nat Med. 1996;2:871–875. doi: 10.1038/nm0896-871. [DOI] [PubMed] [Google Scholar]
- 13.Takahashi M, Tsujioka Y, Yamada T, Tsuboi Y, Okada H, Yamamoto T, Liposits Z. Acta Neuropathol. 1999;97:635–641. doi: 10.1007/s004010051040. [DOI] [PubMed] [Google Scholar]
- 14.Noble W, Hanger DP, Miller CCJ, Lovestone S. Front Neurol. 2013;4:83. doi: 10.3389/fneur.2013.00083. [DOI] [PMC free article] [PubMed] [Google Scholar]
- 15.Grinberg LT, Wang X, Wang C, Sohn PD, Theofilas P, et al. Acta Neuropathol. 2013;125:581–593. doi: 10.1007/s00401-013-1080-2. [DOI] [PMC free article] [PubMed] [Google Scholar]
- 16.Russell CL, Koncarevic S, Ward MA. J Alzheimer's Dis. 2014;41:345–364. doi: 10.3233/JAD-132312. [DOI] [PubMed] [Google Scholar]
- 17.Morris M, Knudsen GM, Maeda S, Trinidad JC, Ioanoviciu A, Burlingame AL, Mucke L. Nat Neurosci. 2015;18:1183–1189. doi: 10.1038/nn.4067. [DOI] [PMC free article] [PubMed] [Google Scholar]
- 18.Martin L, Latypova X, Wilson CM, Magnaudeix A, Perrin ML, Yardin C, Terro F. Ageing Res Rev. 2013;12:289–309. doi: 10.1016/j.arr.2012.06.003. [DOI] [PubMed] [Google Scholar]
- 19.McAvoy T, Lassman ME, Spellman DS, Ke Z, Howell BJ, et al. Clin Chem. 2014;60:683–689. doi: 10.1373/clinchem.2013.216515. [DOI] [PubMed] [Google Scholar]
- 20.Petry FR, Pelletier J, Bretteville A, Morin F, Calon F, Hebert SS, Whittington RA, Planel E. PLoS One. 2014;9:e94251. doi: 10.1371/journal.pone.0094251. [DOI] [PMC free article] [PubMed] [Google Scholar]
- 21.Prabakaran S, Everley RA, Landrieu I, Wieruszeski JM, Lippens G, Steen H, Gunawardena J. Mol Syst Biol. 2011;7:482. doi: 10.1038/msb.2011.15. [DOI] [PMC free article] [PubMed] [Google Scholar]
- 22.Dammer EB, Lee AK, Duong DM, Gearing M, Lah JJ, Levey AI, Seyfried NT. Proteomics. 2015;15:508–519. doi: 10.1002/pmic.201400189. [DOI] [PMC free article] [PubMed] [Google Scholar]
- 23.Kang MJ, Kim C, Jeong H, Cho BK, Ryou AL, Hwang D, Mook-Jung I, Yi EC. Exp Mol Med. 2013;45:e29. doi: 10.1038/emm.2013.56. [DOI] [PMC free article] [PubMed] [Google Scholar]
- 24.Hanger DP, Betts JC, Loviny TL, Blackstock WP, Anderton BH. J Neurochem. 1998;71:2465–2476. doi: 10.1046/j.1471-4159.1998.71062465.x. [DOI] [PubMed] [Google Scholar]
- 25.Singh S, Springer M, Steen J, Kirschner MW, Steen H. J Proteome Res. 2009;8:2201–2210. doi: 10.1021/pr800654s. [DOI] [PMC free article] [PubMed] [Google Scholar]
- 26.Tepper K, Biernat J, Kumar S, Wegmann S, Timm T, et al. J Biol Chem. 2014;289:34389–34407. doi: 10.1074/jbc.M114.611368. [DOI] [PMC free article] [PubMed] [Google Scholar]
- 27.Baas PW, Pienkowski TP, Kosik KS. J Cell Biol. 1991;115:1333–1344. doi: 10.1083/jcb.115.5.1333. [DOI] [PMC free article] [PubMed] [Google Scholar]
- 28.Picotti P, Bodenmiller B, Mueller LN, Domon B, Aebersold R. Cell. 2009;138:795–806. doi: 10.1016/j.cell.2009.05.051. [DOI] [PMC free article] [PubMed] [Google Scholar]
- 29.Addona TA, Abbatiello SE, Schilling B, Skates SJ, Mani DR, et al. Nat Biotechnol. 2009;27:633–641. doi: 10.1038/nbt.1546. [DOI] [PMC free article] [PubMed] [Google Scholar]
- 30.Keshishian H, Addona T, Burgess M, Kuhn E, Carr SA. Mol Cell Proteomics. 2007;6:2212–2229. doi: 10.1074/mcp.M700354-MCP200. [DOI] [PMC free article] [PubMed] [Google Scholar]
- 31.Unwin RD, Griffiths JR, Whetton AD. Nat Protoc. 2009;4:870–877. doi: 10.1038/nprot.2009.57. [DOI] [PubMed] [Google Scholar]
- 32.Prakash A, Rezai T, Krastins B, Sarracino D, Athanas M, et al. J Proteome Res. 2010;9:6678–6688. doi: 10.1021/pr100821m. [DOI] [PubMed] [Google Scholar]
- 33.Escher C, Reiter L, MacLean B, Ossola R, Herzog F, Chilton J, MacCoss MJ, Rinner O. Proteomics. 2012;12:1111–1121. doi: 10.1002/pmic.201100463. [DOI] [PMC free article] [PubMed] [Google Scholar]
- 34.Kosik KS, Mc Conlogue L. Cell Motil Cytoskeleton. 1994;28:195–198. doi: 10.1002/cm.970280302. [DOI] [PubMed] [Google Scholar]
- 35.Biernat J, Mandelkow EM. Mol Biol Cell. 1999;10:727–740. doi: 10.1091/mbc.10.3.727. [DOI] [PMC free article] [PubMed] [Google Scholar]
- 36.Zheng-Fischhofer Q, Biernat J, Mandelkow EM, Illenberger S, Godemann R, Mandelkow E. Eur J Biochem. 1998;252:542–552. doi: 10.1046/j.1432-1327.1998.2520542.x. [DOI] [PubMed] [Google Scholar]
- 37.Hanger DP, Anderton BH, Noble W. Trends Mol Med. 2009;15:112–119. doi: 10.1016/j.molmed.2009.01.003. [DOI] [PubMed] [Google Scholar]
- 38.Wray S, Saxton M, Anderton BH, Hanger DP. J Neurochem. 2008;105:2343–2352. doi: 10.1111/j.1471-4159.2008.05321.x. [DOI] [PubMed] [Google Scholar]
- 39.Duka V, Lee JH, Credle J, Wills J, Oaks A, et al. PLoS One. 2013;8:e75025. doi: 10.1371/journal.pone.0075025. [DOI] [PMC free article] [PubMed] [Google Scholar]
- 40.Parker L, Engel-Hall A, Drew K, Steinhardt G, Helseth DL, Jr, Jabon D, Mc Murry T, Angulo DS, Kron SJ. J Mass Spectrom. 2008;43:518–527. doi: 10.1002/jms.1342. [DOI] [PMC free article] [PubMed] [Google Scholar]
- 41.Siuti N, Kelleher NL. Nat Methods. 2007;4:817–821. doi: 10.1038/nmeth1097. [DOI] [PMC free article] [PubMed] [Google Scholar]
- 42.Han X, Jin M, Breuker K, McLafferty FW. Science. 2006;314:109–112. doi: 10.1126/science.1128868. [DOI] [PubMed] [Google Scholar]
- 43.Brunden KR, Trojanowski JQ, Lee VMY. Nat Rev Drug Discovery. 2009;8:783–793. doi: 10.1038/nrd2959. [DOI] [PMC free article] [PubMed] [Google Scholar]
Associated Data
This section collects any data citations, data availability statements, or supplementary materials included in this article.
Supplementary Materials
Experimental details and Figures S1-S5 showing FLEXTau SRM assay development and sequence coverage, detection limit and linearity of the peptide quantification, peptide distributions, frequency distributions of number of phosphates per tau molecule, and purity of Sf9-tau preparation (PDF)
Table S1 listing transitions of FLEXTau (XLSX)
Table S2 summarizing phoshporylated tau peptide species and phosphorylation sites (XLSX)
Table S3 summarizing site occupancies for quantified tau phosphorylation sites (XLSX)
Table S4 listing characteristics of patient material (XLSX)