

Summary
The body’s first line of defense against environmental assaults, the skin barrier is maintained by epithelial stem cells (EpSCs). Despite EpSCs’ vulnerability to inflammatory pressures, neither the primary response nor its enduring consequences are understood. Here, we unearth a prolonged memory to acute inflammation that enables EpSCs to hasten barrier restoration following subsequent tissue damage. This functional adaptation does not require skin resident macrophages or T cells. Rather, EpSCs maintain chromosomal accessibility at key stress response genes that are activated by the primary stimulus. Upon a secondary challenge, genes governed by these domains are transcribed rapidly. Fueling this memory is Aim2, encoding an activator of the inflammasome. Absence of AIM2 or its downstream effectors, Caspase-1 and Interleukin-1β, erases EpSCs’ ability to recollect inflammation. While EpSCs benefit from inflammatory tuning by heightening their responsiveness to subsequent stressors, this enhanced sensitivity likely increases their susceptibility to autoimmune and hyperproliferative disorders, including cancer.
Adult stem cells (SCs) maintain and repair tissues in health and disease. As such, these cells must sense and respond to environmental assaults. Epithelial barriers are especially vulnerable as they are exposed to a range of commensal and pathogenic microbes and noxious agents. How epithelial tissues, and in particular their long-lived SCs, respond to and cope with recurrent inflammation-provoking signals is unknown.
Epithelial stem cells (EpSCs), housed in the innermost (basal) layer of skin epithelium, can self-renew and also execute a terminal differentiation program that generates a constant upward flux of barrier cells1, 2. Defined niche factors emanating from the basement membrane and underlying dermis induce molecular programs that maintain EpSC identity and lineage commitment3, 4. How EpSCs endure assaults and restore normalcy is less clear, and yet their ability to do so is vital to survival. Here, we focused on how skin epithelial SCs respond to inflammatory stimuli. In doing so, we uncovered a capacity of EpSCs to learn from their experience for the sake of long-term tissue fitness and function.
Lineage tracing EpSCs in inflammation
To examine how SCs are impacted by inflammation, we utilized a model of skin inflammation induced by toll like receptor 7 (TLR7) and NALP3 agonist imiquimod (IMQ)5–7. In agreement with prior reports6, topical IMQ application elicited hyperthickening and parakeratosis primarily within epidermis and upper hair follicle (infundibulum), accompanied by EpSC hyperproliferation and apoptosis, peaking at day 6 (D6) (Fig. 1a and Extended Data Fig. 1a). By D30, these striking perturbations subsided.
Figure 1. Enhanced epidermal wound repair post-inflammation.

a, IMQ treatment schematic and corresponding histopathology (n=3, P<0.0001). EdU+ basal epidermal and upper hair follicle (infundibulum) cells (n=3, P=0.01) DAPI, 4’,6-diamidino-2-phenylindole. b, Accelerated wound-healing in 30D (n=17, P<0.0001) and 180D (n=5, P=0.0003) post-inflamed (PI) versus Ctrl skin (images n=3). Rate calculated from wound area: D30 see adjacent graph; D180 see Extended Data Fig. 2b; individual data points see source data. c, Accelerated closure irrespective of initial inflammatory stimulus (n≥4). MC903 (P=0.0001), Calcipotriol; TPA, 12-O-Tetradecanoylphorbol-13-acetate (P=0.0014); Wound, epidermal abrasion (P=0.0027); Fungi, 106 Candida albicans infection (P=0.0029). Rate calculated from wound area in Extended Data Fig. 2c. d, Accelerated re-epithelialization in inflammation-experienced skin (n=3). Lines denote initial wound edges and arrows mark wound bed (w.b.). e, Quantifications of Integrin-α5+, K14+ epidermal tongue (n=4. D3 P=0.034, D5 P=0.037) and K14+, K17+,EdU+ proliferating wound-edge basal cells (n≥2). f, Wound closure of silicone-splinted, 3 mm full-thickness wounds (n=3. D5 P<0.0001, D10 P=0.0374). g, Analysis of K14+ keratinocyte D10 ex vivo explants outgrowth. Yellow and red lines mark outgrowth boundary and distance, respectively (n≥14. P=0.0006). Scale bars: (a-EdU), 50 µm; (a-histology), d 200 µm; b, 2 mm; g, 500 µm. Plots depict mean ± SEM. n=x biologically independent animals. Experiments replicated ≥ 2 times and significance determined using two-tailed t-test (95% confidence). Non-significant (ns, P>0.05).
Given these self-resolving features, we wondered whether D6 inflammation-sensitized SCs and/or their progeny contribute to epidermal homeostasis following resolution of inflammation. To track SC dynamics, we utilized inducible-marker based fate mapping2 with Rosa-LSL-YFP reporter mice harboring CreER driven by the Krt14 or Krt10 promoter. Keratin 14 (K14) is present in all skin EpSCs, and at low doses of tamoxifen, Krt14CreER preferentially labels EpSCs of epidermis (and infundibulum). In contrast, Krt10CreER is expessed in differentiating layers (Extended Data Fig. 1b).
Tamoxifen-treated Krt14CreER;Rosa-LSL-YFP mice8 were topically treated with IMQ and lineage-traced for up to 180D post-inflammation. YFP+ cells persisted at equivalent numbers as naïve (control) skin despite restoration of homeostasis by D30 (Extended Data Fig. 1b,c).2. Since Cre-recombinase was not activated without tamoxifen (Extended Data Fig. 1d), the YFP+ EpSCs were long-lived and had survived the inflammatory assault. By contrast, Krt10CreER-activated YFP+ cells though present initially were shed within 6D indicating that once progenitors commit to terminal differentiation, they do not revert even in response to IMQ (Extended Data Fig. 1b,e).
Enhanced wound healing post-inflammation
The persistence of inflammation-experienced EpSCs long after restoration of homeostasis led us to address whether this assault may have had a lasting impact on them and/or their microenvironment. We therefore challenged inflammation-recovered skin with a secondary assault, in this case wounding. Strikingly, post-inflamed (PI) mice closed their wounds ~2.5X faster than naïve mice. The enhanced wound response by inflammation-experienced skin occurred even when the initial assault had occurred 180D earlier (Fig. 1b and Extended Data Fig. 2a and 2b).
To determine whether this heightened sensitivity might be triggered by other inflammatory stimuli, we replaced IMQ with topical treatments of vitamin D analog MC903 (to model atopic dermatitis)9, 12-O-tetradecanoylphorbol 13-acetate (TPA)10 (inflammation-induced hyperplasia), epidermal abrasion wounding (“sterile” wound)11, or infection with fungal pathogen Candida albicans12. In all cases, wounds healed faster in inflammation-experienced skin (Fig. 1c and Extended Data Fig. 2c). These results underscored the generality of the response, indicating that once skin is sensitized to inflammation, it reacts faster when faced with a secondary assault.
Following a full-thickness wound, re-epithelialization is mediated by sensitized epidermal EpSCs, which transiently express K1713. Inflammation-experienced skin displayed enhanced epidermal thickness and accelerated re-epithelialization, but showed similar proliferation rates (Fig. 1d, e and Extended Data Fig. 2d). Re-epithelialization by the migrating K14+ and integrin α5+ epidermal tongue neared completion by D5 in wounded post-inflamed skin, healing 2D faster than naïve counterparts.
To exclude myofibroblast-mediated dermal contraction as a significant contributor to augmented wound closure post-inflammation, we affixed a silicone splint around full-thickness wounds14. Inflammation-experienced mice still exhibited enhanced re-epithelialization and accelerated wound repair (Fig. 1f and Extended Data Fig. 2e). Moreover, using an assay that specifically measures keratinocyte migration (Extended Data Fig. 2f), we found that keratinocyte outgrowth from ex vivo explants post-inflammation13 was more robust than controls (Fig. 1g). These findings suggest that inflammation induces long-term changes in EpSCs that enhance their capacity to react swiftly to a secondary assault.
IMQ intrinsically sensitizes EpSCs
EpSCs receive cues from their local milieu as well as from infiltrating immune cells and circulating factors that direct wound repair. Thus, we evaluated the relative importance of these secondary effectors on the sensitization of inflammation-experienced skin to wounding. When IMQ was applied to half the dorsal skin, pathology remained restricted to the treatment site (local), and upon subsequent wounding, distal sites closed comparably to control skin (Fig. 2a,b and Extended Data Fig. 3a). Thus, EpSC memory of inflammation was not transmitted through systemic (circulating) factors to naïve sites.
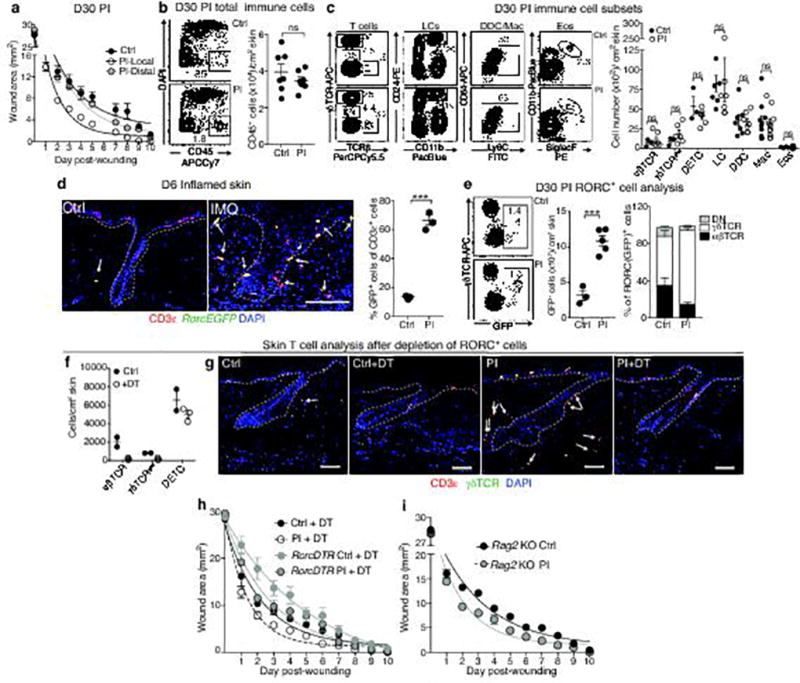
Figure 2. Resident skin macrophages and T cells are dispensable for enhanced wound closure post-inflammation.

a, Epidermal hyperthickening is confined to initial inflammation site. (n=3, ≥3 images/animal. **P=0.0019, ***P=0.0009). b, D30 wound closure is accelerated only at sites of prior IMQ treatment. n=12. P<0.0001. c, Clodronate liposome mediated resident macrophage depletion before wounding does not alter wound repair advantage post-inflammation (PI) (Flow n=2. wound rate n≥4. Ctrl P=0.0419, Clodronate P=0.0266). d, Skin RORC+ cell populations. e, RORC+ T cells (white arrows) are elevated at D30 PI (n≥3, 3 images/animal. P=0.0056). Experiments performed with RorcEGFP mice. Lines denote dermo-epidermal border, *denotes autofluorescence, and yellow box denotes magnified area in adjacent panel. f, Wounds heal faster in PI skin despite ablation of skin RORC+ cells (Flow cytometry, n=4, P=0.0008). Schematic of RORC+ cell depletion and wound repair using Rosa-LSL-iDTR (Ctrl) and RorcCre;Rosa-LSL-iDTR (RorcDTR) mice (n=5. Ctrl P=0.005, RorcDTR P=0.0053). DT, diphtheria toxin; DTR, DT receptor. g, Rag2-null mice mount a IMQ response (n=3, 3 images/ animal) and h, display accelerated wound-healing at D30 PI (n=5. P=0.0136). KO, knockout. Rate calculated from wound area: b, Extended Data Fig. 3a; c, see source data; g Extended Data Fig. 3h; h, Extended Data Fig. 3i. Plots depict mean ± SEM. Scale bars: a, 200 µm; e, g, 50 µm. n=x biologically independent animals. Experiments replicated ≥ 2 times and significance was determined using a two-tailed t-test (95% confidence). Non-significant (ns, P>0.05).
We next tested whether the heightened responsiveness of inflammation-experienced EpSCs was secondarily dependent upon memory of resident innate and adaptive immune cells15. CD45+ cells and various innate immune cell subsets [Langerhans cells (LCs), dermal dendritic cells (DDCs), macrophages (Mac), eosinophils (Eos), γδ T cells, dermal γδ T cells (γδ TCRlow), dendritic epidermal T cells (DETCs, γδ TCRhigh)] returned to normal levels by D30 post-inflammation (Extended Data Fig. 3b,c). Moreover, depletion of skin resident macrophages prior to wounding showed no obvious impact on the wound repair advantage displayed by EpSCs post-inflammation (Fig. 2c).
The initial psoriatic-like response triggered by IMQ is dependent upon dermal γδ TCRlow T lymphocytes that express RORC (retinoic acid receptor-related orphan receptor C)7 (Fig. 2d). Additionally, relative to control, RORC+ adaptive immune cells were elevated in IMQ-treated skin both at the peak of inflammation (5.0X) and in post-inflamed skin (1.8X) and in close proximity to epidermis and HFs (Fig. 2e and Extended Data Fig. 3d,e).
Consistent with the involvement of tissue resident T cells in wound repair and pathogen responses12, 16, wounds closed slower when inflammation-experienced or naïve skins were depleted of their RORC+ lymphocytes. Notably however, even after RORC+ cell depletion, inflammation-experienced skin still closed wounds ~2X faster compared to naïve skin counterparts. Moreover Rag2-null mice, which mount an inflammatory response to IMQ despite the absence of B and T cells,7 also exhibited faster wound closure post-inflammation as compared to naïve skin. These data are compiled in Fig. 2f–h and Extended Data Fig. 3f–i.
EpSC memory at the chromatin level
Memory of prior exposure to inflammatory stimuli has long been thought to be exclusive to immune cells. We posited that the heightened responsiveness of post-inflamed EpSCs to tissue damage may involve chromatin dynamics analogous to those recently described for innate immune memory17. To this end, we purified epidermal EpSCs from IMQ-treated skin at the zenith of inflammation (D6) and after their return to normal homeostasis (D30 and D180) (Extended Data Fig. 4a–c). We then employed Assay for Transposase Accessible Chromatin with high-throughput sequencing (ATAC-seq)18. Agnostic to specific types of epigenetic modifications, this strategy enables global identification of accessible chromatin states.
Independent biological replicates showed strong correlation (R2≥0.97). ATAC signals were enriched at transcription start sites (TSS) and distal regulatory elements CCCTC-binding factor (CTCF) sites, and were similarly distributed over various genomic and intergenic regions in all samples (Extended Data Fig. 4d,e). Although EpSC-specific genes, such as Klf5 and Krt14, showed similar chromatin accessibility patterns, striking differences were seen between D6 IMQ-treated and control EpSCs (Fig. 3a and Extended data Fig. 4f–h). 44,414 peaks19 (31% of total) surfaced after IMQ treatment. Associated genes20 were enriched (p<10−12) in motifs21 for key epidermal transcription factors (TFs) [AP-1 (Jun, Fos, ATF members), AP2γ, KLF5, ETS2, GRHL2/3, p63], as well as TFs such as NF-κB, and STAT1/3, whose activation has been associated with inflammation.
Figure 3. EpSCs possess memory of inflammation at the chromatin level.

a, Heatmaps (two tailed t-test, P<0.05) and Venn diagrams of ATAC-seq signals (500 bp genomic windows) of D6 inflamed versus naïve EpSCs (n=3). Numbers of genomic windows displayed (n) below heatmaps; peak percentages are indicated on diagrams. b, Venn diagram of ATAC-seq peaks (numbers indicated on diagram) unique to D6 IMQ and D30 post-IMQ EpSCs (random permutation, P<10−4). c, Snapshot of genomic loci whose chromatin-accessible peaks are opened by inflammation at D6 and persist up to 180D following resolution. d, PANTHER pathways analysis of 2041 shared, inflammation-induced peaks between D6 IMQ and D30 post-IMQ EpSCs. e, Transcription factor motif enrichment within shared peaks in (b) (n=3. cumulative binomial distributions, P<10−12). f, Epidermal STAT3 activation (pSTAT3Y705) in D6 inflamed and D30-PI skin 12hrs post-wounding, but not in D30-PI unwounded skin (n=3).Wound bed (w.b.). Scale bars: 50 µm. n=x biologically independent animals. Experiments replicated ≥ 2 times.
By D30 after IMQ-exposure, many peaks had resolved. Notably however, >2,000 IMQ-induced peaks were maintained, suggestive of an epigenetic memory. Some peaks were even present at D180, long after inflammation had resolved. PANTHER pathway analysis of their assigned genes revealed enrichment for inflammation- and hyperproliferation-associated pathways, including apoptosis signaling, interleukin signaling, oxidative stress response, RAS and PI3 kinase pathways (Fig. 3a–d and Extended Data Fig. 4g).
Associated with peaks persisting post-inflammation were DNA sequences enriched for both epidermal and inflammation-induced TF motifs (Fig. 3e). STAT3 was notable as it is known to be phosphorylated and activated upon IMQ treatment7. While it was re-activated in the secondary wound response, STAT3 activity was not maintained during the interim (Fig. 3f).
Inflammation-sensing chromatin elements
Our data thus far suggest that inflammation-activated TFs facilitate the initial opening of certain chromatin domains, which then bind epidermal TFs and other chromatin modifiers present in both inflammatory/stress and post-inflamed/homeostatic states. The model further predicts that domains maintained post-inflammation should serve as accessible platforms for accelerated re-activation upon a secondary assault (Fig. 4a).
Figure 4. EpSC memory encodes inflammatory sensors that rapidly reactivate to enhance secondary wound responses.

a, Model of EpSC inflammatory memory. InfTFs, inflammation induced transcription factors. b, Persisting accessible chromatin domains induced by inflammation, can drive inflammation-specific EGFP reporter activity in EpSCs in vivo. n=2. Schematic of in utero lentiviral transduction of skin epithelium. Pgk-H2B-RFP expression marks transduced EpSCs. Scale bar, 50 µm. Lines demarcate dermo-epidermal border. c, Differences between transcriptomes of D6 inflamed or D30 post-inflamed (PI) ± wounding, relative to respective control EpSCs. Shown are MA plots, number (n) of significant differentially expressed transcripts (FDR<0.05) noted on the figure and depicted by red dots (n=4). d, Of 140 transcripts upregulated rapidly after wounding of PI versus control skin (grey), 73 (dark grey) were encoded by genes (red) associated with chromatin accessible domains that were unique to post-inflamed EpSCs. (random permutation, P<10−4). e, Ingenuity Pathways Analysis of up-regulated transcripts in post-inflamed 12 hr wound edge EpSCs relative to control (n=4. right-tailed fisher exact test, P values plotted). f, Elevated Aim2 transcription associated with inflammation, memory and rapid wound response in post-inflamed skin, post-wounding (p.w.), (n≥2. two tailed t-test, D6 and 12hr p.w. P=<0.0001, D180 P= 0.0001). g, Aim2-null mice do not show enhanced wound healing post-inflammation (n≥2. two tailed t-test, WT P=0.0002). h, Epithelial Aim2 overexpression is sufficient to augment wound healing in naïve mice (n=2). Plots depict mean ± SEM. Rate calculated from wound area: g, Extended Data Fig. 4e; h, Extended Data Fig. 4f. KO, knockout, TRE, tetracycline response element, OE, Overexpression. n=x biologically independent animals. Experiments replicated ≥ 2 times.
We tested two important facets of this model. First, we interrogated the ability of these persisting chromatin peaks to function as inflammation-sensing elements. Using our EpSC-specific in utero lentiviral delivery method22 (Methods), we engineered mice harboring Pgk-H2B-RFP and EGFP transgenes driven by one of several accessible genomic regions sustained post-inflammation. In contrast to Pgk-H2B-RFP, expressed throughout virally transduced skin epithelium, the EGFP reporters were not activated until IMQ was administered, underscoring their potential to act as tissue damage sensors (Fig. 4b).
If the persisting open chromatin domains post-inflammation are physiologically relevant to the functional EpSC memory, then they should participate in the accelerated wound repair that we observe in inflammation-experienced mice. To test this possibility, we wounded the skin of D30 post-inflamed mice, and 12 hrs later we evaluated the transcriptional response of EpSCs within a ~0.5mm2 radius of the wound edge. In parallel, we transcriptionally profiled the epidermal EpSCs from Ctrl and IMQ treated skins at D6 and D30 post-inflammation.
In line with the epidermal pathology, EpSCs from D6 IMQ treated skin displayed dramatic transcriptome changes relative to control counterparts. Changes correlated well with genes featuring newly acquired ATAC peaks (Fig. 4c and Extended Data Fig. 5a–c). While only a few of these genes were still transcribed at D30 (FDR <0.05), this picture changed rapidly upon wounding (Fig. 4c,d). Of the 140 genes upregulated within 12hrs post-injury, 73 (52%) were associated with ATAC-seq peaks that were acquired during and sustained after IMQ treatment (FDR<0.05). Given that wound re-epithelialization did not peak until D5 post-wounding, this early activation of genes associated with inflammation-experienced chromatin accessible regions was notable.
Downstream effectors of EpSC memory
To understand how these “inflammatory memory” chromatin elements might confer a wound repair advantage, we first performed pathway analysis of the rapid-response transcripts (p-adj<0.05) whose genes harbor these chromatin elements. Within the top terms was “inflammasome signaling” (Fig. 4e). This included not only ‘Absent in Melanoma 2’ (AIM2)23, implicated previously in skin disease and cancer24, 25, but also other downstream components of the AIM2 inflammasome. AIM2 was particularly intriguing in that its transcript was sustained in EpSCs at D30 and D180 post-inflammation, and also increased following wounding (Fig. 4c,f). Consistent with our finding that the EpSC memory response did not rely upon RORC+ cells, Aim2 was sustained in inflammation-experienced skin depleted of its RORC population (Extended Data Fig. 5d).
Loss- and gain-of-function studies revealed a role for AIM2 in endowing inflammation-experienced EpSCs with their heightened sensitivity to a secondary assault. Aim2-null mice failed to show an inflammation-experienced wound repair advantage (Fig. 4g and Extended Data Fig. 5e). Additionally, when we engineered and tested mice whose skin epithelium harbored an LV-transduced, doxycycline-inducible Aim2 cDNA (TRE-Aim2), we discovered that in the absence of IMQ-preconditioning, elevated Aim2 expression was sufficient to augment wound repair (Fig. 4h and Extended Data Fig. 5f). Altogether, these data underscore a role for AIM2 as a key mediator of the wound repair advantage in post-inflamed EpSCs.
In intestine, AIM2 suppresses stem cell proliferation26, 27 by indirectly inhibiting pAKTSer473 (Extended Data Fig. 6a). However in epidermis, post-inflamed wounds had higher levels of pAKTSer473 and equivalent numbers of proliferating EpSCs to control wounds (Fig. 1e, Extended Data Fig. 2d, 6b). Therefore, we focused on AIM2’s role in the inflammasome pathway that is triggered upon infection or tissue damage24, 28.
A central downstream effector of AIM2 is Caspase-1 (CASP1). CASP1 transcription and activity launched quickly within 12hrs of injury in post-inflamed relative to naïve skin (Fig. 5a). Moreover, when CASP1’s activity was blocked by AC-YVAD-cmk29, wound-healing rates were unaffected in naïve skin, and reduced to naïve levels in inflammation-experienced skin (Fig. 5b and Extended Data Fig. 6c). This was not attributable to CASP1-dependent pyroptosis, since both control and post-inflamed wound edge EpSCs exhibited minimal and equivalent levels of cell death (Extended Data Fig. 6d).
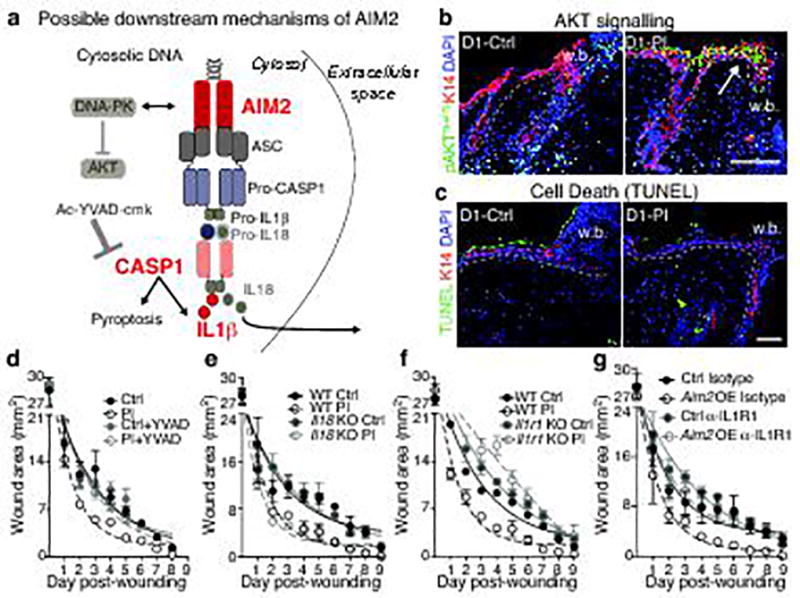
Figure 5. Dissecting the downstream effectors of the AIM2 inflammasome in enhancing wound re-epithelialization of inflammation-experienced skin.

a, Elevated levels of Casp1 transcript (P=0.0025) and CASP1 activity (P=0.0014) in D30 post-inflamed skin, 12hr after wounding (n=3). b, Schematic depicts the experiment. Ac-YVAD-cmk reduces CASP1 activity (left) and wound repair rate (right) post-inflammation to control wound levels (CASP1 activity n=2, wound repair, n=5. P=0.0018, non-significant (ns, P>0.05)). c, Elevated levels of Il18 transcripts (n=3, P=0.0014), IL18 (n=4, P=0.0202) and IL1β protein (n=3, P=0.0073) in PI skin post-wounding, but not Il1β transcripts (n=2). d, Enhanced injury response of post-inflamed skin in the absence of Il18 (n=3. Wildtype (WT) P=0.0146; knockout (KO) P=0.0019). e, Absence of IL1β-signaling, achieved in Il1r1-null mice, abrogates the enhanced injury response of post-inflamed skin (n=4. WT P=0.0155; KO P=0.0086) f, Recombinant IL1β, but not IL18 (50 ng/ml), accelerates outgrowth of K14+ keratinocytes in D5 ex vivo skin explants. Dotted and red lines mark outgrowth border and distance, respectively (n=3; 3 technical replicates/mouse. P=0.0128). Scale bars: 500 µm. g, Anti-IL1R1 treatment reverses the wound repair advantage conferred by epidermal Aim2 overexpression in naïve mice. intraperitoneal (i.p.) (n=3. Control IgG P=0.0055, α-IL1R1 P=0.0007). h, Summary of the downstream AIM2 effectors in post-inflamed skin, ASC, Apoptosis-associated speck-like protein containing a CARD. Rate calculated from wound area: b, Extended Data Fig. 6d; d, Extended Data Fig. 6e; e, Extended Data Fig. 6f; g, Extended Data Fig. 6g. Plots depict mean ± SEM. n=x biologically independent animals. Experiments a–f replicated ≥ 2 times, g was performed 1 time. Significance determined using two-tailed t-test (95% confidence). Non-significant (ns, P>0.05).
CASP1 promotes maturation and secretion of pro-inflammatory cytokines IL18 and IL1β. Indeed, post-inflamed skin displayed increases in Il18 transcription and IL18 and IL1β proteins over naïve skin (Fig. 5c). To determine if AIM2 acts through cytokine production to accelerate wound repair, we repeated our experiments with Il18 and Il1r1 null mice. Although IL18 was dispensable, without IL1R1, required for IL1β-signaling, inflammation-experienced skin failed to enhance wound repair (Fig. 5d,e and Extended Data Fig. 6e,f). Consistent with these findings, the addition of recombinant IL1β, but not IL18, enhanced keratinocyte migration from naïve skin explants (Fig. 5f). Conversely, when doxycycline-treated TRE-Aim2 mice were injected with IL1R1 blocking antibodies, their rate of wound closure was comparable to that seen in untreated, naïve control mice (Fig. 5g and Extended Data Fig. 6f). Taken together, these data point to AIM2 and its downstream effectors CASP1 and IL1β as central regulators of the heightened wound repair response seen in inflammation-experienced skin (Fig. 5h).
Discussion
Tissue adaptation to inflammation has been attributed to innate memory within macrophages and natural killer cells, and to persisting tissue resident memory T cells16, 17. Hence it was surprising to find that inflammatory memory is also an intrinsic feature of long-lived EpSCs, enabling them to respond more rapidly to a secondary assault. Sifting through the myriad of potential contributing factors offers avenues for future research. For instance, although overall skin basal cell numbers remained unchanged, distinct EpSC pools that do not participate in naïve skin responses, might become sensitized to do so by inflammation. Our current study points to a mechanistic paradigm set for memory T cells and trained innate immune cells17, 16, namely that EpSCs “remember” a primary inflammatory stimulus by maintaining certain changes to their chromosomal landscape that were induced at the time of assault. We show that these changes endow EpSCs with the ability to accelerate their response to subsequent stressors.
Most chromatin changes maintained in EpSCs after IMQ treatment were not accompanied by sustained transcription of their associated genes, nor did inflammation-induced TFs remain active. Since inflammation was necessary to render these chromatin domains accessible and yet not to maintain them once opened, the evidence implies that EpSC TFs and other chromatin modifiers present in normal homeostasis can propagate these chromatin sites made accessible during inflammation.
While underlying mechanisms are likely complex, our reporter analyses indicate that sustained open chromatin domains possess the information needed to sense tissue damage. Moreover, by remaining open long after the inflammation resolves, these sensors appear to have functional relevance in a secondary assault. Consistent with this notion, more than half the genes induced early and selectively at the wound edge of inflammation-experienced skin were associated with these sustained open chromatin domains.
The inflammasome pathway was featured prominently among these rapid responders. Our gain-and loss-of-function studies with AIM2, CASP1, IL1β and IL1R1 underscore the importance of this pathway in conferring a wound repair advantage to inflammation-experienced EpSCs. Intriguingly, intestinal epithelial cells can also sense tissue damage and they express AIM228, raising the tantalizing possibility that EpSCs in other tissues possess a similar AIM2 inflammasome-mediated memory of a primary assault.
As beneficial as it may seem to retain inflammatory memory in order to hasten barrier restoration the next time a breach occurs, heightened sensitivity to tissue damage may not always be a blessing. Genetic alterations that mobilize SCs more rapidly are often associated not only with accelerated wound repair, but also increased cancer susceptibility30. Indeed, individuals with gain-of-function mutations in inflammasome components can show increased risk of epidermal cancers31, 32. Our findings suggest that the inflammation-experienced memory in EpSCs may also underlie the recurrent skin inflammation displayed by patients with autoimmune disorders such as psoriasis and atopic dermatitis. Overall, the inflammation-induced rewiring of EpSCs that we have unearthed here is likely to have major implications for future therapeutics aimed at enhancing adaptive features and counteracting maladaptive ones.
METHODS
Animals
The following mouse strains were purchased from The Jackson Laboratory: C57BL/6J, B6.FVB-Tg(Rorc-Cre)1Litt/J (Rorc-Cre), C57BL/6-Gt(ROSA)26Sortm1(HBEGF)Awai/J B6-Rosa26iDTR33, B6.129X1-Gt(ROSA)26Sortm1(EYFP)Cos/J, B6.129P2-Aim2Gt(CSG445)Byg/J, B6.129S7-Il1r1tm1Imx/J, and B6.129P2-Il18tm1Aki/J. Tg(Rorc-EGFP)Ebe mice34 were a gift from Dr. Gerard Eberl (Institut Pasteur). Tg(Ly6a-Cre)1Isg mice35 were a gift from Dr. Isidro Sanchez-Garcia (Universidad de Salamanca). Krt14CreER8 and Krt14rtTA36 mice were previously generated in the Fuchs’ lab. Krt10CreER transgenic mice were generated by retrieving the murine Krt10 promoter region (8416bp fragment upstream of the Krt10 start codon) from bacterial artificial chromatin DNA (CHORI clone ID: RP23-336D20) and then inserting it upstream of the Beta-Globin Intron-CreER–polyA, analogous to our Krt14CreER8 transgene. All keratin promoter driven CreER mice were then each crossed to Rosa26Flox-Stop-Flox-YFP mice37. All animal studies were approved by the Institutional Animal Care and Use Committee. Mice were bred and maintained under specific-pathogen-free conditions at the AAALAC (Association for Assessment and Accreditation of Laboratory Animal Care International)-accredited Comparative Bioscience Center at the Rockefeller University and housed in accordance with the procedures outlined in the Guide for the Care and Use of Laboratory Animals. When possible, preliminary experiments were performed to determine requirements for sample size, taking into account resources available and ethical, reductionist animal use. Animal studies were not performed in a blinded fashion. Animals were assigned randomly to experimental groups. The number of animals shown in each figure is indicated in the legends as n=X mice per group.
Skin inflammation models
The dorsal skin of 8 week old mice in the telogen (resting) phase of the hair cycle were shaved with clippers and then subjected to topical application or treatment of the skin as below:
Imiquimod
Mice were treated with either ~1 mg/cm2 skin of 5% imiquimod cream (Perrigo) or control Vanicream (Pharmaceutical Specialties Inc.) for six consecutive days as previously described6.
Epidermal abrasion wounds
Mice were treated with depilatory agent Nair (Church and Dwight). A 2 cm2 area was then wounded shallowly with a rotary drill (Model 520 Dremel) as previously described11 to remove the epidermis and induce re-epithelialization of the wounded skin.
TPA
Mice were topically treated with 40 nM/3cm2 skin 12-O-tetradecanoylphorbol 13-acetate (TPA) (Sigma-Aldrich) in acetone or acetone alone daily for five consecutive days10.
MC903
Mice were topically treated with 2 nM/3cm2 skin of vitamin D analog Calcipotriol (MC903) (Tocris Bioscience) in EtOH or EtOH alone for 14 consecutive days as previously described9.
Candida albicans (Fungi) infection
Mice were infected with 106 Candida albicans (ATCC36801) as previously described12.
Lineage Tracing
At 8 weeks of age during the telogen (resting) phase of the hair cycle, mice were treated with 10 µg/ml of 4-hydroxytamoxifen (TAM) in corn oil (Sigma-Aldrich) by intraperitoneal (i.p.) injection for 3 consecutive days at the following doses: Krt14CreER;RosaYFP treated with 10 µg of TAM, and K10CreER;RosaYFP treated with 100 µg of TAM. Two days after the last tamoxifen treatment, the dorsal skin of a cohort of mice was analyzed for YFP expression by flow cytometry and immunofluorescence (Day 0 time point). Upon confirmation of YFP expression the remaining cohort mice were treated with the aforementioned IMQ regimen and analyzed at days 6, 30, and 180 post-treatment.
EdU pulse
For 5’-ethynyl-2’-deoxyuridine (EdU) pulse experiments, mice were injected intraperitoneally (50 µg/g) (Sigma-Aldrich) at specified intervals (typically 1–4 hrs) before analysis.
Punch Biopsy and Splint Wounds
The dorsal skin of mice was shaved at indicated time points after imiquimod treatment. After visually confirming that hair follicles in the shaved area were in telogen (resting) phase of the hair cycle, 6 mm biopsy punches (Miltex) were used to make full-thickness wounds. Wound closure was assessed macroscopically with an engineer's caliper daily. 3 mm wounds were splinted with 8 mm silicone splints as previously described14. Wound closure was assessed macroscopically with an engineer's caliper daily. Wound area was calculated by applying the area of an ellipse (π*r1*r2) to the two diameter measurements on the y-axis, and x-axis of the wound. One-, two- and three-phase decay model of curve fitting was performed for wound healing assays. The two- and three-phase decay analyses showed minimal contributions from second (Kslow Ctrl=0.00015 PI=0.0017) phase and generated an “ambiguous fit” error indicating wide confidence intervals and that the software (PRISM GraphPad) is unable to find a unique curve to fit the data. Therefore, wound healing rate constants were calculated using a One-Phase Decay Model (PRISM GraphPad).
Diptheria toxin administration
Mice were intraperitonially (i.p.) injected with 200 ng of Diptheria Toxin (Sigma Aldrich) twice daily for 5 consecutive days. Mice were maintained on a sulfatrim diet and 0.5 mg/ml oral fluconazole (Citron Pharma) supplemented in drinking water throughout the course of treatment and subsequent wounding experiment.
Caspase inhibitor administration
Mice were i.p. injected with 0.6 mM of Ac-YVAD-cmk (Caymon Chemicals) 29, 38 1 day prior to wounding and then daily for the first five days of the wound response.
Clodronate liposome administration
Mice were i.p. injected with either 200 µl clodronate or control liposomes (http://www.clodronateliposomes.org) 8 day prior to and then every two days until wounding.
Anti-IL1R1 administration
Mice were i.p. injected with 0.2 µg of Anti-IL1R1 antibody (JAMA-147) or Armenian Hamster Isotype control (BioXCell) 1 day prior to wounding and then daily for the first five days of the wound response.
In utero lentiviral (LV) transduction
Transductions were achieved by in utero injection of lentivirus into the amniotic sacs of E9.5 mice22. At E9.5, the surface ectoderm exists as a single layer of unspecified K14+ EpSC progenitors, which become stably transduced by LV within 24 hrs. High LV titers enable highly efficient and selective transduction of the entire embryonic skin epithelium, without affecting other skin cell types. In utero injections are non-invasive and do not alter embryonic development or elicit inflammatory responses in the skin. The DNA carried by the lentivirus is stably propagated into adulthood within the skin epithelium, including the epidermis and hair follicles. In utero LV deliveries were used for all ATAC-peak reporters and for delivery of TRE-Aim2 expression.
Doxycycline Feed Administration
Mice transduced with LV-TRE-Aim2 were placed on 2 mg/kg doxycycline feed (Bioserv) at postnatal day 53 and maintained on doxycycline diet throughout the course of wound repair.
Cell Isolation and Tissue Processing
Keratinocyte isolation was adapted from a previously described protocol39. Briefly, dorsal skin was shaved and digested using either 0.25% Trypsin/EDTA (Gibco) or Collagenase (Sigma) to obtain a single cell suspension. Immune cells from 1 cm2 pieces of skin were isolated after digestion with Liberase TM (Roche) based on an adapted protocol13. To isolate wound edge epithelial stem cells, 0.5 mm2 of skin adjacent to wound was excised and digested in collagenase.
In vitro explant migration assay
The in vitro explant migration assay was performed as previously described13. 2 mm punch biopsies (Miltex) were taken from the back skin after hair depilation. The skin was adhered to the bottom of a fibronectin-coated plate with matrigel (Corning) and cultured in 300 µM Ca2+ keratinocyte growth media made as previously described40. Explants supplemented with recombinant IL18 and IL1β (Peprotech) received 50 ng/mL of the cytokine daily. Outgrowth of Keratin 14+ cells from explants was imaged at indicated time-points using the 10X objective of a Nikon Eclipse TS100 microscope equipped with an Exfo X-Cite Series 120 and a Hamamatsu ORCA-ER Digital Camera. Images were analyzed with ImageJ software.
Flow Cytometry and Cell Sorting
Female mice were used for sorting experiments at all time points and conditions to obtain maximal cell numbers. Single cell suspensions were stained with antibodies (Extended Data Table 1) at predetermined concentrations in a 100 µl staining buffer (PBS containing 5%FBS and 1% HEPES) per 106 cells. Stained cells were re-suspended in 4’,6-diamidino-2-phenylindole (DAPI) in FACS buffer (Sigma-Aldrich) prior to analysis. Data were acquired on LSRII Analyzers (BD Biosciences) and then analyzed with FlowJo program. Fluorescence-activated cell sorting (FACS) was conducted using Aria Cell Sorters (BD Biosciences) into either staining buffer or Trizol LS (Invitrogen).
Immunofluorescence and Image Analysis
Immunofluorescence staining protocols were adapted from13. Briefly tissue was fixed in 4% paraformaldehyde in PBS for 20 min at room temperature or 4 hours at 4°C. Tissue was washed 3X with PBS and switched to 20% sucrose overnight and subsequently washed. Tissue was then embedded in OCT (Tissue Tek), frozen, cryosectioned (14–20 µm). Sections were permeabilized, blocked and stained with primary and then secondary fluorescence conjugated antibody. Nuclei were stained using 4’6’-diamidino-2-phenylindole (DAPI). EdU and TUNEL Click-It reaction were performed according to manufacturer's directions (Life Technologies). For pSTAT3 immunofluorescence, sections were fixed in methanol for 20 minutes at −20°C before primary and secondary antibody labeling. For complete list of antibodies see Extended Data Table 2. Migrating tongue was determined by measuring the length of Keratin14+ Integrin-α5+ cells. Percentage of wound-edge proliferating EpSCs was determined by counting EdU+ Keratin14+ cells per total number of Keratin17+ cells (Fig 1e, Extended Data Fig 2d). Data were analyzed using ImageJ Software.
Confocal Microscopy and Image Processing
Images were acquired with an AxioOberver.Z1 epifluorescence microscope equipped with a Hamamatsu ORCA-ER camera and an ApoTome.2 (Carl Zeiss) slider. Tiled and stitched images of sagittal sections were collected using a 20X or 40X objective, controlled by Zen software (Carl Zeiss). Maximal projection Z-stacks are presented and co-localizations were interpreted only in single Z-stacks. Z-stacks were projected using ImageJ software. RGB images were assembled in Adobe Illustrator CC2015.3.
Histology
Skin tissue was fixed in PBS containing 10% formalin, paraffin embedded, sectioned (0.8 mm) and stained with hematoxylin and eosin by Histowiz Inc. Stained slides were scanned at 40X magnification using Aperio AT2. Slides were visualized and epidermal thickness was analyzed using Aperio Image Scope software.
Gross Images
Animals were imaged using a Leica DFC310 FX fitted with a Schott Fostec Ace fiber optic light source and a Leica microscope video lens objective 0.63x no. 10447367.
RNA Purification, Quantitative PCR and RNA-Sequencing
Quantitative PCR: Individual animals were used for qPCR experiments. Total RNA was purified from either whole skin biopsies, flash frozen and then homogenized with a Bessman Tissue Pulverizer (SpectrumTM) or FACS purified keratinocyte populations using Direct-zol RNA MiniPrep kit (Zymo Research) per manufacturer’s instructions. Equal amounts of RNA were reverse-transcribed using the superscript VILO cDNA synthesis kit (Invitrogen). cDNAs for each sample were normalized to equal amounts using primers against Actb. XpressRef Universal Total RNA (Qiagen) was used as a negative control to assess FACS population purity. For complete list of qPCR primers refer to Extended Data Table 1.
RNA-seq: 3–4 animals were pooled per condition for each RNA-seq experiment. Total RNA was isolated from FACS purified keratinocyte populations using Direct-zol RNA MiniPrep kit (Zymo Research) per manufacturer’s instructions. Quality of the RNA for sequencing was determined using Agilent 2100 Bioanalyzer, all samples used had RNA integrin numbers (RIN) > 9. Poly-A selection and library preparation using Illumina TrueSeq mRNA sample preparation kit and sequencing on Illumina HiSeq 2500 or HiSeq 4000 machines was performed by Weill Cornell Medical College Genomic Core facility, 50 bp Single-end FASTQ sequences were aligned to mouse genome (GRCm38/mm10) using STAR41 and transcripts were annotated using Gencode release M9. Differential gene expression analysis was performed using DESeq2 package42 using the gene counts output from STAR read aligner42.
Ingenuity pathways analyses were performed on differentially expressed genes 12hrs post-wounding. Abbreviated pathways are presented in Fig 4e. Complete terms are as follows: Granulocyte Adhesion and Diapedesis, Inflammasome Pathway Signaling, Graft-versus-Host Disease Signaling, LXR/RXR Activation, Role of Osteoblasts, Osteoclasts and Chondrocytes in Rheumatoid Arthritis, TREM1 Signaling, Regulation of Cytokine Production in Intestinal Epithelial Cells by IL-17A/F, Hepatic Cholestasis, Allograft Rejection Signaling, Cdc42 Signaling.
ATAC-Seq
Assay was performed on 100K FACS purified cells as previously described18, 43. Briefly, cells were lysed in ATAC lysis buffer for 5 minutes and then transposed with TN5 transposase (Illumina) for 30 minutes. Samplewere barcoded and sequencing library was prepared according to manufacturer's guidelines (Illumina) and sequenced on an Illumina HiSeq 2500.
For sequencing data analysis 50 bp paired-end FASTQs were aligned to mouse genome (GRCm38/mm10) as previously described43. Correlation between replicates was measured by first calling peaks in each replicate, merging the peak sets, followed by plotting Log2 transformed signal against individual replicates. Aligned reads for the two replicates were then merged and peaks called on the merged dataset. Genomic annotation of peaks was performed using the Cis-regulatory Element Annotation System (CEAS)44.
Average ATAC signals for transcription start sites (TSS, +/− 3000 bp) and for chromatin insulator protein CTCF sites (+/− 1000 bp) were plotted for each sample CTCF sites were derived from CTCF peaks called in E14.5 C57BL/6 limb embryo from ENCODE (Accession: ENCFF001YAK) and converted to mm10 coordinates using liftOver. Average tag count is calculated by averaging the number of reads overlapping each base pair per million mapped reads. (Number of reads at each base pair)/(Total readcounts ×106). X-axis is distance from either the CTCF of TSS site.
ATAC-Seq peaks were determined algorithmically using Model-based Analysis of ChIP-Seq 2 (MACS2) algorithm with the option “--keep-dup all” to keep duplicates generated by combining experimental replicates45. Each peak is of varying size representing regions of signal enrichment over background. Shared peaks were defined as regions that had ≥ 1base pair overlap between the two datasets. Unique peaks were then defined as regions that had no overlap. Regions where signal intensity did not meet the threshold (FDR<0.01) for statistical significance over background were considered “closed”.
Z-score transformations were performed to normalize data across various samples and time points. ATAC signals per base-pair over the mouse genome (GRCm38/mm10), excluding the mitochondrial and Y chromosome, were scored and then averaged over 500 bp non-overlapping genomic windows. Background signal was then filtered out by excluding genomic windows that averaged less than 1 in any replicates. Data was clustered using Cluster 3.0 and visualized using GENE-E software46. Significantly different windows were assayed between samples by t-test (p-value < 0.05).
Sequencing data tracks were presented using University of California Santa Cruz genome browser47. Unique peaks at from day 6 and day 30 control and IMQ treated EpSCs, and overlapping peaking from day 6 and day 30 IMQ treated EpSCs were subject to ontology analysis using Genomic Regions Enrichment of Annotation Tool (GREAT)20 with whole mouse genome (GRCm38/mm10) as the background. PANTHER pathways analysis was used to compare peak-associated genes with known pathways. Abbreviated terms are presented in Fig 3d. Complete terms are as follows: Apoptosis signaling pathway, PDGF signaling pathway, Histamine H1 receptor mediated signaling pathway, Notch signaling pathway, Thyrotropin-releasing hormone receptor signaling pathway, Oxidative stress response, Oxytocin receptor mediated signaling pathway, Muscarinic acetylcholine receptor 1/3 signaling pathway, Interleukin signaling pathway, Ras Pathway, Angiotensin II signaling through G proteins and b-arrestin, PI3 kinase pathway. Motif analysis of these regions was performed using HOMER software48. Selected ontologies and MOTIFS are displayed. Values below the false positive range (1e-10 to 1e-12) calculated based on cumulative binomial distributions by this algorithm were considered statistically significant.
Peak Reporters
Genomic regions with enriched signal in post-inflamed EpSCs associated with Aim2 (Peak1 - Chr1:173,420,163–173,420,883, Peak 2 - Chr1:173,422,670–173,423,721) Armc6 (Chr8:70,221,668–70,222,912), Aoah (Chr13:20,935,623–20,936,830), and Cotl1 (Chr8:119,810,704–119,812,768) (Fig. 4c) were PCR amplified from keratinocytes genomic DNA and cloned into a pLKO-PGK-H2B-mRFP1-“Peak”-minSV40-EGFP vector3. After sequence verification individual plasmids were packaged into a lentivirus injected in utero into the amniotic sacs of E9.5 C57BL/6 embryos, as described above.
Inducible Aim2 Mice
Murine Aim2 cDNA was amplified from FACS purified EpSCs and cloned downstream of the TRE and minimal promoter of the pLKO-TRE-PGK-H2BmRFP1 vector.3 After sequence verification the plasmid was packaged into a lentivirus for in utero injection into the amniotic cavity of K14rtTA E9.5 embryos. Aim2 induction was verified by qPCR 7 days after doxycycline administration to activate rtTA, which in turn binds to the TRE element.
CASPASE 1 Fluorometric Assay and Cytokine Enzyme-linked immunosorbent assay (ELISAs)
Tissue lysates from 0.5 mm2 wound edge skin 12hrs post-injury were prepared by freeze thawing and then dissociating tissue with a tissue lyser (Qiagen). Lysates were assayed for CASP1 activity and cytokine levels. CASPASE-1/ICE flourometric assay (R&D) and IL1β (eBioscience) and IL18 (MBL international) ELISAs were performed according to manufacturer’s instructions. Tissue caspase activity is reported as units (U) based on recombinant human CASP1 (Sigma-Aldrich) standard. All assays were normalized to total protein levels in lysate as measured by Pierce™ BCA Protein Assay Kit (ThermoFisher).
Statistics
Data are presented as mean ± standard error of the mean, mean ± standard deviation, or mean ± 95% confidence interval. Group sizes were determined based on the results of preliminary experiments. Mice were assigned at random to groups. Experiments were not performed in a blinded fashion. Statistical significance for all wound healing studies was determined with the two-tailed unpaired Student’s t-test with a 95% confidence interval under the untested assumption of normality. Within each group there was an estimate of variation, and the variance between groups was similar. Statistical significance of ATAC-seq peak and peak-gene comparisons was calculated using either a Mann-Whitney test or random permutation. Significance enriched of transcription factor MOTIFs were determined by cumulative binomial distributions. Significance of Ingenuity Pathways Analysis (IPA) was determined by right-tailed fishers exact test. Statistical analysis was calculated using either Prism software (GraphPad), DESeq2, IPA, or in R.
Data Availability
All data sets generated during and/or analyzed during the current study either presented in this published article, source data and supplementary files or are available from the corresponding authors on reasonable request. Genomic data sets generated during and/or analyzed during the current study are available in the GSE92967 repository.
Extended Data
Extended Data Fig. 1. Lineage tracing of skin stem cells and progeny during and after acute skin inflammation.
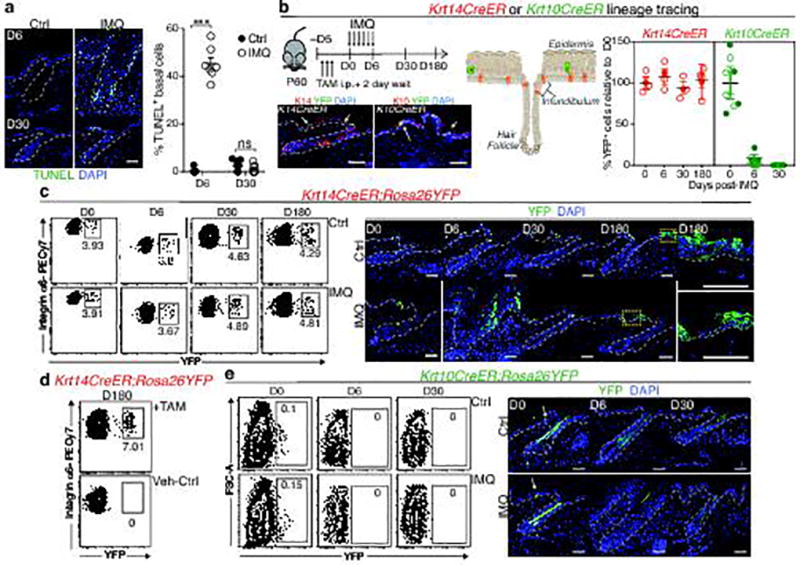
a, Epifluorescence images and corresponding quantifications of TUNEL+ basal cells at D6 of imiquimod treatment (or vehicle Ctrl) and at D30 following treatment (n=7. P<0.0001, non-significant (ns, P>0.05)). b, Schematic, immunofluorescence images, and quantifications of tamoxifen(TAM)-induced (corn oil control, Ctrl) RosaYFP reporter lineage tracing with: Krt14CreER, expressed by K14+ EpSCs and Krt10CreER, expressed by K10+ terminally differentiating cells., intraperitoneal (i.p.) (n=4. all time points P>0.05). Plots depict percentage of YFP+ cells relative to pre-imiquimod (D0) baselines (corresponding flow cytometric plots in Extended Data Fig. 1c,e). Arrows mark examples of YFP+ cells. c, Lineage tracing of Krt14CreER; RosaYFP at indicated times. Left, flow cytometric analysis of Integrin-α6+Sca1+CD34−YFP+ epidermal keratinocytes. Right, immunofluorescence of tamoxifen-activated EpSCs, lineage traced by YFP+ to include progeny (n=3). d, Flow cytometry of Krt14CreER;Rosa YFP cells from the skin epidermis of animals that were lineage traced starting from IMQ treatment and analyzed at D180 (n=2). e, Analysis of Krt10CreER;RosaYFP skins, lineage-traced beginning during IMQ or Ctrl treatment (n=3). Top, flow cytometric analysis of side YFP+ cells. Bottom, representative immunofluorescence images. All scale bars= 50 µm. Dotted lines demarcate the dermo-epidermal border. Arrows mark representative YFP+ keratinocytes; DAPI (blue), 4’,6-diamidino-2-phenylindole. All plots represent mean ± SEM. n=x biologically independent animals per group. Significance for all plots was determined using two-tailed t-test at 95% confidence interval. All experiments have been replicated ≥ 2 times.
Extended Data Fig. 2. Enhanced wound repair in post-inflamed epidermis.
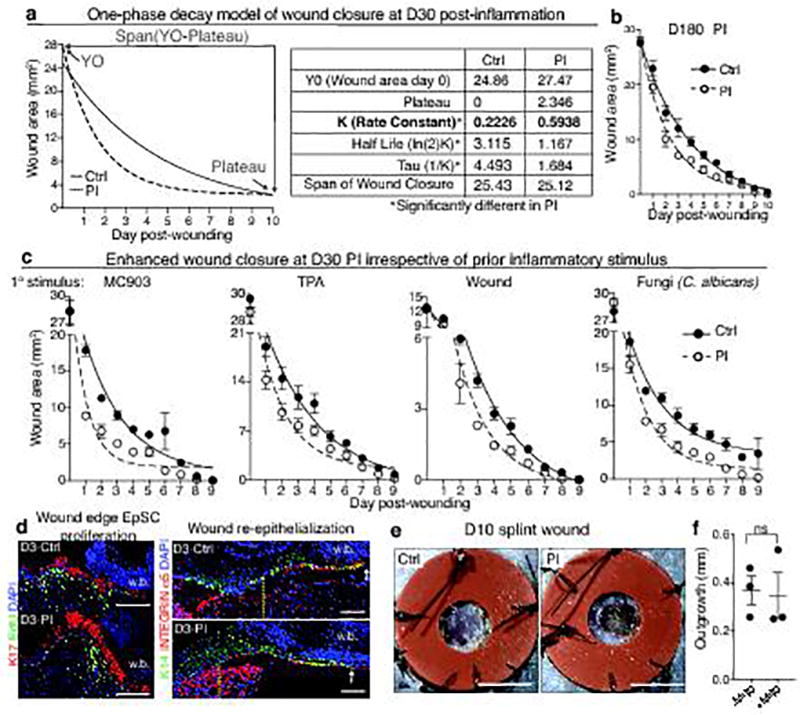
a, One phase decay modeling of wound repair in D30 inflammation-experienced (post-inflamed, PI) or vehicle treated control (Ctrl) mice (see Fig. 1b). Note: relative to two or three phase decay models (not shown), the data (shown at right) best fit this model, and was therefore used for all subsequent wound repair data. b, Temporal wound closure analysis overlaid with one phase decay analysis at D180 post-inflammation (n=3). c, Temporal wound closure analysis overlaid with one phase decay analysis of skins at D30 post-treatment with a variety of different inflammation-inducing agents: Calcipotriol (MC903), 12-O-Tetradecanoylphorbol-13-acetate (TPA), epidermal abrasion (Wound), or 106 Candida albicans infection (n=4). See Fig. 1c for rate constants. d, Immunofluorescence images of wound edge labeled with the following antibodies: anti-EdU to mark proliferating cells, anti-K17 to mark wound-sensitized keratinocytes, integrin α5 to mark the migrating wound tongue that re-epithelializes the wound bed and K14, which marks the epidermal progenitors, expanded at the wound site. Vertical dotted lines mark the initial wound edge; arrows mark the edge of the extended epithelial tongue (n=3). Wound bed (w.b.). Scale bars=100 µm. See Fig. 1e for quantifications. e, Representative images of silicone splinted 3 mm full thickness wounds from D30 Ctrl or PI animals (n=4). Scale bars=3 mm. See Fig. 1f for quantifications. f, Migration assays were performed on skin explants (see Fig. 1g), in the presence or absence of mitomycin C for 5 days under conditions that quantitatively abrogate keratinocyte cell proliferation. Note that epidermal migration rates are similar irrespective of whether cell proliferation was impaired (n=3, 3 technical replicates per animal. two-tailed t-test, P>0.05). All plots represent mean± S.E.M. For individual data points in b and c see source data. n=x biologically independent animals per group. All experiments have been replicated ≥ 2 times.
Extended Data Fig. 3. The wound-healing advantage conferred to EpSCs is confined to the site of inflammation and is occurs even when skin RORC+ cells are ablated.
a, Temporal wound closure analysis overlaid with one phase decay analysis of inflammation-experienced (PI) and vehicle control (Ctrl) skins, comparing the wound closure rates at sites distal and local to the topical application. Wound healing was initiated at D30 after IMQ treatment, a time when morphological signs of epidermal homeostasis were restored (n=3). Plot display data combined from 3 independent experiments, see rate constants in Fig. 2b. b, c, Flow cytometric analysis of total immune (CD45+) cells, αβTCR, γδTCRlow (Dermal γδT cells), Dendritic epidermal T cells (DETC), Langerhans cells (LC), dermal dendritic cells (DDC), macrophages (Mac), and eosinophils (Eos) from control and D30 post-inflamed skins. Quantifications shown at right (n≥3). d, Immunofluorescence images and quantification of T cells from RorcEGFP mice at the peak (D6) of inflammation (see Fig. 2e for post-inflammation). (n=3. P=0.0056). Arrows point to RORC+ CD3ε+ cells, thought to be the major drivers of IMQ-induced inflammation. Dotted lines demarcate dermo-epidermal borders. e, Flow cytometric analysis of frequency and cellular distribution of RORC+ cells at D30 post-inflammation (n=4 P=0.0005). Proportion of αβTCR, γδTCRlow and double negative (innate lymphoid cells) within RORC (GFP)+ gate displated adjacent to total GFP+ cell quantification. f, Depletion of RORC+ cells does not result in a compensatory increase in other skin T cell populations (n=2). g, Immunofluorescence of skin sections showing effective DT-mediated ablation of all CD3ε+RORC+ cells (yellow) in RorcCre;Rosa-LSL-iDTR (RorcDTR) mice (n=3). These mice activate DTR from the Rosa26 locus only in RORC+ cells, enabling their selective ablation. DT, diphtheria toxin; DTR, DT receptor. h, Wounds heal faster in post-inflamed skin despite ablation of skin RORC+ cells (n=3). For corresponding rate constants in e–g, see Fig. 2f. i, Despite absence of T and B lymphocytes, Rag2-null mice still mount a response to IMQ and display accelerated wound-healing after return to homeostasis at D30 PI (n=3). KO, knockout. For rate constants see Fig. 2h. Scale bar: d, 100 µm and g, 50 µm. non-significant (ns, P>0.05). All plots represent mean± S.E.M. For individual data points in a, h, and i see source data. n=x biologically independent animals per group. Significance for all plots was determined using a two-tailed t-test at 95% confidence interval. All experiments have been replicated ≥ 2 times.
Extended Data Fig. 4. Analysis of accessible chromatin in EpSCs during and after inflammation.
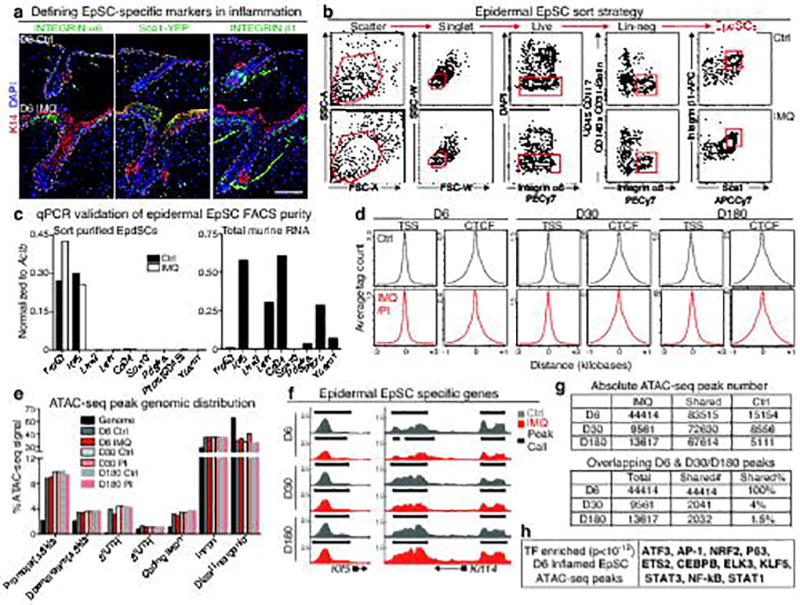
a, Immunofluorescence analysis of basal epidermal stem cell (EpSC) specific markers in inflamed and control skin. Scale bars=100 µm. b, Fluorescence activated cell sorting (FACS) strategy for isolation of EpSCs (Integrins α6+β1+Sca1+), with exclusion of CD45+, CD31+, CD117+, and CD140a+ non-epidermal cells, as well as dead (DAPI+), and doublets (side-scatter-width, SSC-Whigh and forward-scatter-width, FSC-Whigh). c, Quantitative PCR validation of EpSC purity (left) using total murine RNA as a control (right). Trp63 and Klf5 are specific for EpSCs; the others are not expressed by EpSCs (n=3 mice pooled per group). d, Density plots depicting enrichment of ATAC-seq signals at transcription start sites (TSS) ±3 kb and around CTCF factor binding sites. X-axis depicts respective distance ±1 kb from each of these domains. e, Distribution of ATAC-seq peaks within defined genomic regions. UTR, untranslated regions of predicted mRNAs. f, Genomic browser shots of peaks enriched in EpSC-specific genes Klf5 and Krt14 and unaffected by IMQ. Arrows denote direction of transcription. g, (Top) Absolute numbers of ATAC-seq peaks from D6 inflamed, D30/D180 post-inflamed, and control EpSCs. (Bottom) Numbers and frequencies of ATAC-seq peaks that are shared in D6 inflamed and either D30 or D180 post-inflamed EpSCs. h, Transcription factor motif enrichment (cumulative binomial distributions, P<10−12) within the ATAC-seq peaks of D6 inflamed EpSCs n≥3. For further details regarding this figure, see Fig. 3a–e. n=x biologically independent animals per group. All experiments have been replicated ≥ 2 times.
Extended Data Fig. 5. Enrichment of inflammasome transcripts in wound edge EpSCs of inflammation-experienced skin.

a,b, Fluorescence activated cell sorting (FACS) strategy and qPCR verification of wound-edge EpdSCs purity from skins that were either treated with IMQ or vehicle and then allowed to return to homeostasis prior to wounding at D30 (n=3 pooled mice per group). Relevant antibodies and exclusion of dead cells and doublets were described in the legend to Extended data Fig. 4. c, Matched ATAC-seq and RNA-seq analysis reveal that 91% of differentially expressed genes in D6 inflamed versus control EpSCs are associated with newly acquired ATAC-seq peaks. For further data regarding experiments in a–c, see Fig. 4c–e. d, Sustained Aim2 transcription at D30 post-inflammation in mice depleted of RORC+ cells. n=3. See also Fig. 4f. n=6 (two tailed t-test with 95% confidence interval, P=0.0028) e, Aim2-null mice do not show enhanced wound healing post-inflammation. n=3. For further data, see Fig. 4g. f, Aim2 induction in EpSCs is sufficient to augment wound healing in naïve mice. n=4. For further data, see Fig. 4h. For individual data points in e and f see source data. All plots represent mean ± SEM. KO, knockout; OE, overexpression. n=x biologically independent animals per group. Experiments a–e replicated ≥2 times, f was performed one time.
Extended Data Fig. 6. Dissecting AIM2’s downstream effectors.
a, Model depicting possible effectors downstream of AIM2. b, c, AKTSer473 expression and TUNEL labeling, respectively, in control and D30 post-inflamed wounds (n=3). d, See Fig. 5b for schematic and further data relating to the experiment. Ac-YVAD-cmk reduces re-epithelialization rates of wounded, post-inflamed skin to naïve, vehicle control levels (n=3). e, Absence of Il18 does not hamper the enhanced injury response of post-inflamed skin (n=3). For further data, see Fig. 5d. f, Absence of IL1β-signaling, achieved in Il1r1-null mice, abrogates the enhanced injury response of post-inflamed skin (n=4). For further data, see Fig. 5e. g, Anti-IL1R1 treatment reverses the wound repair advantage conferred by epidermal Aim2 overexpression in naïve mice (n=4). For further data see Fig. 5g. For individual data points in d–g see source data. KO, knockout; OE, overexpression. Scale bars = b, 100 µm and c, 50 µm. n=3. All plots represent mean ± SEM. n=x biologically independent animals per group. Experiments a–f have been replicated ≥ 2 times, g was performed one time.
Extended Data Table 1.
List of Quantitative PCR (qPCR) Primers
| Gene Name | Forward Primer | Reverse Primer |
|---|---|---|
| βactin | ccaaccgtgaaaagatgacc | accagaggcatacgggaca |
| Aim2 | caggcaattgcatctgagag | cgcctcacaaagattttcact |
| Casp1 | cccactgctgatagggtgac | gcataggtacataagaatgaactgga |
| Il1β | agttgacggaccccaaaag | agctggatgctctcatcagg |
| Il18 | caaaccttccaaatcacttcct | tccttgaagttgacgcaaga |
| Trp63 | cactctccatgccctcca | gcccaaccttgctaagaaact |
| Klf5 | gattcacaacccaaatttacctg | ctttgtataaacttttgtgcaacca |
| Lhx2 | cagcttgcgcaaaagacc | taaaaggttgcgcctgaact |
| Cd34 | gaaccgtcgcagttggag | tccaccattctccgtgtaataa |
| Sox10 | atgtcagatgggaacccaga | gtgtttggggtggttggag |
| Pdgfra | aagacctgggcaagaggaac | gaacctgtctcgatggcact |
| Ptprc(CD45) | ttcagaaaatgcaacagtgaca | ccaactgacatctttcaggtatga |
| Vcam1 | tggtgaaatggaatctgaacc | gacccagatggtggtttcc |
| Runx1 | ctccgtgctacccactcact | atgacggtgaccagagtgc |
| Lef1 | ctgaaatccccaccttctac | tgggataaacaggctgacct |
Extended Data Table 2.
List of Flow Cytometry and Immunofluorescence Antibodies
| Antibodies | Source | Identifier |
|---|---|---|
| Chicken Anti-Mouse GFP | Abcam | Cat# ab13970 |
| Rabbit Anti-Mouse Keratin 14 | Fuchs Lab | N/A |
| Rabbit Anti-Mouse Keratin 10 | Fuchs Lab | N/A |
| Rabbit Anti-Mouse Keratin 24 | Fuchs Lab | N/A |
| Rabbit Anti-Mouse Keratin 17 | Fuchs Lab | N/A |
| Guinea Pig Anti-Mouse Keratin 5 | Fuchs Lab | N/A |
| Rat Anti-Mouse MERTK clone: DS5MMER PE | eBioscience | Cat# 12-5751-80 |
| Rabbit Anti-Mouse p-Akt(S473) clone: D9E | Cell Signaling | Cat# 4060S |
| Rabbit Anti-Mouse RFP | MBL | Cat# PM005 |
| Rat Anti-Mouse CD49e (integrin-a5) clone: 5H10-27 | BD Pharmingen | Cat# 553319 |
| Rat Anti-Mouse CD3e clone: 17A2 | Biolegend | Cat# 100212 |
| Armenian Hamster Anti-Mouse gdTCR clone: GL3 | Biolegend | Cat# 1181011 |
| Armenian Hamster Anti-Mouse TCRb Clone: H57-597 PerCp/Cy5.5 | Biolegend | Cat# 109227 |
| Armenian Hamster Anti-Mouse gdTCR clone: GL3 AF647 | Biolegend | Cat# 118133 |
| Anti-Mouse CD24 Clone: M1/69 PerCP/Cy5.5 | eBiosciences | Cat# 45-0242-80 |
| Anti-Mouse CD11b-PacBlue Clone: M1/70 | Biolegend | Cat# 101223 |
| Anti-Mouse CD64-PerCP-Cy5 Clone: X54-5/7.1 | Biolegend | Cat# 139307 |
| Anti-Mouse CD11c-PECy7Clone: N418 | Biolegend | Cat# 117317 |
| Anti-Mouse I-A/I-E (MHCII) PerCp/Cy5.5 Clone: 107625 | Biolegend | Cat# 107625 |
| Rat Anti-Mouse Siglec-F Clone: E50-2440 PE | BD Pharmingen | Cat# 552128 |
| Anti-Mouse Ly6c-FITC Clone: HK1.4 | Biolegend | Cat# 128005 |
| Anti-Mouse CD34 eFluor 660 Clone: RAM34 | eBiosciences | Cat# 50-0341-82 |
| Anti-Mouse Ly-6A/E (Sca-1) Clone D7 APC/Cy7 | Biolegend | Cat# 108126 |
| Purified Anti-Human/Mouse CD49f Clone: GoH3 | Biolegend | Cat# 313602 |
| Anti Human/Mouse Cd49f PE Clone: GoH3 | eBiosciences | Cat# 12-0495-81 |
| APC/Cy7 Anti-Mouse CD45 Clone: 30-F11 | Biolegend | Cat# 103116 |
| Biotin Anti-Mouse CD45 Clone: 30-F11 | Biolegend | Cat# 103104 |
| Biotin Anti Mouse CD117 (c-kit) Clone: 2B8 | Biolegend | Cat# 105804 |
| Biotin Anti-Mouse CD140a Clone: APA5 | Biolegend | Cat# 135910 |
| Biotin Anti-Mouse CD31 Clone: 390 | Biolegend | Cat# 102404 |
| Rabbit Anti-pStat3 (Tyr705) Clone: D3A7 | Cell Signaling | Cat# 9145 |
| Anti-Mouse/Rat CD29 Clone: HMB1-1 | Biolegend | Cat# 102214 |
| Purified Anti-Mouse/Rat CD29 Clone: HMB1-1 | Biolegend | Cat# 102201 |
| FITC Streptavidin | Biolegend | Cat# 405202 |
| Donkey Anti-Rabbit AF488 conjugated secondary | Jackson ImmunoResearch | Cat# 711-545-152 |
| Donkey Anti-Rabbit AF546, conjugated secondary | Jackson ImmunoResearch | Cat# 711-165-152 |
| Donkey Anti-Rabbit AF647, conjugated secondary | Jackson ImmunoResearch | Cat# 711-605-152 |
| Donkey Anti-Rat AF488, conjugated secondary | Jackson ImmunoResearch | Cat# 712-545-150 |
| Donkey Anti-Rat AF647, conjugated secondary | Jackson ImmunoResearch | Cat# 712-605-150 |
| DyLight 594 Goat Anti-Armenian Hamster AF594, conjugated secondary antibody Clone: Poly4055 | Biolegend | Cat# 405504 |
Acknowledgments
We thank M. Nikolova, E. Wong and J. Levorse for technical assistance, and Y. Miao, I. Matos, Y. Ge, B. Keyes (Fuchs’ lab) and R.Yi (U Colorado) for discussions. FACS was conducted by Rockefeller’s Flow Cytometry Core (S. Mazel, director); ATAC-seq and RNA-seq were conducted by Rockefeller’s Genomics Core and Weill Cornell Genomics Center, respectively. E.F. is an Investigator of the Howard Hughes Medical Institute. S.N. is a Fellow supported by the Damon Runyon Cancer Research Foundation (DRG-2183-14) and L'Oreal USA For Women in Science. S.B.L. is funded by an NIH Ruth L. Kirschstein Predoctoral Fellowship (F31-AR068920-01A1). A.S. is funded by People Programme Marie Curie Actions (no629861). This study was supported by grants from the Robertson Foundation, National Psoriasis Foundation (CEN5402062), Pfizer (WI206828), and NIH (R01-AR31737).
Footnotes
Contributions: S.N, S.B.L, and E.F. conceptualized the study, designed experiments, and wrote the manuscript. S.N and S.B.L performed all animal, flow cytometry, microscopy, and genomic experiments. N.G. and A.S. analyzed the ATAC-seq and RNA-seq data sets. K.A. performed qPCR validations, cell culture experiments and cloned TRE-Aim2 overexpression construct. S.Y. assisted with culture studies and statistical analysis for wound healing studies. L.P. performed abrasion wound studies. A.K. helped design the TRE-Aim2 overexpression construct. S.C. engineered the Krt10CreER mice.
Authors declare no competing financial interests.
References
- 1.Blanpain C, Fuchs E. Plasticity of epithelial stem cells in tissue regeneration. Science. 2014;344:1242281–1242281. doi: 10.1126/science.1242281. [DOI] [PMC free article] [PubMed] [Google Scholar]
- 2.Alcolea MP, Jones PH. Lineage Analysis of Epidermal Stem Cells. Cold Spring Harbor Perspectives in Medicine. 2014;4:a015206–a015206. doi: 10.1101/cshperspect.a015206. [DOI] [PMC free article] [PubMed] [Google Scholar]
- 3.Adam RC, et al. Pioneer factors govern super-enhancer dynamics in stem cell plasticity and lineage choice. Nature. 2015;521:366–370. doi: 10.1038/nature14289. [DOI] [PMC free article] [PubMed] [Google Scholar]
- 4.Hsu Y-C, Li L, Fuchs E. Emerging interactions between skin stem cells and their niches. Nat. Med. 2014;20:847–856. doi: 10.1038/nm.3643. [DOI] [PMC free article] [PubMed] [Google Scholar]
- 5.Kanneganti T-D, et al. Bacterial RNA and small antiviral compounds activate caspase-1 through cryopyrin/Nalp3. Nature. 2006;440:233–236. doi: 10.1038/nature04517. [DOI] [PubMed] [Google Scholar]
- 6.van der Fits L, et al. Imiquimod-Induced Psoriasis-Like Skin Inflammation in Mice Is Mediated via the IL-23/IL-17 Axis. The Journal of Immunology. 2009;182:5836–5845. doi: 10.4049/jimmunol.0802999. [DOI] [PubMed] [Google Scholar]
- 7.Flutter B, Nestle FO. TLRs to cytokines: Mechanistic insights from the imiquimod mouse model of psoriasis. European Journal of Immunology. 2013;43:3138–3146. doi: 10.1002/eji.201343801. [DOI] [PubMed] [Google Scholar]
- 8.Vasioukhin V, Degenstein L, Wise B, Fuchs E. The magical touch: genome targeting in epidermal stem cells induced by tamoxifen application to mouse skin. Proc. Natl. Acad. Sci. U.S.A. 1999;96:8551–8556. doi: 10.1073/pnas.96.15.8551. [DOI] [PMC free article] [PubMed] [Google Scholar]
- 9.Li M, et al. Topical vitamin D3 and low-calcemic analogs induce thymic stromal lymphopoietin in mouse keratinocytes and trigger an atopic dermatitis. Proc. Natl. Acad. Sci. U.S.A. 2006;103:11736–11741. doi: 10.1073/pnas.0604575103. [DOI] [PMC free article] [PubMed] [Google Scholar]
- 10.Thomson CA, McColl A, Cavanagh J, Graham GJ. Peripheral inflammation is associated with remote global gene expression changes in the brain. Journal of neuroinflammation. 2014;11:73. doi: 10.1186/1742-2094-11-73. [DOI] [PMC free article] [PubMed] [Google Scholar]
- 11.Levy V, Lindon C, Zheng Y, Harfe BD, Morgan BA. Epidermal stem cells arise from the hair follicle after wounding. FASEB journal : official publication of the Federation of American Societies for Experimental Biology. 2007;21:1358–1366. doi: 10.1096/fj.06-6926com. [DOI] [PubMed] [Google Scholar]
- 12.Naik S, et al. Commensal-dendritic-cell interaction specifies a unique protective skin immune signature. Nature. 2015;520:104–108. doi: 10.1038/nature14052. [DOI] [PMC free article] [PubMed] [Google Scholar]
- 13.Keyes BE, et al. Impaired Epidermal to Dendritic T Cell Signaling Slows Wound Repair in Aged Skin. Cell. 2016;167:1323–1338.e14. doi: 10.1016/j.cell.2016.10.052. [DOI] [PMC free article] [PubMed] [Google Scholar]
- 14.Dunn L, et al. Murine model of wound healing. Journal of visualized experiments : JoVE. 2013:e50265. doi: 10.3791/50265. [DOI] [PMC free article] [PubMed] [Google Scholar]
- 15.Naik S, et al. Compartmentalized control of skin immunity by resident commensals. Science. 2012;337:1115–1119. doi: 10.1126/science.1225152. [DOI] [PMC free article] [PubMed] [Google Scholar]
- 16.Clark RA. Resident memory T cells in human health and disease. Science translational medicine. 2015;7:269rv1–269rv1. doi: 10.1126/scitranslmed.3010641. [DOI] [PMC free article] [PubMed] [Google Scholar]
- 17.Netea MG, et al. Trained immunity: A program of innate immune memory in health and disease. Science. 2016;352:aaf1098–aaf1098. doi: 10.1126/science.aaf1098. [DOI] [PMC free article] [PubMed] [Google Scholar]
- 18.Buenrostro JD, Wu B, Chang HY, Greenleaf WJ. ATAC-seq: A Method for Assaying Chromatin Accessibility Genome-Wide. John Wiley & Sons, Inc; 2001. [DOI] [PMC free article] [PubMed] [Google Scholar]
- 19.Feng J, Liu T, Qin B, Zhang Y, Liu XS. Identifying ChIP-seq enrichment using MACS. Nature Protocols. 2012;7:1728–1740. doi: 10.1038/nprot.2012.101. [DOI] [PMC free article] [PubMed] [Google Scholar]
- 20.McLean CY, et al. GREAT improves functional interpretation of cis-regulatory regions. Nature biotechnology. 2010;28:495–501. doi: 10.1038/nbt.1630. [DOI] [PMC free article] [PubMed] [Google Scholar]
- 21.Heinz S, et al. Simple combinations of lineage-determining transcription factors prime cis-regulatory elements required for macrophage and B cell identities. Molecular cell. 2010;38:576–589. doi: 10.1016/j.molcel.2010.05.004. [DOI] [PMC free article] [PubMed] [Google Scholar]
- 22.Beronja S, Livshits G, Williams S, Fuchs E. Rapid functional dissection of genetic networks via tissue-specific transduction and RNAi in mouse embryos. Nat. Med. 2010;16:821–827. doi: 10.1038/nm.2167. [DOI] [PMC free article] [PubMed] [Google Scholar]
- 23.DeYoung KL, et al. Cloning a novel member of the human interferon-inducible gene family associated with control of tumorigenicity in a model of human melanoma. Oncogene. 1997;15:453–457. doi: 10.1038/sj.onc.1201206. [DOI] [PubMed] [Google Scholar]
- 24.Man SM, Karki R, Kanneganti T-D. AIM2 inflammasome in infection, cancer, and autoimmunity: Role in DNA sensing, inflammation, and innate immunity. European Journal of Immunology. 2016;46:269–280. doi: 10.1002/eji.201545839. [DOI] [PMC free article] [PubMed] [Google Scholar]
- 25.Dombrowski Y, et al. Cytosolic DNA triggers inflammasome activation in keratinocytes in psoriatic lesions. Science translational medicine. 2011;3:82ra38–82ra38. doi: 10.1126/scitranslmed.3002001. [DOI] [PMC free article] [PubMed] [Google Scholar]
- 26.Man SM, et al. Critical Role for the DNA Sensor AIM2 in Stem Cell Proliferation and Cancer. Cell. 2015;162:45–58. doi: 10.1016/j.cell.2015.06.001. [DOI] [PMC free article] [PubMed] [Google Scholar]
- 27.Wilson JE, et al. Inflammasome-independent role of AIM2 in suppressing colon tumorigenesis via DNA-PK and Akt. Nat. Med. 2015;21:906–913. doi: 10.1038/nm.3908. [DOI] [PMC free article] [PubMed] [Google Scholar]
- 28.Hu B, et al. The DNA-sensing AIM2 inflammasome controls radiation-induced cell death and tissue injury. Science. 2016;354:765–768. doi: 10.1126/science.aaf7532. [DOI] [PMC free article] [PubMed] [Google Scholar]
- 29.Zhang F, et al. The caspase-1 inhibitor AC-YVAD-CMK attenuates acute gastric injury in mice: involvement of silencing NLRP3 inflammasome activities. Scientific reports. 2016;6:24166. doi: 10.1038/srep24166. [DOI] [PMC free article] [PubMed] [Google Scholar]
- 30.Ge Y, et al. Stem Cell Lineage Infidelity Drives Wound Repair and Cancer. Cell. 2017;169:636–650.e14. doi: 10.1016/j.cell.2017.03.042. [DOI] [PMC free article] [PubMed] [Google Scholar]
- 31.Zhong FL, et al. Germline NLRP1 Mutations Cause Skin Inflammatory and Cancer Susceptibility Syndromes via Inflammasome Activation. Cell. 2016;167:187–202.e17. doi: 10.1016/j.cell.2016.09.001. [DOI] [PubMed] [Google Scholar]
- 32.Farshchian M, et al. Tumor cell-specific AIM2 regulates growth and invasion of cutaneous squamous cell carcinoma. Oncotarget. 2017;5 doi: 10.18632/oncotarget.17573. [DOI] [PMC free article] [PubMed] [Google Scholar]
- 33.Buch T, et al. A Cre-inducible diphtheria toxin receptor mediates cell lineage ablation after toxin administration. Nature Methods. 2005;2:419–426. doi: 10.1038/nmeth762. [DOI] [PubMed] [Google Scholar]
- 34.Lochner M, et al. In vivo equilibrium of proinflammatory IL-17+ and regulatory IL-10+ Foxp3+ RORgamma t+ T cells. The Journal of experimental medicine. 2008;205:1381–1393. doi: 10.1084/jem.20080034. [DOI] [PMC free article] [PubMed] [Google Scholar]
- 35.Mainardi S, et al. Identification of cancer initiating cells in K-Ras driven lung adenocarcinoma. Proc. Natl. Acad. Sci. U.S.A. 2014;111:255–260. doi: 10.1073/pnas.1320383110. [DOI] [PMC free article] [PubMed] [Google Scholar]
- 36.Nguyen H, Rendl M, Fuchs E. Tcf3 governs stem cell features and represses cell fate determination in skin. Cell. 2006;127:171–183. doi: 10.1016/j.cell.2006.07.036. [DOI] [PubMed] [Google Scholar]
- 37.Srinivas S, et al. Cre reporter strains produced by targeted insertion of EYFP and ECFP into the ROSA26 locus. BMC developmental biology. 2001;1:4. doi: 10.1186/1471-213X-1-4. [DOI] [PMC free article] [PubMed] [Google Scholar]
- 38.Rabuffetti M, et al. Inhibition of caspase-1-like activity by Ac-Tyr-Val-Ala-Asp-chloromethyl ketone induces long-lasting neuroprotection in cerebral ischemia through apoptosis reduction and decrease of proinflammatory cytokines. J. Neurosci. 2000;20:4398–4404. doi: 10.1523/JNEUROSCI.20-12-04398.2000. [DOI] [PMC free article] [PubMed] [Google Scholar]
- 39.Nowak JA, Fuchs E. Isolation and culture of epithelial stem cells. Methods in molecular biology (Clifton, N.J.) 2009;482:215–232. doi: 10.1007/978-1-59745-060-7_14. [DOI] [PMC free article] [PubMed] [Google Scholar]
- 40.Rheinwald JG, Green H. Epidermal growth factor and the multiplication of cultured human epidermal keratinocytes. Nature. 1977;265:421–424. doi: 10.1038/265421a0. [DOI] [PubMed] [Google Scholar]
- 41.Dobin A, et al. STAR: ultrafast universal RNA-seq aligner. Bioinformatics (Oxford, England) 2013;29:15–21. doi: 10.1093/bioinformatics/bts635. [DOI] [PMC free article] [PubMed] [Google Scholar]
- 42.Love MI, Huber W, Anders S. Moderated estimation of fold change and dispersion for RNA-seq data with DESeq2. Genome Biol. 2014;15:550. doi: 10.1186/s13059-014-0550-8. [DOI] [PMC free article] [PubMed] [Google Scholar]
- 43.Buenrostro JD, Giresi PG, Zaba LC, Chang HY, Greenleaf WJ. Transposition of native chromatin for fast and sensitive epigenomic profiling of open chromatin, DNA-binding proteins and nucleosome position. Nature Methods. 2013;10:1213–1218. doi: 10.1038/nmeth.2688. [DOI] [PMC free article] [PubMed] [Google Scholar]
- 44.Shin H, Liu T, Manrai AK, Liu XS. CEAS: cis-regulatory element annotation system. Bioinformatics (Oxford, England) 2009;25:2605–2606. doi: 10.1093/bioinformatics/btp479. [DOI] [PubMed] [Google Scholar]
- 45.Zhang Y, et al. Model-based analysis of ChIP-Seq (MACS) Genome Biol. 2008;9:R137. doi: 10.1186/gb-2008-9-9-r137. [DOI] [PMC free article] [PubMed] [Google Scholar]
- 46.Eisen MB, Spellman PT, Brown PO, Botstein D. Cluster analysis and display of genome-wide expression patterns. Proc. Natl. Acad. Sci. U.S.A. 1998;95:14863–14868. doi: 10.1073/pnas.95.25.14863. [DOI] [PMC free article] [PubMed] [Google Scholar]
- 47.Speir ML, et al. The UCSC Genome Browser database: 2016 update. Nucleic acids research. 2016;44:D717–25. doi: 10.1093/nar/gkv1275. [DOI] [PMC free article] [PubMed] [Google Scholar]
- 48.Heinz S, et al. Simple combinations of lineage-determining transcription factors prime cis-regulatory elements required for macrophage and B cell identities. Molecular cell. 2010;38:576–589. doi: 10.1016/j.molcel.2010.05.004. [DOI] [PMC free article] [PubMed] [Google Scholar]
Associated Data
This section collects any data citations, data availability statements, or supplementary materials included in this article.
Data Availability Statement
All data sets generated during and/or analyzed during the current study either presented in this published article, source data and supplementary files or are available from the corresponding authors on reasonable request. Genomic data sets generated during and/or analyzed during the current study are available in the GSE92967 repository.