Summary
The fusion pore is the first crucial intermediate formed during exocytosis, yet little is known regarding the mechanisms that determine the size and kinetic properties of these transient structures1. Here, we reduced the number of available SNAREs in neurons and observed changes in transmitter release suggestive of alterations in fusion pores. To address this, we employed reconstituted fusion assays using nanodiscs to trap pores in their initial open state. Optical measurements revealed that increasing the number of SNARE complexes enhanced the rate of release from single pores, and enabled the escape of larger cargos. To determine whether this was due to changes in nascent pore size versus stability, we developed a novel approach, based on nanodiscs and planar lipid bilayer electrophysiology, that affords μsec time resolution at the single event level. Remarkably, both parameters were affected by SNARE copy number. Increasing the number of v-SNAREs per nanodisc from three to five caused a two-fold increase in pore size and decreased the rate of pore closure by more than three orders of magnitude. Moreover, trans-SNARE pairing was highly dynamic: flickering nascent pores closed upon addition of a v-SNARE fragment, revealing that the fully assembled, stable, SNARE complex does not form at this stage of exocytosis. Finally, a deletion at the base of the SNARE complex, that mimics the action of botulinum neurotoxin A, dramatically reduced fusion pore stability. In summary, trans-SNARE complexes are dynamic, and the number of SNAREs recruited to drive fusion determine fundamental properties of individual pores.
To understand how membranes fuse during exocytosis, the structure and dynamics of the first crucial intermediate, the fusion pore, must be determined1. Moreover, fusion pore properties can impact cargo release from neuroendocrine cells2, and can potentially impact aspects of synaptic transmission3,4. For example, small unstable pores would only allow the transient release of small hormones from neuroendocrine cells, and could, in principle, limit the rate of glutamate release from nerve terminals to reduce post synaptic responses during synaptic transmission3,5,6. Surprisingly little is known about the factors that determine the size and dynamics of fusion pores, but it was proposed that at least three SNARE complexes were required to hold fusion pores open and allow for efficient cargo release in a reconstituted system7. Here, we used a combination of approaches to directly determine whether the number of SNAREs that drive fusion dictate fundamental properties of nascent fusion pores, and whether trans-SNARE complexes are stable or dynamic.
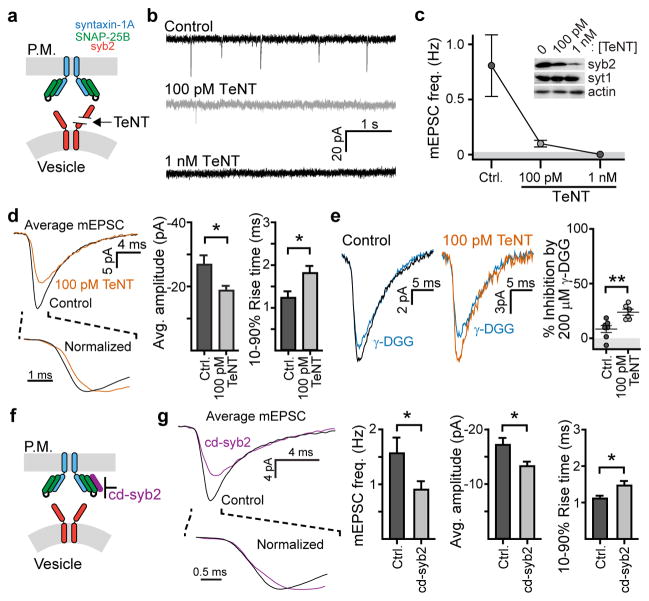
To examine how SNARE copy number influences neurotransmitter efflux from SVs, we recorded AMPAR-mediated miniature excitatory post-synaptic currents (mEPSCs) in neuronal cultures treated with tetanus toxin (TeNT)(Fig. 1a–c). Though higher doses nearly abolished mEPSCs (Fig. 1b,c), 100 pM TeNT (50% cleavage of syb2, Fig. 1c) yielded sufficient mEPSC frequencies to conduct quantitative analysis (Fig. 1b). Notably, mEPSCs remaining after TeNT had smaller amplitudes and slower rise kinetics (Fig. 1d) as compared to controls, consistent with a previous report examining miniature NMDA events6. Application of the rapidly disassociating, competitive AMPA-receptor antagonist γ-D-glutamyl-glycine (γ-DGG, 200 μM) more potently inhibited mEPSCs in TeNT treated neurons versus the control (Fig. 1e). Since inhibition by γ-DGG is inversely proportional to the [glutamate] at receptors8, these findings suggest that TeNT treatment impaired the ability of glutamate to escape SVs into the synaptic cleft. We further tested this hypothesis by overexpressing the cytosolic domain of synaptobrevin-2 (cd-syb2), which binds native t-SNAREs to inhibit trans-SNARE complex formation (Fig. 1f, g and Extended Data Fig. 1). Neuronal cultures expressing cd-syb2 had fewer mEPSCs that were, again, smaller in amplitude and slower to rise. Together, these experiments suggest that the abundance of trans-SNARE pairs might modulate the efflux of glutamate through fusion pores.
Figure 1. Reducing v- or t-SNARE availability alters the shape of mEPSCs.
a, Cleavage of syb2 by TeNT. b–c, Representative traces (b) and (c) quantification of mEPSC frequency after treatment with TeNT (Ctrl: 0.81 ± 0.28 Hz [0.18, 1.44], n = 10; 100 pM TeNT: 0.10 ± 0.02 Hz [0.04, 0.17], n = 10; p < 0.001, Kruskal-Wallis test; p = 0.001 for Ctrl vs 100 pM, Dunn’s multiple comparison post-hoc test). Inset in panel (c): immunoblot of syb2, β-actin and synaptotagmin 1 (syt1) in control and TeNT treated neurons. Similar results were obtained in three independent trials. d, Averaged mEPSC traces after treatment with TeNT (left); amplitudes (Ctrl: −27 ± 3 pA [−20, −33], n = 10 neurons; 100 pM TeNT: −19 ± 2 pA [−15, −22], n = 10 neurons; p = 0.021, two-tailed t-test) and 10–90% rise times are plotted on the right (Ctrl: 1.2 ± 0.2 milliseconds (ms) [0.9, 1.6 ms], n = 10 neurons; 100 pM TeNT: 1.8 ± 0.2 ms [1.3, 2.2], n = 10 neurons; p = 0.020, two-tailed t-test). e, Averaged traces (left) and quantification (right) of γ-DGG mediated inhibition of mEPSCs. (Ctrl: 8 ± 3% reduction in amplitude [1, 16], n = 7 neurons; 100 pM TeNT: 23 ± 3% inhibition [17, 31], n = 6 neurons; p = 0.005, two-tailed Mann-Whitney test). a–e, Experiments were performed using one coverslip from each of 3 independent litters of mice. f, Cd-syb2 occupies t-SNAREs to inhibit fusion. g, Averaged mEPSC traces (left); frequencies, amplitudes, and rise times are plotted on the right (Ctrl: 1.6 ± 0.3 Hz [1.0, 2.1] / −17 ± 1 pA [−15, −20] / 1.1 ± 0.1 ms [0.9, 1.3], n = 19; cd-syb2: 0.9 ± 0.2 Hz [0.6, 1.2] / −13 ± 1 pA [−12, −15] / 1.4 ± 0.1 ms [1.2, 1.7], n = 21; p = 0.049 -freq., two-tailed Mann-Whitney test; p = 0.017 -amp., Welch’s two-tailed t-test; p = 0.021 -rise, Welch’s two-tailed t-test). f–g, experiments were performed using 2 litters, 2 coverslips per litter. * denotes p < 0.05 and ** denotes p < 0.01. All data are presented as mean ± s.e.m.. [95% C.I.].
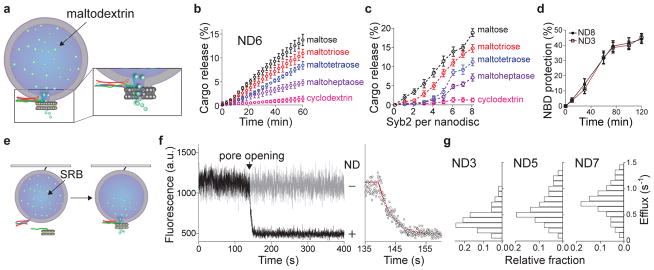
To directly test this hypothesis, we devised an in vitro assay to probe pores using cargos of different sizes. As shown previously, fusion between small unilamellar vesicles (SUV) and 13 nm NDs results in pores that cannot, due to the rigid framework of the ND, dilate, thus enabling the biochemical characterization of pores in their initial open state7,9. A variety of maltodextrins were encapsulated in t-SNARE SUVs and incubated with v-SNARE-bearing NDs that harbor one to eight copies of syb2, designated ND1-ND8. Cargo flux through fusion pores was monitored using an optical sensor that recognizes each of the maltodextrins utilized (Fig. 2a–c, Extended Data Fig. 2a, b). Using a fixed number of SNAREs (ND6), the rank order of cargo release rates correlated with cargo size (Fig. 2b): the smaller the cargo, the faster it escaped through fusion pores. As the number of SNAREs per fusion reaction were increased from one to eight, the rate of efflux of each maltodextrin (except for cyclodextrin) was concomitantly enhanced, and larger cargos were able to escape (Fig. 2c; pore size estimates are provided in Extended Data Fig. 2c, d). Using a dithionite quenching assay, we found that the number of SNAREs did not influence the total number of open fusion pores formed (Fig. 2d and Extended Data Fig. 2e). Together, these data reveal that SNARE copy number determines the size and/or kinetic stability of individual fusion pores; these findings were confirmed using single-vesicle fusion assays (Fig. 2e–g and Extended Data Fig. 2f, g).
Figure 2. Reconstituted fusion assays reveal changes in cargo efflux rates as a function of syb2 copy number.
a, Ensemble fusion assay using NDs and SUVs b, Release time courses of different maltodextrins, using ND6. c, Maltodextrin release efficiency versus the syb2 copy number per ND. d, Dithionite quenching of NBD labeled lipid revealed that the number of open pores was the same for ND3 and ND8. The values plotted in panels (b–d) represent mean ± s.d. (n = 3 independent experiments). e, Illustration of single-vesicle fusion assays. f, Representative trace showing SRB efflux through a single fusion pore (left); expanded time scale, fitted with a single exponential (red) function, is shown on the right. Similar results were obtained in four independent experiments. g, SRB efflux rates using ND3, ND5, and ND7; n values were 54, 51, and 53 respectively, obtained from four independent trials under each condition.
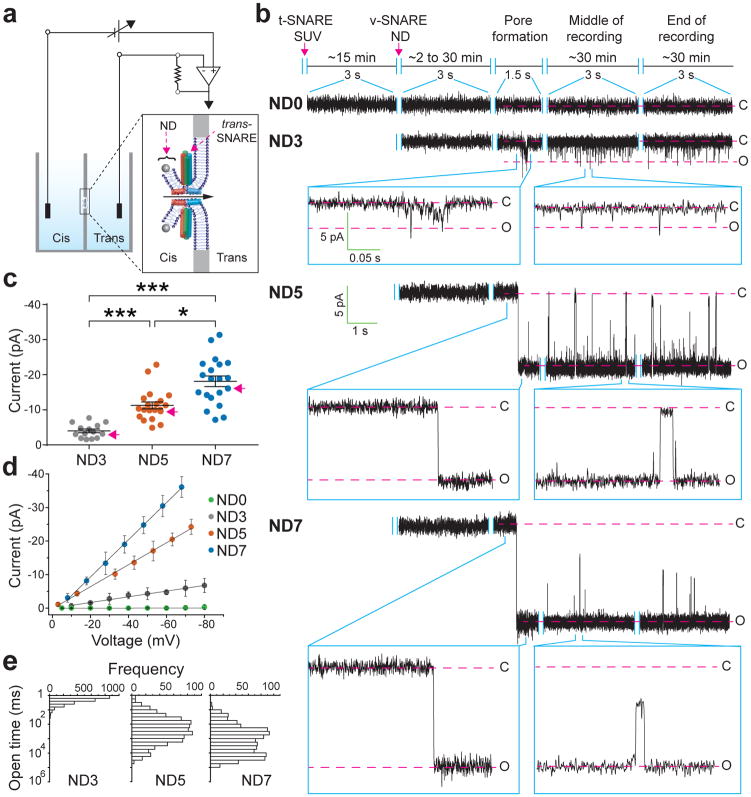
To achieve sub-msec time resolution, we developed a new approach to monitor recombinant fusion pores electrophysiologically. t-SNAREs were reconstituted into black lipid membranes (BLM), at a density of 0.4 molecules/μm2 (Extended Data Fig. 3c, d) in a planar lipid bilayer electrophysiology setup10 (Fig. 3, Extended Data Fig. 3a, b, e and 4). Addition of v-SNARE-bearing NDs into the cis chamber resulted in the formation of single fusion pores, as evidenced by the currents detected (Fig. 3a, b). Control experiments establish that these are bona fide fusion pores that result from trans-SNARE pairing (Extended Data Table 1). Remarkable differences among pores formed by ND3, ND5 and ND7 (Fig. 3b–e) were observed. At −50 mV, ND3 produced pores that remained closed most of the time and flickered open only transiently (Fig 3b, ND3). In sharp contrast, pores formed by ND5 remained open most of the time, but transiently closed (Fig 3b, ND5). Finally, ND7 pores remained open during the entire recording period; these pores flickered but never closed completely (Fig. 3b, ND7). To estimate pore size, we generated I–V plots (Fig. 3d). From the conductance values, the estimated diameters for pores formed using ND3, 5 and 7 were: 1.1 ± 0.3 nm, 2.2 ± 0.3 nm, 2.9 ± 0.3 nm, respectively, which are consistent with the range of pore sizes observed using NDs and ‘flipped’ t-SNAREs on the surface of cells11. We made similar observations using 50 nm NDs (Extended Data Fig. 5).
Figure 3. Properties of single fusion pores measured via planar lipid bilayer electrophysiology.
a, Illustration of the ND-BLM assay. b, Traces of single pores at ΔΨ = −50 mV for ND0, ND3, ND5, and ND7 are shown. Closed (C) and open (O) states are indicated, along with the respective currents. c, Pore currents obtained using the indicated ND; red arrows indicate representative pores shown in panel (b). ND3: −4 ± 1 pA [−3, −5 pA], ND5: −11 ± 1 pA [−9, −13 pA], ND7: −18 ± 2 pA [−15, −21 pA]; p < 0.001, Kruskal-Wallis test; p < 0.001 ND3 vs. ND5, p < 0.001 ND3 vs. ND7, p = 0.036 ND5 vs. ND7, Dunn’s multiple comparison post-hoc tests. Data in (c) are presented as mean ± s.e.m.. [95% C.I.]. d, Current (I, in pA) versus voltage (V, in millivolt) relationships for pores formed using the indicated ND. Data are presented as mean ± s.e.m.. e, Open dwell time histograms of pores. n = 14, 20 and 20 independent BLMs for ND3, ND5, and ND7 respectively, and 5 different sets of NDs of each type were used. *** indicates p<0.001 and * indicates p = 0.05.
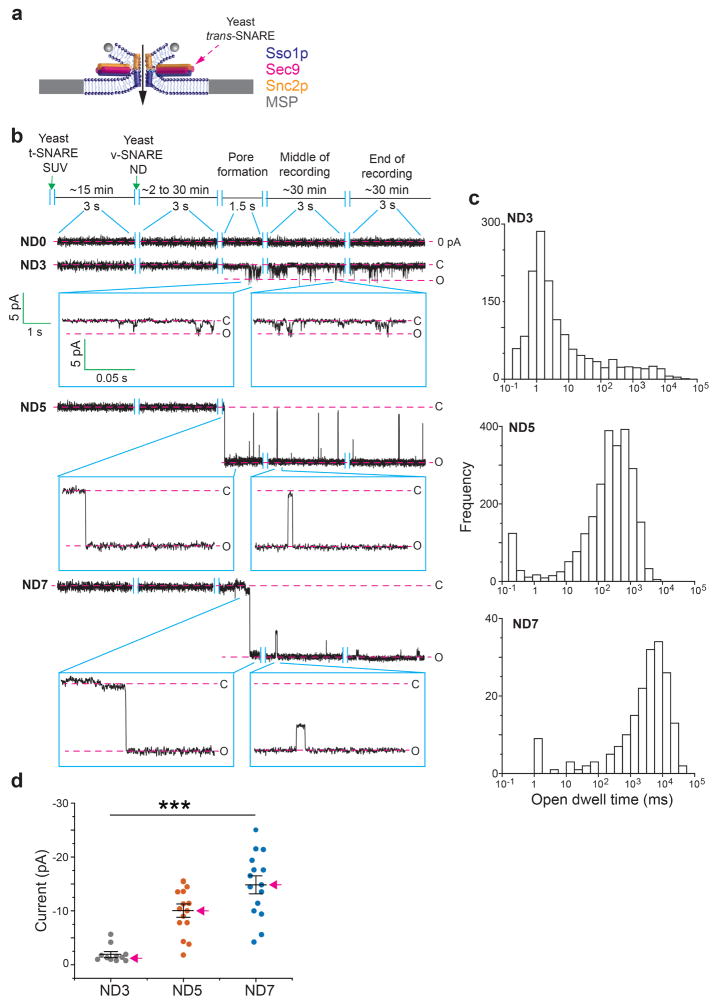
Kinetic analysis revealed differences in the open dwell time distribution between ND3 and ND5/7 (Fig. 3e): increasing the number of SNAREs profoundly enhanced the stability of the open state (Extended Data Table 2). Moreover, even though the kinetic stability of pores formed using ND5 and ND7 were similar, pore size still increased at the higher copy number. So, the size and dynamics of individual pores are differentially regulated by SNARE copy number. Similar results were obtained using yeast SNAREs12, establishing the generality of these findings (Extended Data Fig. 6 and Table 2)
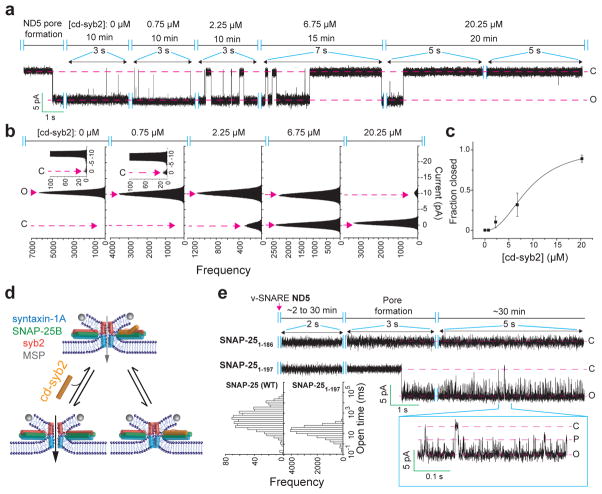
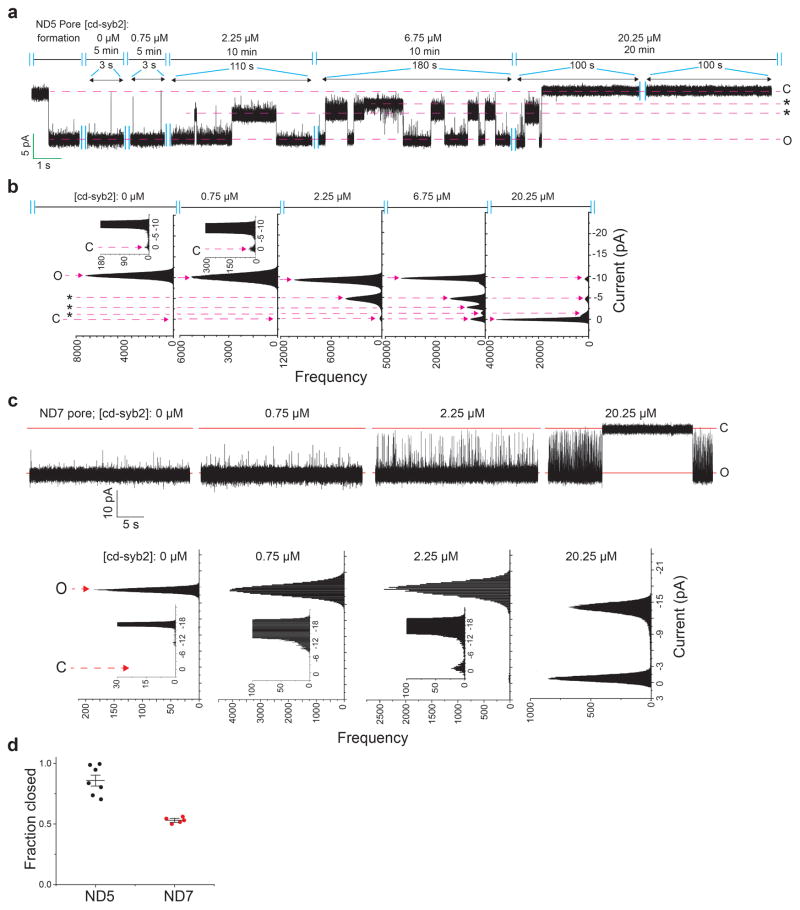
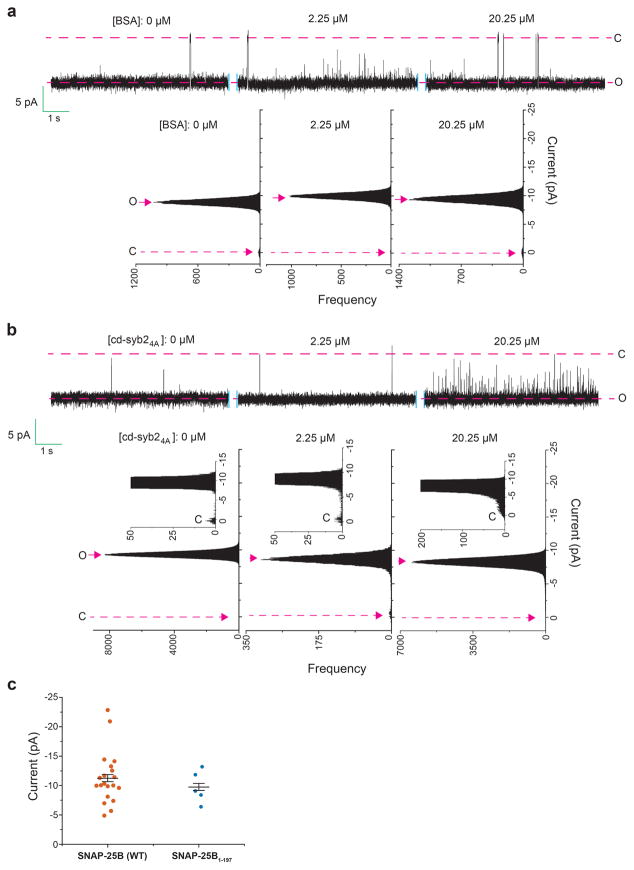
Since the ND-BLM recordings revealed that recombinant fusion pores, under all conditions measured, rapidly interconvert between open and at least partially closed states, we hypothesize that the underlying trans-SNARE complexes exist in metastable conformational states. To test this, we titrated cd-syb2 onto pre-formed pores assembled using ND5 (Fig. 4a–d). Pores were initially destabilized, and at the highest dose all pores eventually closed (Fig. 4a–c; we note that at lower doses of cd-syb2, partial closure was sometimes observed (Extended Data Fig. 7a, b). Addition of cd-syb2 also closed fusion pores formed using ND7, albeit with reduced potency (Extended Data Fig. 7c, d). In control experiments, BSA had no effect on pores and cd-syb24A, a mutant with impaired t-SNARE binding activity13, had only limited effects at the highest dose tested (Extended Data Fig. 8a, b). Together, these findings demonstrate that in contrast to cis-SNARE complexes, which are highly stable14, trans-SNARE interactions are dynamic and potentially reversible, even after pores have opened (Fig. 4d). In line with this conclusion, impaired trans-SNARE interactions, via a C-terminal truncation of SNAP-25B (1-197) that mimics cleavage by botulinum neurotoxin A, results in a marked increase in flickering behavior without affecting pore size (Fig. 4e and Extended Data Fig. 8c). Further truncation of twenty residues (1-186) completely abolished pore formation (Fig.4e). These data indicate that trans-SNARE interactions, at the base of the SNARE complex, control pore dynamics.
Figure 4. Trans-SNARE complexes are dynamic.
a–b, Representative recording (a) and current histogram (b) of a pore formed using ND5, before and after addition of cd-syb2 at the indicated concentrations. c, Fraction of time that pores are fully closed, plotted as a function of [cd-syb2]. n = 11 independent BLMs, and 5 different sets of NDs. Data are presented as mean ± s.e.m.. d, Illustration of dynamic trans-SNARE pairing, as evidenced by cd-syb2 (purple) mediated destabilization of open pores. e, ND-BLM assays were performed using ND5 and the indicated SNAP-25B mutants; open dwell time histograms are shown. SNAP-25B1-197 gave rise to partial conductances, denoted P. n = 5 independent BLMs for each mutant, using 3 different sets of NDs.
In summary, the exocytotic fusion pore corresponds to the initial, narrow channel formed between secretory vesicles and plasma membrane. Release of neurotransmitters and hormones occurs via diffusion through this transient structure before, or even without, dilation3. Previous electrophysiological measurements revealed a range of pore sizes15,16, as well as flickering behavior17,18, in cells; these observations are recapitulated in the ND-BLM system described here. Our results provide direct experimental support for the idea that a certain number of SNAREs are needed to hold fusion pores open7, with more SNAREs resulting in larger fusion pores19. Moreover, even after fusion pores have opened, trans-SNARE complexes remain dynamic and reversible. It is now essential to determine how far a fusion pore must dilate in order for the SNARE complex to become irreversible, and to ascertain the impact of myriad regulatory factors on the properties of individual pores20,21. Finally, it will also be interesting to determine whether the findings concerning SNARE copy number reported here apply to other cellular fusogens22, including atlastin (homotypic ER fusion23), mitofusin 1 and 2 (mitochondria fusion24), and the proteins that mediate ectoplasmic fusion25.
Methods
Reagents
1,2-dioleoyl-sn-glycero-3-phosphoethanolamine-N-(biotinyl) (biotin-PE), 1-palmitoyl-2-oleoyl-sn-glycero-3-phosphocholine (PC), 1,2-dioleoyl-sn-glycero-3-phospho-l-serine (PS), 1,2-dioleoyl-sn-glycero-3-phosphoethanolamine (PE), 2-dioleoyl-sn-glycero-3-phospho-(1′-rac-glycerol) (PG) 1,2-dioleoyl-sn-glycero-3-phosphoethanolamine-N-(7-nitro-2-1,3-benzoxadiazol-4-yl) (NBD-PE), and 1,2-dioleoyl-sn-glycero-3-phosphoethanolamine-N-(lissamine rhodamine B sulfonyl) (rhodamine-PE) were purchased from Avanti Polar Lipids. γ-DGG was obtained from Abcam. All other chemicals were from Sigma.
Cell Culture and Lentivirus
Cultured rat cortical neurons were prepared from embryonic day 18–19 Sprague Dawley rats as previously described26. Briefly, neurons were plated on poly-D-lysine-coated glass coverslips (12 mm) at a density of 100,000 / cm2. Neurons were cultured in Neurobasal A medium (Gibco) supplemented with B-27 (2%, Gibco) and GlutaMAX (2 mM, Gibco) and maintained at 37°C in a 5% CO2 humidified incubator. On day-in-vitro 13 or 14, half of the neuronal coverslips were treated with tetanus toxin (TeNT; 1 nM or 100 pM) (List Biological Labs, Inc.) at 37°C for 24 hours. Untreated neurons were used as controls. Electrophysiological recordings of both treated and untreated neurons were performed immediately following the 24-hour treatment period (day-in-vitro 14–15). All procedures were approved by the Animal Care and Use Committee at the University of Wisconsin and performed in accordance with the guidelines of the National Institutes of Health.
For the viral expression experiments, DNA sequences encoding either cd-syb2 (aa1-95 of synaptobrevin-2) or GFP were subcloned into a FUGW transfer plasmid modified with a synapsin promoter and an IRES-expressed soluble GFP marker. Lentivirus particles were generated by co-transfection of the transfer plasmid and helper plasmids (pCD/NL-BH*ΔΔΔ and VSV-G encoding pLTR-G) into HEK293T/17 cells27. The supernatant was collected after 48–72 hours of expression, filtered through a 0.45 μm PVDF filter, and concentrated by ultracentrifugation at 110,000 x g for 2 hrs. Viral particles were re-suspended in Ca2+/Mg2+-free PBS and used to infect neurons at day-in-vitro 6. Electrophysiological recordings were then performed at day-in-vitro 14–15.
Immunocytochemistry
At 14 DIV, cell cultures were fixed for 15 minutes with 4% paraformaldehyde (wt/vol) in PBS, permeabilized for 10 minutes with 0.2% saponin (wt/vol), and blocked for 60 minutes with 10% goat serum (vol/vol, Abcam) plus 0.1% Tween-20 (vol/vol). Coverslips were then incubated with primary antibodies (anti-GFP: Abcam, 1:1000, chicken; anti-MAP2: EMD, 1:1000, mouse) at room temperature for one hour. Samples were washed three times with 0.02% saponin (wt/vol) in PBS and labeled with Alexa Fluor 488-tagged anti-chicken and Alexa Fluor 546-tagged anti-mouse IgG for 1 hour at room temperature (Invitrogen, 1:400 dilution). Samples were again washed three times and mounted in Fluoromount G mounting medium (SouthernBiotech). Images were obtained using an FV1000 laser-scanning confocal microscope (Olympus) with FV10-ASW 3.1 acquisition software, using a 20x/1.0 NA water objective, under identical laser and gain settings. Images were analyzed using ImageJ (NIH).
Protein purification and reconstitution
Membrane scaffold protein (MSP) for 13 nm9 and 50 nm28 NDs, the maltose sensor29, neuronal (rat syb2, syntaxin-1A and SNAP-25B) and yeast (Snc2p, Sso1p and Sec9c (residues 401-651)) SNAREs, were purified as described previously12. T-SNARE complexes bearing truncated SNAP-25B (corresponding to residues 1-197 and residues 1-186) were also prepared and studied; the former truncation mimics cleavage by botulinum neurotoxin A30. To prepare t-SNARE vesicles, lipids (10% PE, 15% PS and 75% PC) and the t-SNARE heterodimer were incubated with the respective cargoes and 2% OG on ice for 30 min. Detergent was removed by addition of Biobeads (Bio-Rad) (1/3 volume) followed by gentle shaking (4°C, overnight). The mixture was extruded through 0.2 μM filter and the t-SNARE vesicles were purified by passing through a PD10 column (5 ml) equilibrated in reconstitution buffer (25 mM HEPES, pH 7.5, 100 mM KCl, 1 mM DTT). Finally, purified t-SNARE vesicles were dialyzed against reconstitution buffer (4°C, overnight). Reconstitution of syb2 into 13 nm NDs was performed as described9. For reconstitution of syb2 into 50 nm NDs, the MSP/lipid ratio was 2:4000. To incorporate different copy numbers of syb2 into 50 nm NDs, the following MSP/syb2 ratios were used: 2:2 (ND3), 2:4 (ND5) and 2:10 (ND7). The reconstituted NDs were incubated with Ni2+-NTA resin to remove syb2-free NDs. NDs containing syb2 were eluted by reconstitution buffer with 0.4M imidazole. The NDs were further purified via sucrose density gradient centrifugation31, followed by dialysis against reconstitution buffer (4°C, overnight). The copy number of syb2 per ND refers to the total number of syb2 molecules, not the number of copies per face of the ND.
Ensemble fusion assays
Maltodextrin release assays were carried out using the maltose sensor (1 μM)29, syb2 NDs (0.2 μM), and t-SNARE vesicles (1 μM) containing maltodextrins, at 37 °C in reconstitution buffer. The fluorescence of the sensor was monitored for 1 hr using a plate reader (HT synergy; BioTek). After each run, melittin (1 μM) was added to each sample, and data were collected for another 30 min. Melittin forms channels to release all the maltodextrin from each vesicle, thus producing the maximal fluorescence signal (100%) that can be obtained. Data were collected from three independent experiments.
Efflux rates were used to estimate fusion pore size. As described previously7, the time it takes for a single cargo molecule to traverse the fusion pore is: , where θ is the frequency of collisions of the cargo molecule with the membrane that forms the t-SNARE vesicle, and R, rp, and rc are the radii of the liposome, fusion pore, and cargo, respectively. Thus, the difference in the release rates between maltose and maltotetraose is given by: , where Kmaltose and Kmaltotetraose are the respective release rates for these sugars, and rmaltose (0.35 nm) and rmaltotetraose (0.42 nm) are their radii as determined by molecular dynamics simulations.
Molecular dynamics simulations to estimate maltodextrin size
All calculations used the program CHARMM32 and dynamics calculations were conducted through the CHARMM interface with OpenMM33. The sugars were treated with the CHARMM glycan force field34,35 and water was treated with the TIP3P model36. Initial structures for the sugars were obtained from the online tool SWEET37. The online tool CHARMM-GUI38,39 was used to construct the initial setup for each sugar. The sugars were each dissolved in a cubic box of water such that the nearest edge of the box was at least 10 Å away. After a brief geometry optimization, the systems were heated to 298 °K (150 ps), followed by a 1 ns equilibration at 298 °K and 1 atm using periodic boundary conditions. The simulations employed the NPT ensemble using the Andersen thermostat and MC barostat. Non-bonded interactions were cutoff above a distance of 12 Å with a switching function from 10 Å to 12 Å and the integration time step was 1 fs. Following equilibration, 10 ns production runs were used to determine the principal axes shown in the Extended Data Fig. 4.
Single vesicle fusion assays
A prism-based TIRF setup and associated flow chambers were prepared as described previously40. t-SNARE vesicles containing SRB were prepared and immobilized on the surface of quartz slides as described40. The efficiency trapping of SRB in vesicles was ~2% of the total SRB and the [SRB] was ~1 mM per vesicle. Syb2 NDs (100 μl, 50 nM) were injected at the indicated time for 10 sec and data were recorded for an additional 400 sec. Leakage and photobleaching of SRB were negligible (<7% fluorescence decrease). In contrast, opening of fusion pores leads fluorescence decreases that were >50%. Fusion probability was defined as the fraction of tethered SUVs in which a pore opening event was observed.
Planar lipid bilayer electrophysiology
In the main figures, planar lipid bilayer recordings were performed using a Planar Lipid Bilayer Workstation (BLM) from Warner Instruments (USA)10 as described41. Briefly, lipids (75% PE and 25% PG, at 30 mg/ml in n-decane) were first painted onto a 150-μm aperture in a 1 ml, white Delrin cup (Warner Instruments), allowed to dry for 15 minutes, and then the aperture was bathed in 1 ml of 25 mM HEPES, pH 7.5 and 100 mM KCl. The lipid solution was gently reapplied to the hole until a conductance-blocking seal was formed, as determined by capacitance measurements. This process was repeated, either with a brush or air bubble, until the desired capacitance was achieved. Syntaxin-1A/SNAP-25B proteoliposomes (75% PE and 25% PG) were then added to the cis chamber of the apparatus; these spontaneously fuse with the planar bilayer, thus depositing the t-SNAREs into the BLM. Then, to form fusion pores, v-SNARE NDs were added to the cis chamber. Pores form within 2–30 min., and flicker open or stay open/flicker closed for >90 min. Currents were recorded using Bilayer Clamp Amplifier BC-535 (Warner Instrument) and a Digidata 1550B (with Humsilencer) acquisition system (Molecular Devices Corp.). Single-channel recordings were sampled at 10 kHz using pCLAMP10 software (Molecular Devices, LLC.), and filtered at 5kHz using a multisection Bessel filter. Δψ ≡ ψcis ψtrans (ψtrans ≡ 0 V). All single channel data were analyzed using Clampfit 10.7 (Molecular Devices, LLC.) and MS Origin 2016 (OriginLab, USA). Histograms of background currents were well fitted by a single Gaussian (centered around 0 pA), whereas current histograms of open fusion pores required a multiple Gaussian model (with the center of the additional Gaussian representing the mean pore current). In all figures showing BLM recordings, the representative traces were filtered at 1kHz for display purposes.
For the experiments reported in Extended Data Table 1, planar lipid bilayer recordings were carried out using the Orbit Mini system (Nanion Techologies, Munich, Germany). Membranes were painted onto a MECA chip (Nanion Techologies, Munich, Germany), and fusion pores were formed and analyzed as described above, except that data were low-pass filtered at 2 kHz.The fraction of closed pores (Fig. 4) was calculated using the equation:
, from a 10 min recording at the indicated [cd-syb2].
Pore diameters were calculated using the equation , where γ is the pore conductance of, r is the radius, l is the thickness of the bilayer (10 nm; assuming the pore is a cylinder that spans both the vesicle and target membrane), and ρ is the resistivity of the buffer (100 Ω·cm).
Stopped-flow measurements
Equal volumes of the maltose sensor (0.1 μM) and maltodextrins (indicated concentrations) were mixed in an SX.18MV stopped-flow spectrometer (Applied Photophysics, Surrey, U.K.). The samples were excited at 480 nm and the emission was collected at 520 nm using 10 nm bandpass filter. Data were obtained from three independent experiments.
Electrophysiology
Whole-cell voltage-clamp recordings were made using a Multiclamp 700B amplifier (Molecular Devices). Recordings were carried out at room temperature in a bath solution containing (in mM): 128 NaCl, 5 KCl, 2 CaCl2, 1 MgCl2, 30 D-glucose and 25 HEPES, pH 7.3 and 305 mOsm. Patch pipettes (3 – 5 MΩ) were pulled from borosilicate glass (Sutter Instruments). The pipette internal solution contained (in mM): 130 K-Gluconate, 1 EGTA, 10 HEPES, 2 ATP, 0.3 GTP, and 5 sodium phosphocreatine, pH 7.35 and 275 mOsm. Data were acquired using a Digidata 1440A (Molecular Devices) and Clampex 10 software (Molecular Devices) at 10 kHz. Neurons were held at −70 mV. Series resistance was compensated and recordings were discarded if the access resistance rose above 15 MΩ at any point. AMPA-receptors were pharmacologically isolated with D-AP5 (50 μM, Abcam) and picrotoxin (100 μM, Abcam). For mEPSC recordings, tetrodotoxin (TTX, 1 μM, Abcam) was included in the bath solution. In some experiments, neurotransmitter release was evoked by a single stimulus using a concentric bipolar electrode (FHC, 125/50 μm extended tip). Stimulating electrodes were placed ~100–200 μm from the soma being recorded and stimulation currents (0.4 – 0.7 mA) were adjusted per recording to measure the maximum field-evoked current. For these evoked recordings, the pipette internal solution was modified to include 130 mμ KCl (replacing K-Gluconate) and 5 mμ QX-314 chloride (Tocris) and the bath solution was modified to include CNQX (10 μM, Abcam) instead of picrotoxin. Traces were analyzed using Clampfit 10 (Molecular Devices).
We note that the two sets of experiments reported in Fig. 1, panels a–e and panels f–g, were conducted at different times using independent materials, resulting in slightly different values for mini frequency and amplitudes, with no significant effect on kinetics.
Other methods
SDS-PAGE, western blot, fluorescence spectroscopy, and dithionite quenching assays were performed as described previously7,9.
Data Availability
All original data will be made available by the corresponding authors upon reasonable request. For gel source data, see Supplementary Fig. 1. Source data for Fig. 2b–d is available online
Extended Data
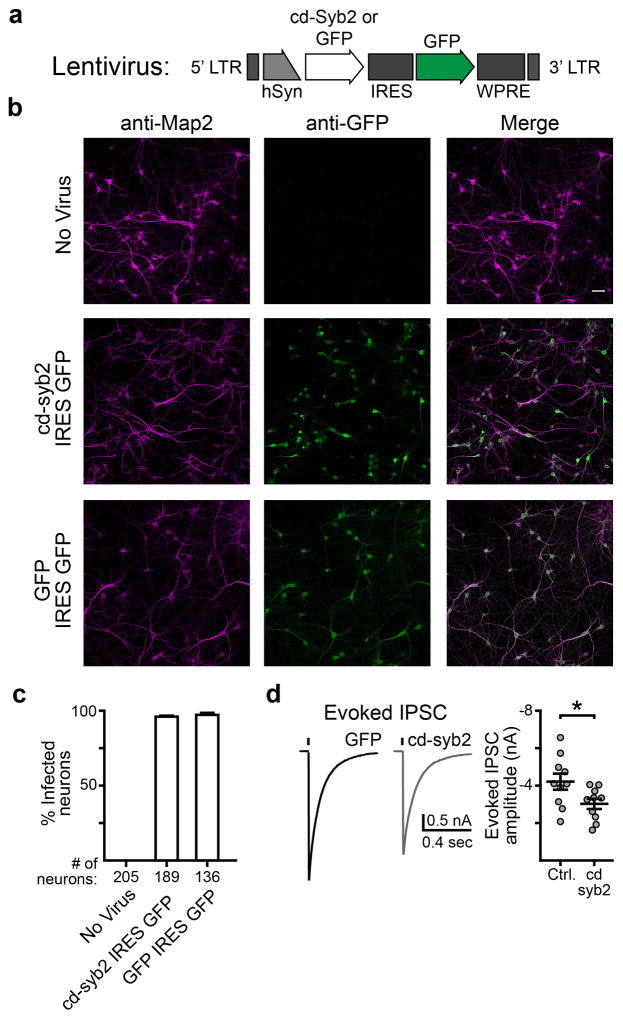
Extended Data Figure 1. Viral expression of cd-syb2.
a, cDNA encoding the cytosolic domain of synaptobrevin 2 (cd-syb2, residues 1-95) was cloned into a FUGW transfer vector modified to have a synapsin promoter and to co-express soluble eGFP via an IRES sequence; eGFP serves as a marker for infection efficiency. For control experiments, eGFP alone was expressed. Both constructs were packaged into lentivirus for expression in neuronal cultures. b, Representative images of cells stained for a neuronal marker (MAP2, magenta) and GFP (green). Images were adjusted for brightness and contrast for the sake of presentation. Both preparations used for Fig. 1g were examined and had similar GFP expression levels and coverage across cells. The scale bar (50 μm) applies to all nine images shown. c, Quantification of the ICC demonstrating that both cd-syb2 and control viruses achieved a nearly 100% infection rate. Percent infected refers to the number of visually identified MAP2-positive somas (i.e. neurons) that were also positive for GFP. Three fields of view were quantified for each condition. d, Representative traces (left) and quantification (right) demonstrating that cd-syb2 was expressed at levels sufficient to inhibit evoked IPSCs triggered by field stimulation (p = 0.032, two-tailed t-test; n = 10 neurons for each condition, using 2 litters of mice, 3 coverslips per condition). Data are presented as mean ± s.e.m.. * denotes p < 0.05.
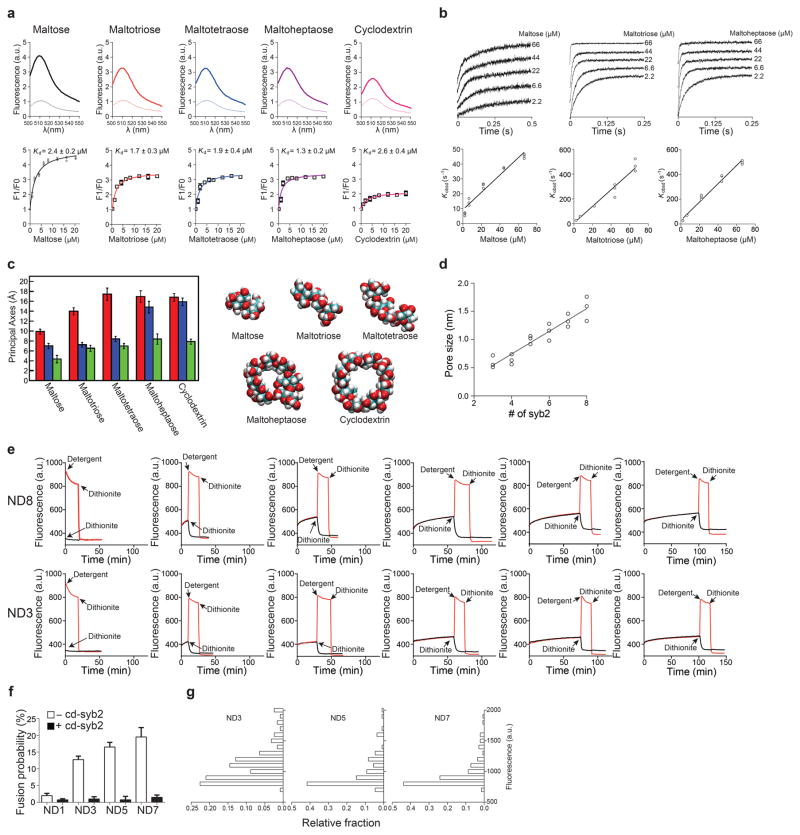
Extended Data Figure 2. Binding of different maltodextrins to the maltose sensor, determination of pore sizes and the relative fraction of open pores, and characterization of the single vesicle fusion assay.
a, Fluorescence emission spectra of the maltose sensor in the absence or presence of the indicated maltodextrin (top). Equilibrium titration of maltodextrin binding to the maltose sensor. The data were fitted with a single site binding equation, using Prism 6 (GraphPad software, lnc.), to determine the dissociation constants. n = 3 independent experiments. Data are presented as mean ± s.d. (bottom). b, Kinetics of maltodextrin binding to the maltose sensor using stopped-flow (top). The observed rate constants (Kobsd) were plotted against maltodextrin concentration. The data were fitted with linear functions, yielding the off and on-rates for binding of each maltodextrin to the maltose sensor, as follows: 3 ± 1 S−1 and 0.58 ± 0.03 μM−1S−1 (maltose), 14 ± 1 S−1 and 6.7 ± 0.3 μM−1S−1 (maltotriose), 29 ± 9 S−1 and 7.3 ± 0.2 μM−1S−1 (maltoheptaose), respectively (bottom). n = 3 independent experiments. Data are presented as mean ± s.d.. c, The lengths of the three principal axes of each sugar were averaged during 10 ns simulations (left). Representative snapshots of the sugars from the simulations. Error bars indicate s.d. from 1000 snapshots taken every 10 ps during the simulation (right). Data are presented as mean ± s.e.m.. d, Pore sizes were determined from the maltodextrin flux assays shown in Fig. 2c, as described in Methods. n = 3 independent experiments. e, Representative traces of dithionite quenching experiments using ND3 and ND8. Dithionite was added at the indicated time points, during on-going fusion reactions, to determine the degree of protection of NBD. The degree of protection was plotted against the incubation time, as shown in Fig. 2d. Similar results were obtained in three independent trials. We note that quenching by dithionite is much faster than cargo release (e.g. Fig. 2b). This is because the kinetics of most of the dithionite quenching that was observed was not a reflection of its influx via fusion pores, as >50% of the NBD-PE is on the outer leaflet. It is likely that dithionite can readily enter even small, flickering fusion pores, such as those formed by ND3, because it is smaller (174.11 Da) than the smallest maltodextrin used in this study (maltose; 360.31 Da). Also, the dithionite is present at high concentrations (5 mM). f, Plot of fusion probability observed using the indicated NDs; the black bars indicate experiments in which t-SNARE SUVs were pre-incubated with cd-syb2 to prevent trans-SNARE pairing. Data are presented as mean ± s.d.. g, Histograms of the fluorescence intensities of the tethered t-SNARE vesicles. n values were 54, 51, and 53 traces respectively, obtained from four independent trials under each condition.
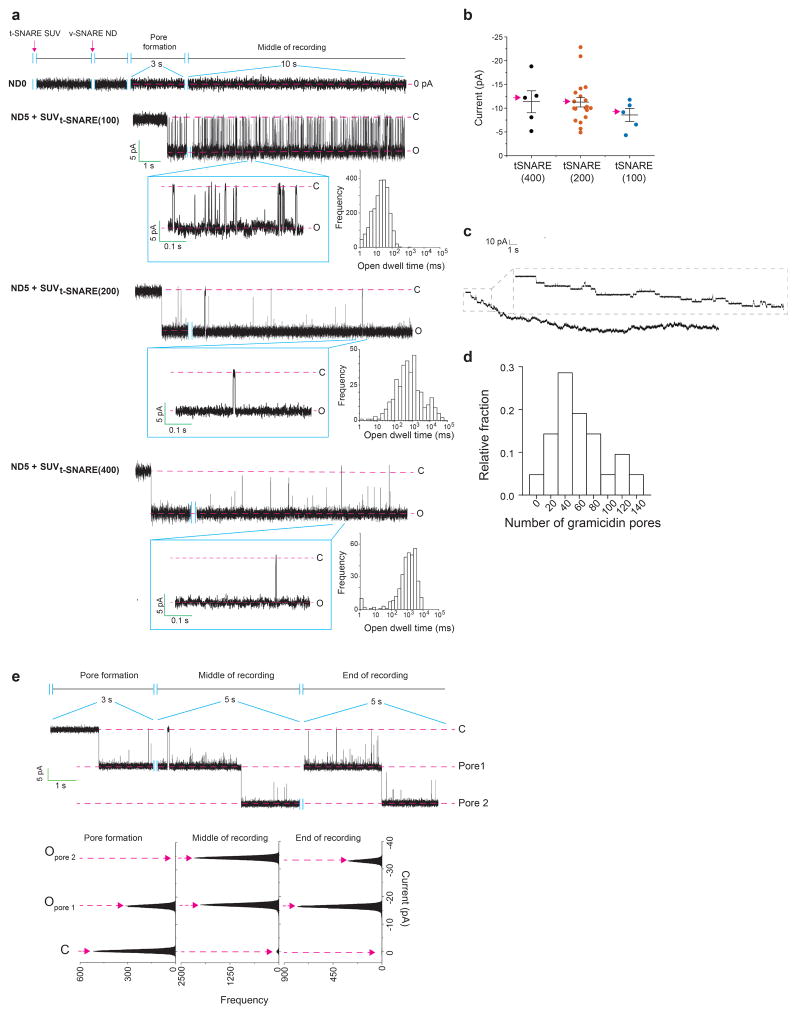
Extended Data Figure 3. Characterization of the ND-BLM system: effect of t-SNARE density and detection of multiple pores.
a–b, Fusion pores were formed using ND5 and BLMs bearing different t-SNARE densities. t-SNARE density was varied by using SUVs that harbored 100 (SUVt-SNARE (100)), 200 (SUVt-SNARE (200)) or 400 (SUVt-SNARE (400)) copies of the SNAP-25B/syntaxin1A heterodimer per liposome. Since SUVt-SNARE (200) and SUVt-SNARE (400) resulted in fusion pores with similar sizes and kinetics properties, SUVt-SNARE (200) was used for all other experiments in this study. n = 5 for SUVt-SNARE (100) and 20 for (SUVt-SNARE (200)); n = 5 for SUVt-SNARE (400). The representative traces (a) correspond to data points demarcated with red arrows in current versus t-SNARE copy number plot (b). Data are presented as mean ± s.e.m.. c, Estimation of the t-SNARE density in the BLMs used to form fusion pores. Typical recording showing that multiple t-SNARE SUVs, bearing a single gramicidin pore, fuse with the planar lipid bilayer. d, Histogram of the number of gramicidin pores formed, as shown in panel c, from 21 trials.Histogram of the number of gramicidin pores formed (n = 21). e, Multiple pores sometimes form in the ND-BLM assay. Example of a recording (SUVt-SNARE (200) and ND5) in which a second pore appeared (top). Current histograms of the recording in the upper panel are shown (bottom). Similar results were obtained in fifteen independent trials.
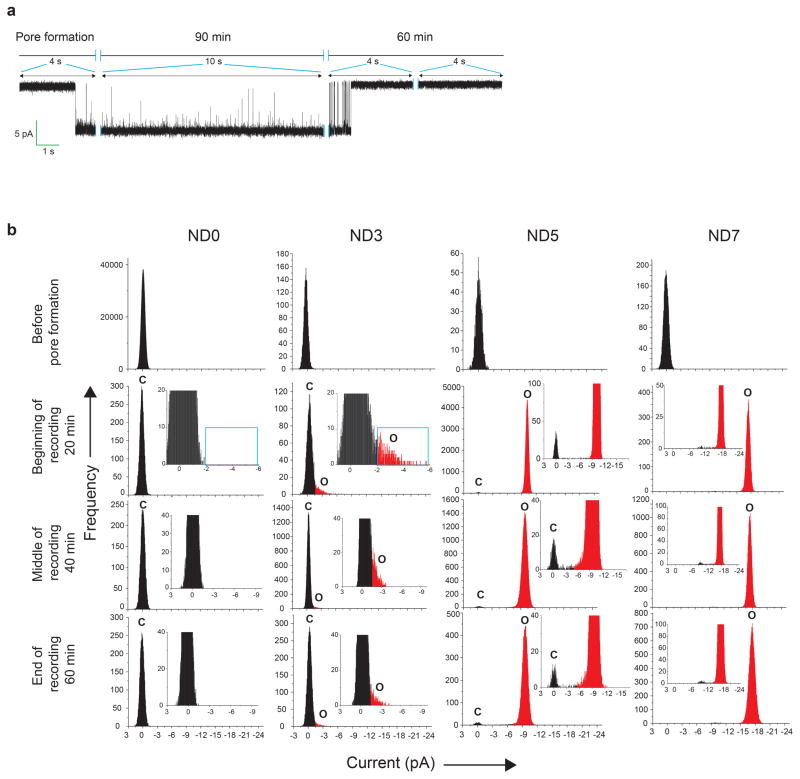
Extended Data Figure 4. ND-BLM fusion pore properties at various time points.
a, Typical recording of a fusion pore formed using ND5; this pore eventually closed after ~100 min. Similar results were obtained in eleven independent trials. b, Stability of fusion pores in the ND-BLM assay. Current histograms of ND-BLM assays using SUVt-SNARE (200) and ND0, ND3, ND5, or ND7 at different time points in the recordings. There were no significant differences at the beginning, middle, or end of a recording session, so fusion pores are stable. The baseline was also stable over course of all recordings reported in this study. n = 14 for ND3; n = 20 for ND5 and ND7. For clarity, the closed state is shown in black and the open state is shown in red. In the case of ND0 and ND3, a cyan box is included to mark the appearance of open pores in ND3.
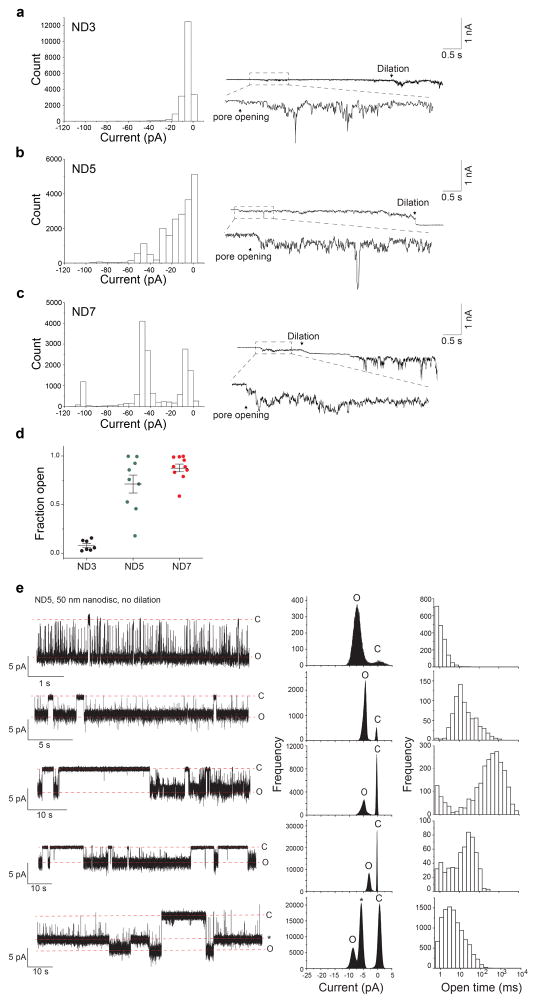
Extended Data Figure 5. Fusion pores formed using 50 nm NDs often dilate.
a–c, Current histograms (left) and representative traces (right) of dilating fusion pores formed using ND3 (a, n = 7), ND5 (b, n = 9) and ND7 (c, n = 10). d, Fraction of time that pores are open. Since fusion pores often dilated, we analyzed the currents during an early phase of their initial open state (0.5 s after pore formation). Increasing the copy number of SNAREs per nanodisc resulted in larger pores12 (a–c) that spent more time in the open state (before they dilated; d). Data are presented as mean ± s.e.m.. e, A subpopulation of fusion pores formed using 50 nm NDs fail to dilate. Representative traces (left), current (middle) and open dwell time (right) histograms of non-dilating fusion pores (observed in 5 out of 14 trials) formed using 50 nm ND5. These pores exhibit well-defined open and closed states. There is some degree of heterogeneity regarding the v-SNARE copy number per ND (Fig. 3c and ref. 9). The non-dilating pores likely arise from NDs with the lower v-SNARE densities, consistent with a model in which SNARE density drives dilation19.
Extended Data Figure 6. Characterization of fusion pores formed by yeast SNAREs.
a, Illustration of pores formed using the yeast SNARE complex comprising Sso1p, the appropriate fragment of Sec9c (residues 401-651), and Snc2p. b, Typical recordings of fusion pores formed using ND0, ND3, ND5, and ND7. c–d) open dwell time histogram (c) and a scatter plot of the currents (d) that result from fusion pores formed using ND3 (n = 10), ND5 (n= 14) and ND7 (n = 14). ANOVA p<0.001; linear trend post-hoc p<0.001. Red arrows in panel d indicate the representative pores shown in panel c. Data are presented as mean ± s.e.m.. There is significant increase in pore size and stability as the v-SNARE copy number is increased. The rate constants for pore closure are reported in Extended Data Table 3. *** indicates p<0.001.
Extended Data Figure 7. Closure of fusion pores caused by cd-syb2.
a, Fusion pores were first formed using ND5; cd-syb2 was then added at the indicated concentrations. Partial closure of fusion pores was sometimes observed after addition of cd-syb2, as shown in the representative current trace. b, Current histogram of all data from the 4 out of 11 trials in which partial closure was observed. In the remaining trials, these sub-conductance states were not observed (Fig. 4a). c, Representative recording (top) and current histogram (bottom) of a pore (ΔΨ = −50 mV) formed using ND7, before and after addition of cd-syb2 at the indicated concentrations. d, Fraction of closed pores formed using ND5 and ND7 in the presence of 20.25 μM cd-syb2. Data are presented as mean ± s.e.m..
Extended Data Figure 8. BSA, cd-syb24A and a C-terminal truncation of SNAP-25B have limited effects on fusion pore current.
Representative traces (top) and current histograms (bottom) of fusion pores before (left) and after (right) addition of BSA (a) or cd-syb24A (b). These reagents had no effect on the magnitude of the currents, but cd-syb24A causes increases in flickering behavior, likely due to weak residual t-SNARE binding activity; this effect was limited, as the same concentration of cd-syb2 completely closed pores under the same conditions. n = 6 for both BSA and cd-syb24A. c, Fusion pore current is unaffected in SNAP-25B1-197. n = 20 for SNAP-25B (WT) and n = 5 for SNAP-25B1-197; Data are presented as mean ± s.e.m..
Extended Data Table 1.
Trans-SNARE pairing underlies the formation of fusion pores.
| # of pore events | total # of trials | Odds ratio [95% C.I.]* | Fisher’s exact test* | |
|---|---|---|---|---|
|
| ||||
| v-SNARE ND/t-SNARE vesicles | 12 | 51 | NA | NA |
| v-SNARE ND/t-SNARE vesicles & cd-syb2 | 1 | 53 | 0.063 [0.008, 0.501] | p < 0.001 |
| v-SNARE ND/t-SNARE vesicles & cd-t | 2 | 50 | 0.135 [0.029, 0.641] | p = 0.004 |
| v-SNARE ND/syntaxin-alone vesicles | 0 | 51 | 0[NA] | p < 0.001 |
| protein free ND/t-SNARE vesicles | 0 | 50 | 0[NA] | p < 0.001 |
| v-SNARE ND/protein free vesicles | 0 | 53 | 0[NA] | p < 0.001 |
compared to v-SNARE ND/t-SNARE vesicles.
n = 4 biologically independent samples.
Extended Data Table 2.
Rate constants for closure of fusion pores formed by neuronal and yeast SNAREs.
| k1 (ms−1) | k2(ms−1) | |
|---|---|---|
|
| ||
| ND3 (neuronal) | 3.4 ± 0.09 | 0.3 ± 0.06 |
| ND5 (neuronal) | 0.01 ± 0.0001 | 0.0008 ± 0.00001 |
| ND7 (neuronal) | 0.002 ± 0.000014 | 0.00008 ± 0.00006 |
| ND3 (yeast) | 1.4 ± 0.05 | 0.4 ± 0.03 |
| ND5 (yeast) | 0.005 ± 0.00006 | 0.001 ± 0.00001 |
| ND7 (yeast) | 0.002 ± 0.00005 | 0.00015 ± 0.00001 |
n = 14, 20 and 20 independent BLMs for ND3, ND5, and ND7 (using all neuronal SNAREs) respectively, and 5 different sets of NDs. n = 10, 14 and 14 independent BLMs for ND3, ND5, and ND7 (using all yeast SNAREs) respectively, and 5 different sets of NDs. Data are presented as mean ± s.e.m.
Supplementary Material
Acknowledgments
This study was supported by grants from the NIH (MH061876 and NS097362 to E.R.C.; NS081293 to B.C.). H.B. was supported by a postdoctoral fellowship from the Human Frontier Science Program. D. R. was supported by an NIH fellowship (F32GM112371). E.R.C. is an Investigator of the Howard Hughes Medical Institute.
Footnotes
Author Contributions
H.B. and E.R.C. conceived of the project and designed the biochemistry experiments; H.B. performed nanodisc reconstitution and fusion assays. H.B. and D.D. performed the planar lipid bilayer recordings. N.C. designed and conducted the experiments using neurons. Y.J. and B.C. aided in the initial planar lipid bilayer recordings. J.B. contributed neurons. X.L. and H.B. contributed to the single vesicle fusion assays. D.R. and Q.C. conducted molecular dynamics simulations. H.B., D.D., N.C. and E.R.C. wrote the paper, and all other authors edited the manuscript.
Competing interests
The authors declare no competing financial interests.
References
- 1.Giraudo CG, et al. SNAREs can promote complete fusion and hemifusion as alternative outcomes. Journal of Cell Biology. 2005;170:249–260. doi: 10.1083/jcb.200501093. [DOI] [PMC free article] [PubMed] [Google Scholar]
- 2.Fulop T, Radabaugh S, Smith C. Activity-dependent differential transmitter release in mouse adrenal chromaffin cells. Journal of Neuroscience. 2005;25:7324–7332. doi: 10.1523/Jneurosci.2042-05.2005. [DOI] [PMC free article] [PubMed] [Google Scholar]
- 3.Richards DA. Vesicular release mode shapes the postsynaptic response at hippocampal synapses. J Physiol. 2009;587:5073–5080. doi: 10.1113/jphysiol.2009.175315. [DOI] [PMC free article] [PubMed] [Google Scholar]
- 4.Choi S, Klingauf J, Tsien RW. Fusion pore modulation as a presynaptic mechanism contributing to expression of long-term potentiation. Philosophical Transactions of the Royal Society of London Series B-Biological Sciences. 2003;358:695–705. doi: 10.1098/rstb.2002.1249. [DOI] [PMC free article] [PubMed] [Google Scholar]
- 5.Alabi AA, Tsien RW. Perspectives on Kiss-and-Run: Role in Exocytosis, Endocytosis, and Neurotransmission. Annual Review of Physiology, Vol 75. 2013;75:393–422. doi: 10.1146/annurev-physiol-020911-153305. [DOI] [PubMed] [Google Scholar]
- 6.Renger JJ, Egles C, Liu GS. A developmental switch in neurotransmitter flux enhances synaptic efficacy by affecting AMPA receptor activation. Neuron. 2001;29:469–484. doi: 10.1016/S0896-6273(01)00219-7. [DOI] [PubMed] [Google Scholar]
- 7.Shi L, et al. SNARE Proteins: One to Fuse and Three to Keep the Nascent Fusion Pore Open. Science. 2012;335:1355–1359. doi: 10.1126/science.1214984. [DOI] [PMC free article] [PubMed] [Google Scholar]
- 8.Liu GS, Choi SW, Tsien RW. Variability of neurotransmitter concentration and nonsaturation of postsynaptic AMPA receptors at synapses in hippocampal cultures and slices. Neuron. 1999;22:395–409. doi: 10.1016/S0896-6273(00)81099-5. [DOI] [PubMed] [Google Scholar]
- 9.Bao H, et al. Exocytotic fusion pores are composed of both lipids and proteins. Nature Structural & Molecular Biology. 2016;23:67–73. doi: 10.1038/nsmb.3141. [DOI] [PMC free article] [PubMed] [Google Scholar]
- 10.Mueller P, Rudin DO, Tien HT, Wescott WC. Reconstitution of cell membrane structure in vitro and its transformation into an excitable system. Nature. 1962;194:979–980. doi: 10.1038/194979a0. [DOI] [PubMed] [Google Scholar]
- 11.Wu Z, et al. Nanodisc-cell fusion: control of fusion pore nucleation and lifetimes by SNARE protein transmembrane domains. Sci Rep. 2016;6:27287. doi: 10.1038/srep27287. [DOI] [PMC free article] [PubMed] [Google Scholar]
- 12.Bhalla A, Chicka MC, Tucker WC, Chapman ER. Ca2+-synaptotagmin directly regulates t-SNARE function during reconstituted membrane fusion. Nature Structural & Molecular Biology. 2006;13:323–330. doi: 10.1038/Nsmb1076. [DOI] [PubMed] [Google Scholar]
- 13.Wiederhold K, et al. A Coiled Coil Trigger Site Is Essential for Rapid Binding of Synaptobrevin to the SNARE Acceptor Complex. Journal of Biological Chemistry. 2010;285:21549–21559. doi: 10.1074/jbc.M110.105148. [DOI] [PMC free article] [PubMed] [Google Scholar]
- 14.Sudhof TC, Rothman JE. Membrane fusion: grappling with SNARE and SM proteins. Science. 2009;323:474–477. doi: 10.1126/science.1161748. [DOI] [PMC free article] [PubMed] [Google Scholar]
- 15.Albillos A, et al. The exocytotic event in chromaffin cells revealed by patch amperometry. Nature. 1997;389:509–512. doi: 10.1038/39081. [DOI] [PubMed] [Google Scholar]
- 16.Klyachko VA, Jackson MB. Capacitance steps and fusion pores of small and large-dense-core vesicles in nerve terminals. Nature. 2002;418:89–92. doi: 10.1038/nature00852. [DOI] [PubMed] [Google Scholar]
- 17.Henkel AW, Meiri H, Horstmann H, Lindau M, Almers W. Rhythmic opening and closing of vesicles during constitutive exo- and endocytosis in chromaffin cells. Embo Journal. 2000;19:84–93. doi: 10.1093/emboj/19.1.84. [DOI] [PMC free article] [PubMed] [Google Scholar]
- 18.Staal RGW, Mosharov EV, Sulzer D. Dopamine neurons release transmitter via a flickering fusion pore. Nature Neuroscience. 2004;7:341–346. doi: 10.1038/nn1205. [DOI] [PubMed] [Google Scholar]
- 19.Wu ZY, et al. Dilation of fusion pores by crowding of SNARE proteins. Elife. 2017;6 doi: 10.7554/eLife.22964. ARTN e22964. [DOI] [PMC free article] [PubMed] [Google Scholar]
- 20.Sinha R, Ahmed S, Jahn R, Klingauf J. Two synaptobrevin molecules are sufficient for vesicle fusion in central nervous system synapses. Proc Natl Acad Sci U S A. 2011;108:14318–14323. doi: 10.1073/pnas.1101818108. [DOI] [PMC free article] [PubMed] [Google Scholar]
- 21.Lai Y, et al. Fusion pore formation and expansion induced by Ca2+ and synaptotagmin 1. Proc Natl Acad Sci U S A. 2013;110:1333–1338. doi: 10.1073/pnas.1218818110. [DOI] [PMC free article] [PubMed] [Google Scholar]
- 22.Wickner W, Schekman R. Membrane fusion. Nat Struct Mol Biol. 2008;15:658–664. doi: 10.1038/nsmb.1451. [DOI] [PMC free article] [PubMed] [Google Scholar]
- 23.Orso G, et al. Homotypic fusion of ER membranes requires the dynamin-like GTPase Atlastin. Nature. 2009;460:978–U958. doi: 10.1038/nature08280. [DOI] [PubMed] [Google Scholar]
- 24.Cao YL, et al. MFN1 structures reveal nucleotide-triggered dimerization critical for mitochondrial fusion. Nature. 2017 doi: 10.1038/nature21077. [DOI] [PMC free article] [PubMed] [Google Scholar]
- 25.Podbilewicz B. Virus and cell fusion mechanisms. Annu Rev Cell Dev Biol. 2014;30:111–139. doi: 10.1146/annurev-cellbio-101512-122422. [DOI] [PubMed] [Google Scholar]
- 26.Yeh FL, et al. SV2 Mediates Entry of Tetanus Neurotoxin into Central Neurons. Plos Pathogens. 2010;6 doi: 10.1371/journal.ppat.1001207. ARTN e1001207. [DOI] [PMC free article] [PubMed] [Google Scholar]
- 27.Kutner RH, Zhang XY, Reiser J. Production, concentration and titration of pseudotyped HIV-1-based lentiviral vectors. Nature protocols. 2009;4:495–505. doi: 10.1038/nprot.2009.22. [DOI] [PubMed] [Google Scholar]
- 28.Nasr ML, et al. Covalently circularized nanodiscs for studying membrane proteins and viral entry. Nature methods. 2017;14:49–52. doi: 10.1038/nmeth.4079. [DOI] [PMC free article] [PubMed] [Google Scholar]
- 29.Marvin JS, Schreiter ER, Echevarria IM, Looger LL. A genetically encoded, high-signal-to-noise maltose sensor. Proteins-Structure Function and Bioinformatics. 2011;79:3025–3036. doi: 10.1002/prot.23118. [DOI] [PMC free article] [PubMed] [Google Scholar]
- 30.Tucker WC, Weber T, Chapman ER. Reconstitution of Ca2+-regulated membrane fusion by synaptotagmin and SNAREs. Science. 2004;304:435–438. doi: 10.1126/science.1097196. [DOI] [PubMed] [Google Scholar]
- 31.Bao H, Duong F. Discovery of an auto-regulation mechanism for the maltose ABC transporter MalFGK2. PloS one. 2012;7:e34836. doi: 10.1371/journal.pone.0034836. [DOI] [PMC free article] [PubMed] [Google Scholar]
- 32.Brooks BR, et al. CHARMM: The Biomolecular Simulation Program. J Comput Chem. 2009;30:1545–1614. doi: 10.1002/Jcc.21287. [DOI] [PMC free article] [PubMed] [Google Scholar]
- 33.Eastman P, et al. OpenMM 4: A Reusable, Extensible, Hardware Independent Library for High Performance Molecular Simulation. J Chem Theory Comput. 2013;9:461–469. doi: 10.1021/ct300857j. [DOI] [PMC free article] [PubMed] [Google Scholar]
- 34.Guvench O, et al. Additive Empirical Force Field for Hexopyranose Monosaccharides. J Comput Chem. 2008;29:2543–2564. doi: 10.1002/jcc.21004. [DOI] [PMC free article] [PubMed] [Google Scholar]
- 35.Guvench O, Hatcher E, Venable RM, Pastor RW, MacKerell AD. CHARMM Additive All-Atom Force Field for Glycosidic Linkages between Hexopyranoses. J Chem Theory Comput. 2009;5:2353–2370. doi: 10.1021/ct900242e. [DOI] [PMC free article] [PubMed] [Google Scholar]
- 36.Jorgensen WL, Chandrasekhar J, Madura JD, Impey RW, Klein ML. COMPARISON OF SIMPLE POTENTIAL FUNCTIONS FOR SIMULATING LIQUID WATER. J Chem Phys. 1983;79:926–935. doi: 10.1063/1.445869. [DOI] [Google Scholar]
- 37.Bohne A, Lang E, von der Lieth CW. SWEET - WWW-based rapid 3D construction of oligo- and polysaccharides. Bioinformatics. 1999;15:767–768. doi: 10.1093/bioinformatics/15.9.767. [DOI] [PubMed] [Google Scholar]
- 38.Jo S, Kim T, Iyer VG, Im W. CHARMM-GUI: A web-based graphical user interface for CHARMM. J Comput Chem. 2008;29:1859–1865. doi: 10.1002/jcc.20945. [DOI] [PubMed] [Google Scholar]
- 39.Jo S, Song KC, Desaire H, MacKerell AD, Im W. Glycan Reader: Automated Sugar Identification and Simulation Preparation for Carbohydrates and Glycoproteins. J Comput Chem. 2011;32:3135–3141. doi: 10.1002/jcc.21886. [DOI] [PMC free article] [PubMed] [Google Scholar]
- 40.Kyoung MJ, Zhang YX, Diao JJ, Chu S, Brunger AT. Studying calcium-triggered vesicle fusion in a single vesicle-vesicle content and lipid-mixing system. Nature protocols. 2013;8:1–16. doi: 10.1038/nprot.2012.134. [DOI] [PMC free article] [PubMed] [Google Scholar]
- 41.Finkelstein A. Bilayers: formation, measurements, and incorporation of components. Methods Enzymol. 1974;32:489–501. doi: 10.1016/0076-6879(74)32049-6. [DOI] [PubMed] [Google Scholar]
Associated Data
This section collects any data citations, data availability statements, or supplementary materials included in this article.
Supplementary Materials
Data Availability Statement
All original data will be made available by the corresponding authors upon reasonable request. For gel source data, see Supplementary Fig. 1. Source data for Fig. 2b–d is available online


