Summary
Distant-acting tissue-specific enhancers vastly outnumber protein-coding genes in mammalian genomes, but the functional significance of this regulatory complexity remains insufficiently understood1,2. Here we show that the pervasive presence of multiple enhancers with similar activities near the same gene confers phenotypic robustness to loss-of-function mutations in individual enhancers. We used genome editing to create 23 mouse deletion lines and inter-crosses, including both single and combinatorial enhancer deletions at seven distinct loci required for limb development. Surprisingly, none of ten deletions of individual enhancers caused noticeable changes in limb morphology. In contrast, removal of pairs of limb enhancers near the same gene resulted in discernible phenotypes, indicating that enhancers function redundantly in establishing normal morphology. In a genetic background sensitized by reduced baseline expression of the target gene, even single enhancer deletions caused limb abnormalities, suggesting that functional redundancy is conferred by additive effects of enhancers on gene expression levels. A genome-wide analysis integrating epigenomic and transcriptomic data from 29 developmental mouse tissues revealed that mammalian genes are very commonly associated with multiple enhancers that have similar spatiotemporal activity. Systematic exploration of three representative developmental structures (limb, brain, heart) uncovered more than a thousand cases in which five or more enhancers with redundant activity patterns were found near the same gene. Taken together, our data indicate that enhancer redundancy is a remarkably widespread feature of mammalian genomes and provides an effective regulatory buffer preventing deleterious phenotypic consequences upon loss of individual enhancers.
Text
Enhancers are a principal class of cis-regulatory elements, orchestrating precise gene expression patterns essential for numerous processes including embryonic development2. They are now routinely predicted by genome-wide chromatin profiling methods, which identify open chromatin or enhancer-associated histone marks3. Enhancers predicted by these high-throughput approaches outnumber genes by approximately an order of magnitude1, raising the intriguing question about their functional significance. In particular, it remains unclear whether mammalian enhancers typically regulate complementary spatiotemporal aspects of gene expression in an additive fashion4–7, or if this regulatory complexity more commonly results in functional redundancy among enhancers associated with the same gene8–10.
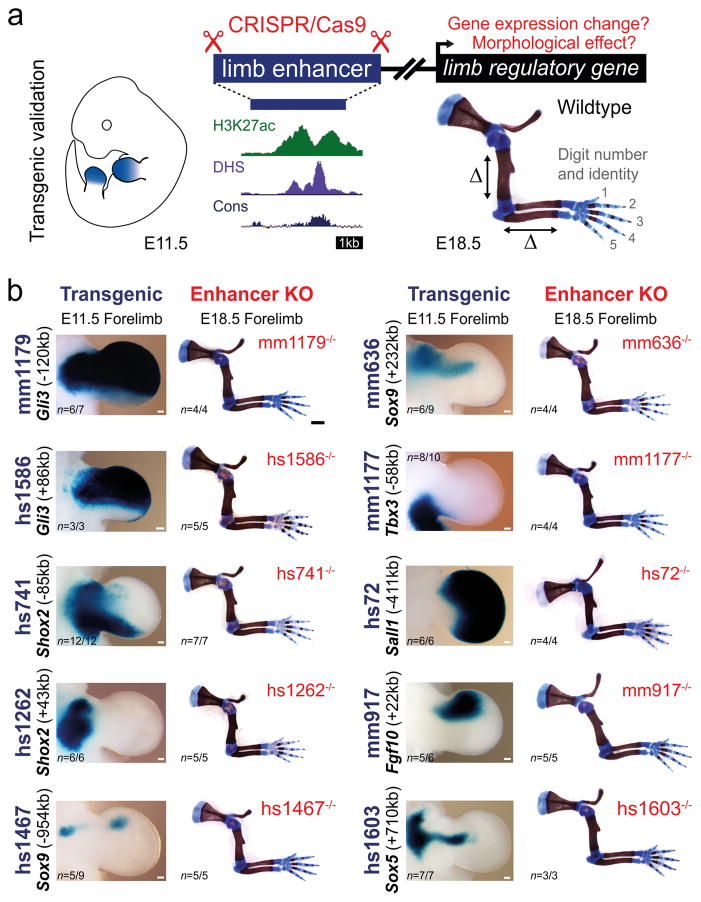
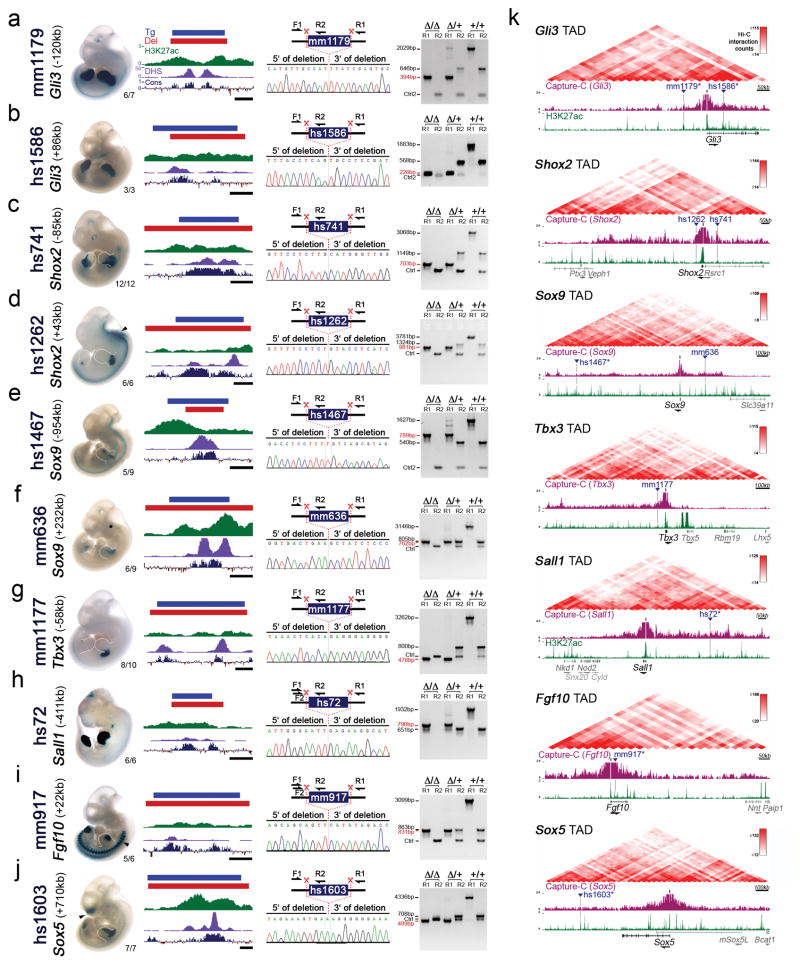
Using the developing limb as a model for gene regulation during morphogenetic processes11,12, we explored the functional importance of enhancers in vivo. We used CRISPR/Cas9 genome editing to individually delete ten embryonic enhancers, each with strong evolutionary conservation and robust limb activity in transgenic mouse reporter assays (VISTA Enhancer Browser: https://enhancer.lbl.gov/)13–17 (Fig. 1a, Extended Data Fig. 1a–j and Supplementary Table 1). Each enhancer is located in the vicinity of a gene associated with human congenital limb malformations, and deletion of these genes in mice results in limb phenotypes ranging from polydactyly (Gli3) to complete loss of limbs (Fgf10) (Extended Data Fig. 1, Supplementary Table 2). In all cases, the limb activity pattern of the enhancer at embryonic day 11.5 (E11.5) overlaps spatial RNA expression of the associated target gene, suggesting that these enhancers are part of the regulatory architecture controlling the expression of these genes (Extended Data Fig. 2)16–21. Capture-C data from embryonic limbs22 confirmed physical interactions with the respective predicted target genes for at least six of these enhancers (Extended Data Fig. 1k). This framework allowed us to investigate the functional contribution of each enhancer by comparing potential limb skeletal abnormalities caused by enhancer loss to the phenotypes observed in gene knockout mice.
Figure 1. Lack of limb morphological abnormalities in ten enhancer deletion lines.
(a) All selected enhancers are active in the limb mesenchyme (blue shading) at E11.5, are marked by epigenomic H3K27 acetylation and DNase I hypersensitivity (DHS) at E11.5, and contain a conserved core sequence (Cons). Following deletion of individual enhancers (Extended Data Fig. 1a–j), target gene expression and limb morphology were assessed. (b) None on the individual enhancer deletions caused obvious defects in the structure of skeletal elements. Enhancer activities (left, E11.5) and forelimb skeletons of enhancer knockout (KO) embryos (right, E18.5) are shown (see Extended Data Fig. 3 for wild-type controls). Predicted target gene and enhancer distance (+: downstream; -: upstream) from the transcriptional start site (TSS) are indicated. “n”, independent biological replicates with similar results. Scale bars, 100 μm (white), 1 mm (black).
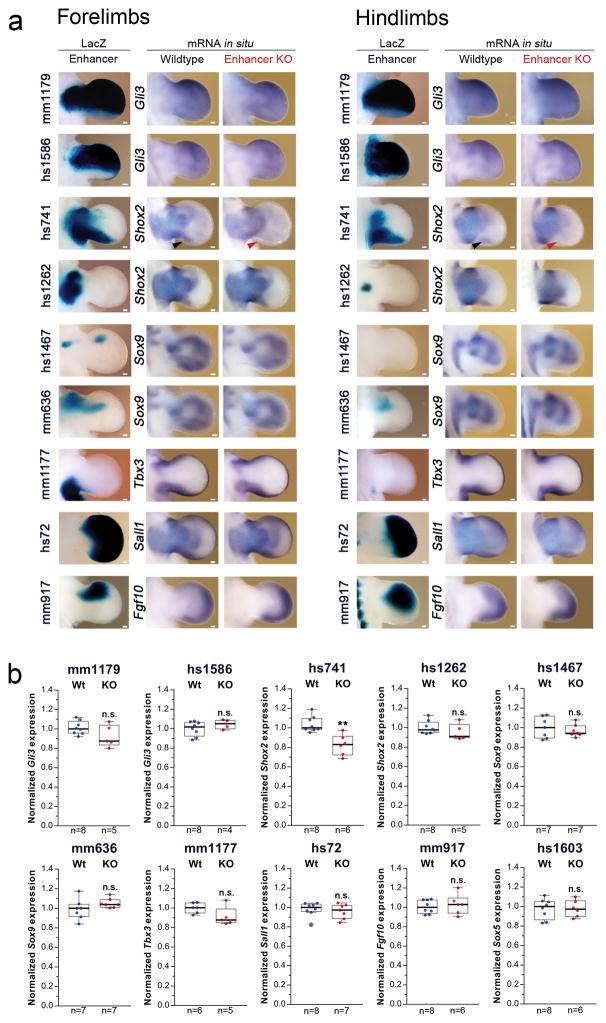
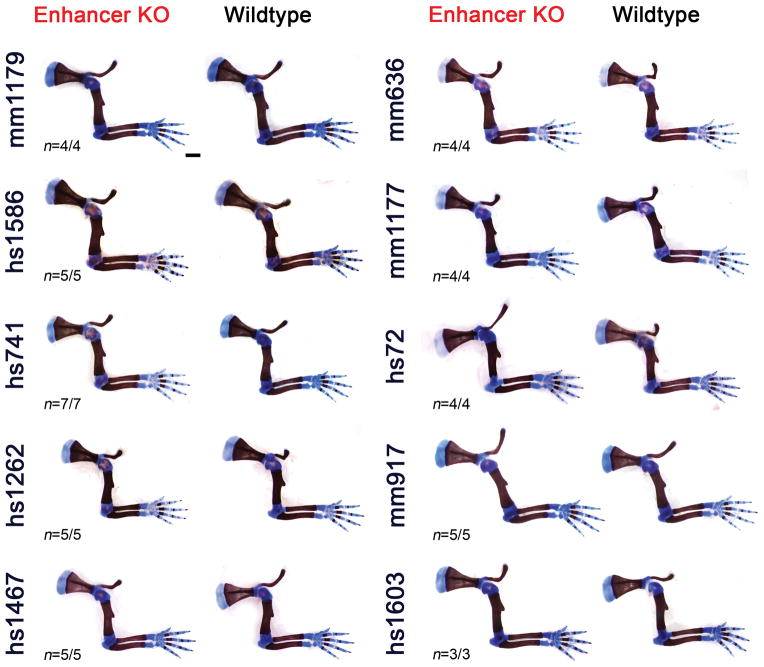
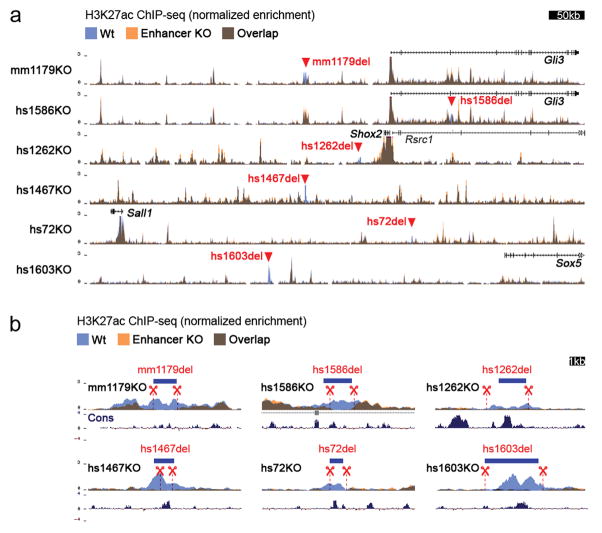
Surprisingly, we did not detect any abnormalities in bone number, shape, length, position or mineralization in any of the ten single enhancer deletion lines (Fig. 1b and Extended Data Fig. 3). Similarly, we observed neither significant differences in predicted target gene expression in embryonic limbs for nine out of ten individual enhancer deletions, nor obvious changes in local H3K27ac signatures outside of the deleted enhancers (Extended Data Figs. 2 and 4). Together, these results suggest that a substantial proportion of limb enhancers, even if highly conserved in evolution, are not individually essential for normal limb morphogenesis.
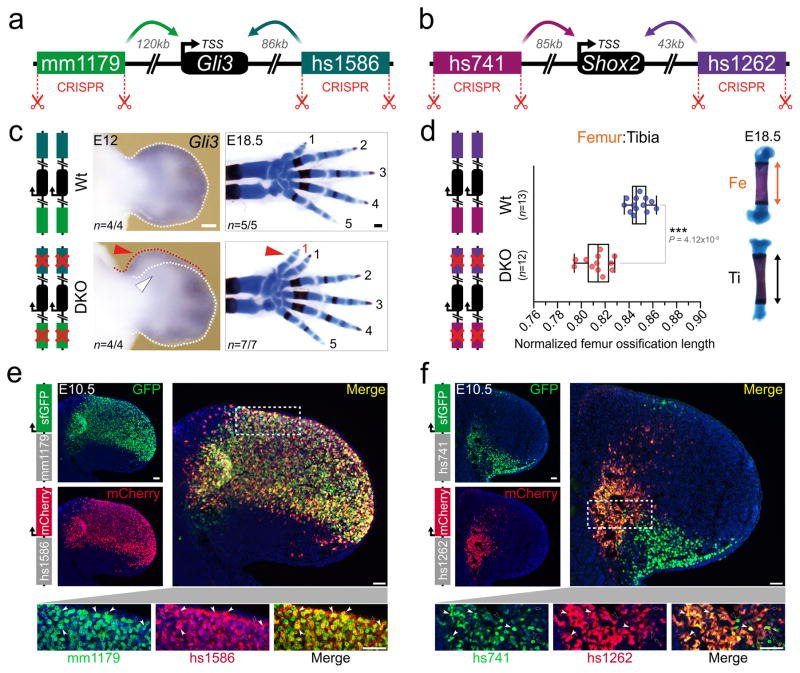
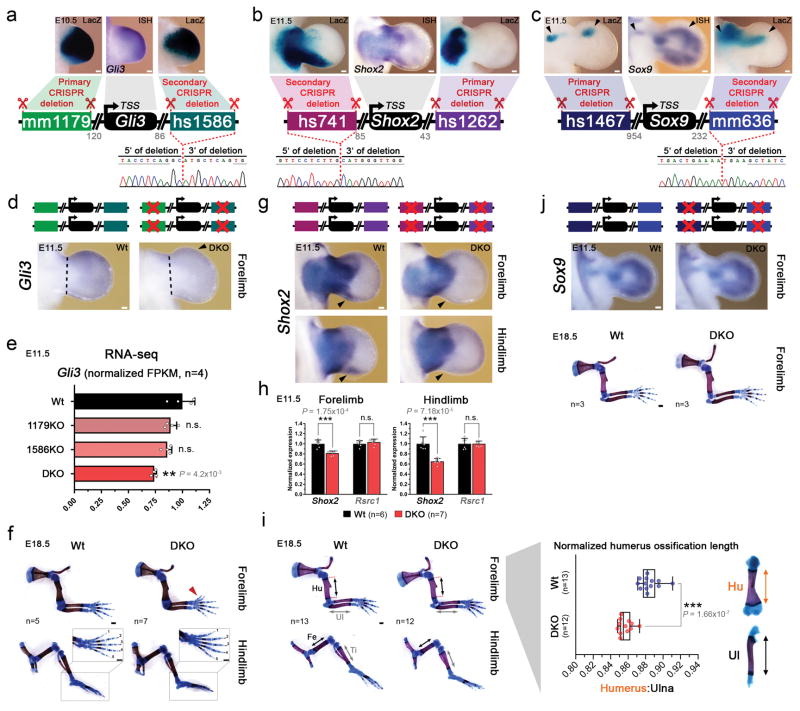
One possible explanation for the lack of an obvious phenotype in individual limb enhancer knockout lines is that different enhancers associated with the same gene may have spatiotemporally redundant, rather than unique, activity. Our selected panel of enhancers (Fig. 1b, Extended Data Fig. 1a–j) included three enhancer pairs with overlapping limb activity domains and the same predicted target gene (mm1179/hs1586, hs741/hs1262, hs1467/mm636; Extended Data Fig. 5a–c). Using iterative CRISPR/Cas9 genome editing, we generated double enhancer knockout (DKO) mice for each enhancer pair (Extended Data Fig. 5a–j), such that both deletions occurred in cis. In two out of three cases, involving enhancer pairs near Gli3 and Shox2, homozygous DKO embryos showed phenotypic abnormalities affecting skeletal limb morphology (Fig. 2a–d and Extended Data Fig. 5f, i, j). Mice lacking both enhancers near Gli3 (mm1179/hs1586) have significantly reduced Gli3 expression in the embryonic hand plate and exhibit forelimb-specific polydactyly (Fig. 2c and Extended Data Fig. 5e, f), a phenotypic hallmark of diminished Gli3 expression23,24. In addition, combined deletion of the two enhancers near Shox2 (hs741/hs1262) reduced Shox2 expression, predominantly in embryonic hindlimbs, and resulted in a marked reduction of femur ossification (Fig. 2d and Extended Data Fig. 5h, i), consistent with the stylopod reductions observed when the Shox2 gene is inactivated18,25. Taken together, these results show that while each of the four enhancers near Gli3 and Shox2 is individually dispensable for limb morphology, the respective pairs of enhancers are collectively required for normal limb development.
Figure 2. Morphological requirements of limb enhancers with overlapping activities.
(a, b) CRISPR-deleted enhancers and their distance to the TSS of predicted target genes (Gli3, Shox2). (c) Left: RNA in situ hybridization (ISH) reveals reduced Gli3 expression in anterior hand plates of mm1179/hs1586 double enhancer knockout (DKO) embryos (white arrowhead). Red arrowhead: local expansion of anterior mesenchyme, a hallmark of Gli3 deficiencies. Right: Forelimb skeletons with digits labeled 1 to 5, from anterior to posterior. DKO embryos exhibit duplication of digit 1 (arrowhead). Scale bars, 200 μm. (d) Shortened femur ossification length in hs741/hs1262 double enhancer knockout (DKO) embryos (normalized to tibia ossification length). Box plot indicates median, interquartile values, range and individual biological replicates. ***, P < 0.001 (two-tailed, unpaired t-test). (e, f) Co-localization of Gli3 (mm1179: green, hs1586: red) and Shox2 (hs741: green, hs1262: red) enhancer activities via enhancer-reporter transgenes and immunofluorescence (IF) in forelimb buds of double transgenic embryos. White arrowheads: examples of double positive cells. Empty arrowheads or arrows: cells marked by single enhancers. Nuclei are stained blue. Scale bars, 50 μm. “n”, independent biological replicates with similar results.
To examine the degree of overlap between the activity patterns of phenotypically redundant enhancers at the cellular level, we generated transgenic mouse lines expressing fluorescent reporters under the control of each of the Gli3 or Shox2 enhancers (mm1179-GFP, hs1586-mCherry, hs741-GFP and hs1262-mCherry). Using immunofluorescence on limb tissue from double transgenic embryos, we tracked the activity of each of the four enhancers during limb development (Fig. 2e, f and Extended Data Fig. 6). Consistent with the preaxial polydactyly observed in Gli3 double enhancer knockout embryos, limb progenitor cells marked by both Gli3 enhancers were observed at high density in the anterior limb mesenchyme (Fig. 2e and Extended Data Fig. 6c, d). In Shox2 double enhancer reporter embryos, a major accumulation of cells with dual Shox2 enhancer activities is present in a proximal limb mesenchymal cell population known to harbor stylopod progenitors12 (Fig. 2f). In conjunction with our deletion studies, these results illustrate the degree of functional overlap between pairs of enhancers near the same gene at the cellular level.
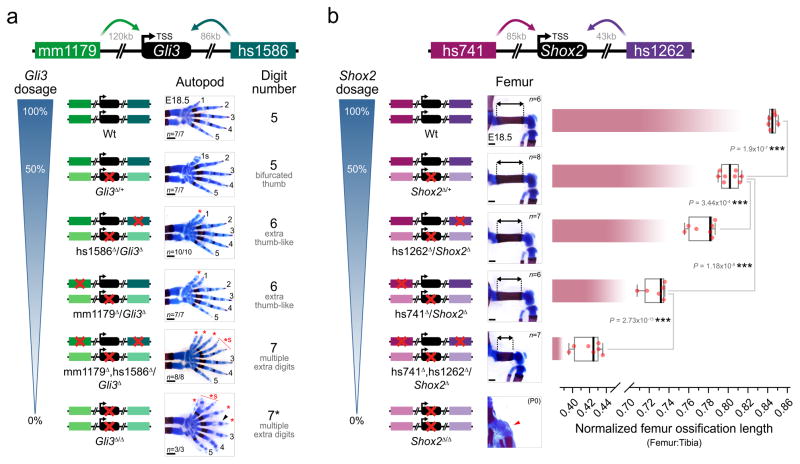
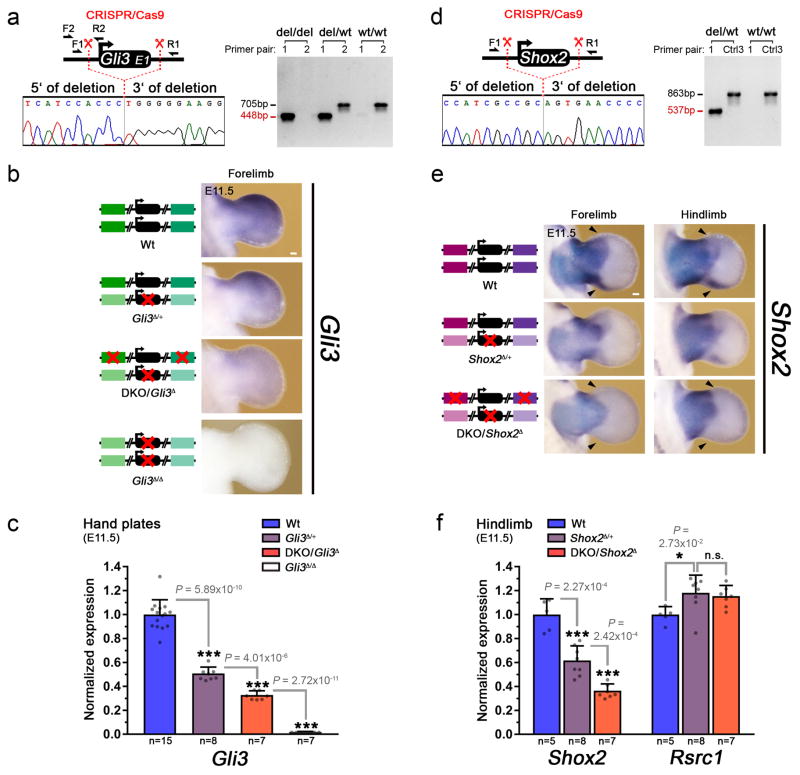
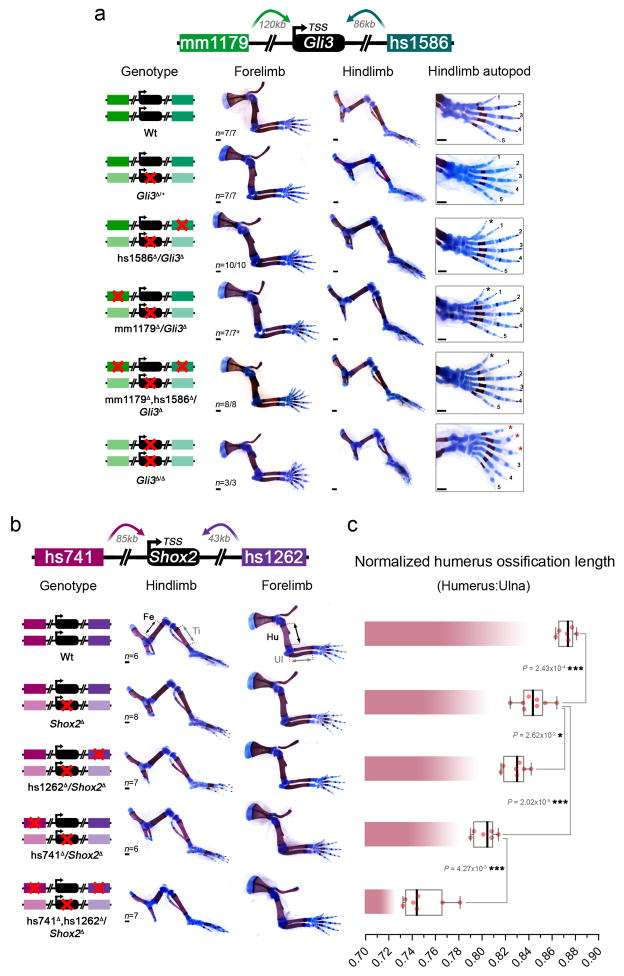
Considering the apparent contrast between the morphological redundancy of pairs of enhancers and the strong evolutionary conservation of each individual enhancer, we studied the phenotypic impact of single and combinatorial enhancer deletions in sensitized genetic backgrounds carrying heterozygous deletions of the presumptive target genes (Fig. 3). We used CRISPR/Cas9 to engineer Gli3 and Shox2 gene loss-of-function alleles, which recapitulated expected gene dosage reductions and previously published phenotypes (Extended Data Figs 7 and 8). We then utilized these alleles to generate compound heterozygous animals harboring one or more disrupted enhancers with a wild-type gene on one allele and a disrupted gene but wild-type enhancers on the other allele (Fig. 3). For Gli3, absence of either enhancer, mm1179 or hs1586, in the presence of only one functional Gli3 allele resulted in a supernumerary anterior digit (Fig. 3a and Extended Data Fig. 8a), which is more severe than the terminally bifurcated thumb observed in Gli3 heterozygotes (Fig. 3a). Similarly, for Shox2 the removal of either neighboring enhancer (hs1262 or hs741) in combination with compound heterozygous deletion of the Shox2 gene results in a more pronounced reduction of femur length than observed in Shox2 heterozygotes (Fig. 3b). For both pairs of enhancers, compound heterozygous mice carrying deletions of both enhancers on one allele and a deletion of the gene on the other allele showed even more severe phenotypes. In the case of Gli3, loss of both enhancers over a Gli3 null allele resulted in greatly reduced expression of Gli3 (Extended Data Fig. 7b, c) and severe pre-axial polydactyly in forelimbs, similar in severity to homozygous loss of the Gli3 gene (Fig. 3a and Extended Data Fig. 8a)24. Likewise, compound heterozygous deletion of enhancers hs741/hs1262 over a Shox2 gene deletion strongly reduced Shox2 expression levels (Extended Data Fig. 7e, f) and resulted in severe reduction of femur length and significant shortening of the humerus (Fig. 3b and Extended Data Fig. 8b, c), consistent with the phenotypes that result from homozygous Shox2 gene loss18,25. Together, our data demonstrate that these developmental enhancers, while seemingly dispensable under non-sensitized conditions, show individual functional contributions to limb development under conditions of reduced genetic robustness.
Figure 3. Normally dispensable individual enhancers are required for limb morphology in a sensitized background.
Individual and combined enhancer deletions in the presence of only one copy of the Gli3 (a) or Shox2 (b) target genes and the resulting limb morphology at E18.5. Wedges indicate inferred gene dosage. (a) Skeletal forelimb autopod phenotypes at E18.5 resulting from mm1179 and hs1586 enhancer deletions in the presence of reduced Gli3 dosage. 1–5, normal digits. Red asterisk, extra digits with unclear identity. *s, “split” digit. Black arrowhead, hypoplastic distal phalange. (b) Progressive reduction of femur ossification length (double arrows) due to hs741 and hs1262 enhancer loss in a Shox2 sensitized background. The relative length of the femur ossification, normalized to the tibia ossification length, is shown. For comparison, the bottom panel shows absence of the femur ossification in Shox2 deficient limbs at P0 (red arrowhead, reproduced with permission from authors of ref. 25). “n”, number of independent biological replicates with similar results. Box plots indicate median, interquartile values, range and individual biological replicates. ***, P < 0.001 (two-tailed, unpaired t-test). Scale bars, 500 μm.
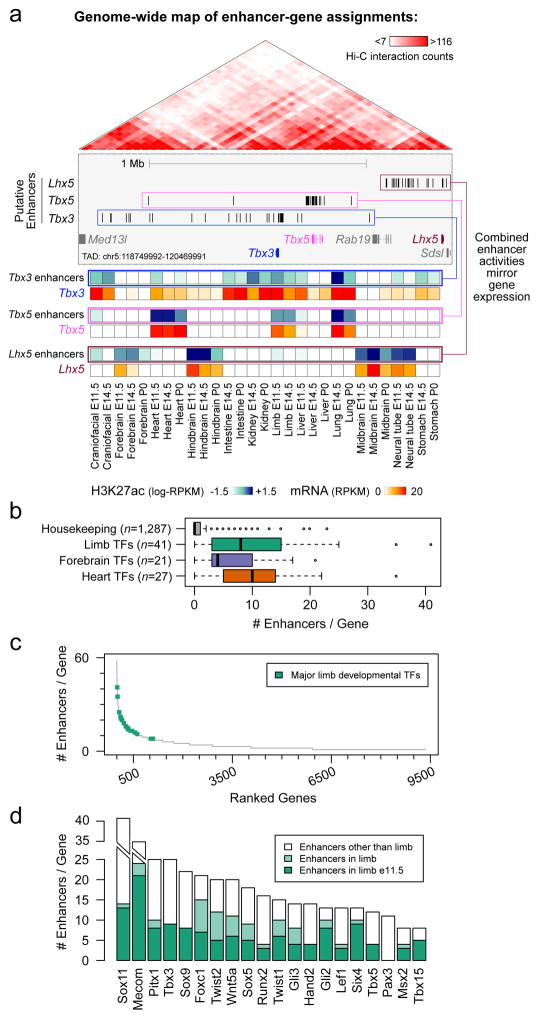
The lack of phenotypic change upon deletion of individual enhancers, and the functional redundancy observed among enhancer pairs, raises the question of how commonly such redundancy occurs in mammalian gene regulatory landscapes. To explore this systematically, we devised a genome-wide, correlation-based computational approach to estimate the number of enhancers regulating each gene during development, taking advantage of chromatin signatures of distal enhancers and gene transcription measured across multiple tissues and time points of mouse development (Fig. 4 and Extended Data Figs 9, 10). We analyzed correlations between H3K27ac ChIP-seq and RNA-seq datasets from 12 different mouse tissues at 2–3 embryonic/perinatal time points per tissue (www.encodeproject.org) to assign each enhancer to its most likely target gene within the same topologically associated domain (TAD)26 (Fig. 4, Extended Data Fig. 9a–c and Methods). We then used this framework to examine the average number of enhancers associated with genes expressed in three developmental tissues (limb, heart, and forebrain). Genes with limb-biased expression showed a median of three associated distal enhancers, versus a median of 0 for housekeeping genes (Extended Data Fig. 9d, e). For the specific class of limb-biased genes encoding transcription factors (TFs), we observed an even more complex enhancer landscape, with a median of eight distinct enhancers per gene (Fig. 4b). Intriguingly, some of these TF genes were associated with more than a dozen tissue-specific distal limb enhancers with highly overlapping activity patterns in the same tissue (Fig. 4c, d and Methods). We observed similarly large numbers of potentially redundant enhancers near brain- and heart-specific TF genes (Extended Data Fig. 10a, b). Even under stringent correlation thresholds, our analysis uncovered 1,058 genes associated with five or more enhancers showing putatively redundant activity patterns, i.e., enhancers active in the same tissue (Extended Data Fig. 10c–f). Taken together, our results indicate that developmentally expressed genes are commonly associated with multiple enhancers that show overlapping activity patterns, supporting the widespread occurrence of functionally redundant enhancers in mammalian genomes.
Figure 4. Enhancers with redundant signatures are prevalent near developmental genes.
(a) Enhancer-gene assignments based on correlation of H3K27ac and mRNA profiles across a wide array of tissues (Extended Data Fig. 9a). Top: At an example locus encompassing Tbx3, Tbx5, and Lhx5, up to 25 enhancers are assigned to each of these three genes (blue, pink and brown boxes, Extended Data Fig. 9c). Genes showing fewer than five assigned enhancers are shown in gray. Bottom: heat maps showing meta-profiles of each gene’s expression profile across tissues (red shades), along with the cumulative activity profile of its assigned enhancers (blue shades). (b) Distribution of the number of enhancers assigned to developmental TFs with biased expression in limb (P = 5e-19 vs. housekeeping), forebrain (P = 8e-15), and heart (P = 3e-25) (two sided Mann-Whitney tests). Box plots show median, interquartile values, range, and outliers (individual points). (c) Complete spectrum of genes with at least one assigned enhancer, sorted by decreasing enhancer numbers. Limb-biased TFs are highlighted in green. (d) Total number of enhancers (in all tissues analyzed) assigned to each TF in (c), with the number of assigned enhancers predicted specifically in limb at E11.5 (dark green) or any other stage analyzed (light green).
Studies of individual loci have identified examples of mammalian enhancers near the same gene with remarkably similar spatiotemporal activity patterns or functions15,27–32, reminiscent of invertebrate “shadow enhancers”8,9,33–35. The lack of dramatic morphological phenotypes in our enhancer deletion mouse models suggests that panels of mammalian enhancers with large degrees of redundancy act as a regulatory buffer for key developmental processes, thereby reducing the likelihood of severe consequences from genetic or environmental challenges8. Although individual examples of enhancers whose loss leads to severe phenotypes have been described (e.g. refs. 4,36), our findings suggest that redundancy is the far more common scenario. As indicated by the phenotypes observed in sensitized genetic backgrounds, our results suggest that pairs of enhancers act redundantly in organismal patterning, but additively in establishing gene expression levels. This observation is consistent with high-throughput loss-of-function screens in cultured cells where the disruption of individual enhancers leads to measurable gene expression changes but rarely results in the complete loss of target gene expression37. It appears plausible to assume that such limited, yet specific contributions to overall gene expression levels are relevant for organismal fitness under specific pressures, thus subjecting enhancers to purifying selection over evolutionary time. Alternatively, additional tissue-specific functions may also explain the evolutionary constraint on these loci.
Importantly, our observations have implications for the interpretation of noncoding regulatory variants in relation to human phenotypes. Our findings suggest that many loss-of-function enhancer mutations will cause at most subtle phenotypes in humans. Thus, for many genetic loci, enhancer-associated disease phenotypes may be more likely to result from gain-of-function mutations that either expand enhancer activity38 or alter the position of enhancers relative to genes39.
Methods
Experimental Design
All animal work was reviewed and approved by the Lawrence Berkeley National Laboratory Animal Welfare Committee. All mice used in this study were housed at the Animal Care Facility (the ACF) at LBNL. Mice were monitored daily for food and water intake, and animals were inspected weekly by the Chair of the Animal Welfare and Research Committee and the head of the animal facility in consultation with the veterinary staff. The LBNL ACF is accredited by the American Association for the Accreditation of Laboratory Animal Care (AAALAC). Transgenic mouse assays and enhancer knockouts were performed in Mus musculus FVB strain mice. The following developmental stages were used in this study: embryonic day E10.5, E11.5, E12.5 and E18.5 mice. Animals of both sexes were used in the analysis. Sample size selection and randomization strategies were conducted as follows:
Transgenic mouse assays
Sample sizes were selected empirically based on our previous experience of performing transgenic mouse assays for >2,000 total putative enhancers (VISTA Enhancer Browser: https://enhancer.lbl.gov/). Mouse embryos were excluded from further analysis if they did not contain the reporter transgene or if the developmental stage was not correct. All transgenic mice were treated with identical experimental conditions. Randomization and experimenter blinding were unnecessary and not performed.
Enhancer knockouts
Sample sizes were selected empirically based on our previous studies15. All phenotypic characterization of knockout mice employed a matched littermate selection strategy. All phenotyped mice described in the paper resulted from crossing heterozygous enhancer deletion mice together to allow for the comparison of matched littermates of different genotypes. Embryonic samples used for in situ hybridizations, RNA-seq, and skeletal preparations were dissected and processed blind to genotype.
In vivo transgenic reporter assays
Enhancer names in this study are the unique identifiers used in the VISTA Enhancer Browser (http://enhancer.lbl.gov/; mm: originally identified in mouse, hs: originally identified in human). Transgenic results for most enhancers were previously reported13–16. Newly tested enhancers (hs1586 at E10.5 and hs1262) were amplified from human genomic DNA and cloned into an hsp68-lacZ expression vector as previously described14. Genomic coordinates of all enhancers are listed in Supplementary Table 1. LacZ transgenic mouse assays were conducted as previously described14,40. To directly compare the activity domains between apparently redundant enhancers, enhancers were cloned using Gateway (Thermo Fisher Scientific) or Gibson41 methods into an hsp68-based reporter vector similar to that described above, with the exception of a fluorescent reporter replacing LacZ. The enhancer-reporter combinations were generated as follows: mm1179-sfGFP, hs1586-mCherry, hs741-sfGFP and hs1262-mCherry. sfGFP is a fusion of Sun1 and 2xsfGFP as described42 and localizes to the nuclear membrane. Mice carrying the individual fluorescent reporter transgenes were then generated via pronuclear injection (using FVB strain zygotes) and stable lines were established from founders showing reproducible reporter activity in the embryonic limb.
Generation of enhancer knockout mice using CRISPR/Cas9
Mouse strains missing limb enhancer(s) or harboring gene loss-of-function alleles were generated using in vivo CRISPR/Cas9 editing, as previously described with only minor modifications43,44. Pairs of single guide RNAs (sgRNAs) targeting genomic sequence 5′ and 3′ of the sequence to be deleted were designed using CHOPCHOP45 (see Supplementary Table 1 for sgRNA sequences and coordinates of deleted regions). Knockout mice were engineered as described previously46 using a mix containing Cas9 mRNA (final concentration of 100 ng/ul) and two sgRNAs (25 ng/ul each) in injection buffer (10 mM Tris, pH 7.5; 0.1 mM EDTA). This mix was injected into the cytoplasm of single-cell FVB strain mouse embryos. Founder (F0) mice were genotyped using PCR with High Fidelity Platinum Taq Polymerase (Thermo Fisher) to identify those with the desired NHEJ-generated deletion breakpoints (see Extended Data Figs 1a–j, 5a–c, 7a, d and Supplementary Table 3 for genotyping strategy, primer sequences and PCR amplicons). Sanger sequencing was used to identify and confirm deletion breakpoints in F0 and F1 mice (Extended Data Figs 1a–j, 5a–c, 7a, d). Unless noted otherwise, mice homozygous-null for the targeted limb enhancers showed normal pre- and postnatal viability and appeared outwardly normal. For iterative CRISPR/Cas9 genome editing fertilized mouse eggs harboring the primary deletion were collected and injected with sgRNAs targeting the secondary enhancer for deletion. Only those founder lines harboring both deletions on the same haplotype were analyzed further.
In situ hybridization and skeletal preparations
To assess spatial changes in gene expression in mouse embryonic limbs, whole mount in situ hybridization using digoxigenin-labeled antisense riboprobes was carried out as previously described46. Forelimbs and hindlimbs from at least three independent embryos were analyzed for each genotype (including wild-type littermate controls). Mouse embryonic skeletons at E18.5 were stained with Alcian blue and Alizarin red to differentiate cartilage (blue) and bone (red) using standard methods47. For comparison of limb skeletons from enhancer knockout embryos and wild-type littermates, general parameters such as bone number, shape, length, position or mineralization were assessed. Embryonic limbs and limb skeletons were imaged, and skeletal elements were measured, using a Leica MZ16 stereo-microscope coupled to a Leica DFC300Fx or DFC420 digital camera. Brightness and contrast were adjusted uniformly using Photoshop CS5. Measurements of the ossified portions of humerus and femur (stylopodial elements) were normalized to those of the ulna and tibia (related zeugopodal elements), respectively (as shown in Figs 2d, 3b and Extended Data Figs 5i, 8c).
Quantitative real-time PCR (qPCR) and RNA-seq
RNA was isolated from microdissected forelimbs or hindlimbs of mouse embryos at E11.5 using the Ambion RNAqueous Total RNA Isolation Kit (Life Technologies) according to manufacturer instructions. For qPCR, RNA was treated with RNase-free DNase (Promega) and reverse transcribed using SuperScript III (Life Technologies) with random hexamer or poly-dT priming according to manufacturer instructions. qPCR was performed on a LightCycler 480 (Roche) using KAPA SYBR FAST qPCR Master Mix (Kapa Biosystems) according to manufacturer instructions. qPCR primers (listed in Supplementary Table 4) were designed in silico using Primer3 (http://primer3.wi.mit.edu/), and amplicons span exon-exon junctions in order to prevent amplification of genomic DNA. Relative gene expression levels were calculated using the 2-ΔΔCT method48, normalized to the Actb housekeeping gene, and the mean of wild-type control samples was set to 1.
For RNA-seq, RNA samples were DNase treated (TURBO DNA-free Kit, Life Technologies), and RNA quality was verified using a 2100 Bioanalyzer (Agilent) with an RNA 6000 Nano Kit (Agilent). RNA-seq libraries were generated using the TruSeq Stranded mRNA Sample Prep Kit (Illumina), following the manufacturer instructions, and purified, eluted, and quantified as described previously49. RNA-seq libraries were pooled (four per lane) and sequenced using single end 50 bp reads on a HiSeq 4000 (Illumina).
Immunofluorescence
Mouse embryonic limbs at E10.5, E11.5 or E12.5 were dissected in cold PBS and fixed in 4% PFA for 2–3 hours. Following incubation in a sucrose gradient and embedding in a 1:1 mixture of 30% Sucrose and OCT, sagittal 10 μm frozen sections were cut using a cryostat. Cryosections were incubated overnight with the following primary antibodies: chicken anti-GFP (1:500, Thermo Fisher Scientific, A10262), rabbit anti-mCherry (1:1,000, Thermo Fisher Scientific, PA5-34974) and goat anti-Sox9 (1:500, R&D Systems, AF3075). Goat-anti chicken, goat anti-rabbit and donkey anti-goat secondary antibodies conjugated to Alexa Fluor 488, 568, 594 or 647 (1:1,000, Thermo Fisher Scientific) were used for detection. Hoechst 33258 (Sigma) was utilized to counterstain nuclei. Fluorescent images were acquired using a Zeiss AxioImager fluorescence microscope in combination with a Hamamatsu Orca-03 camera. Brightness and contrast were adjusted uniformly using Photoshop CS5.
ChIP-seq
For each of six single enhancer knockout lines, ChIP-seq to H3K27ac was performed using a protocol optimized for mouse embryonic tissues50. Briefly, forelimb buds from ten wildtype embryos (four biological replicates) and ten enhancer KO embryos (at least 2 biological replicates) were dissected at E11.5, formaldehyde crosslinked, and sheared using a Diagenode Bioruptor Sonicator. After pre-clearing, chromatin was incubated with anti-H3K27ac antibody (Active Motif cat no. 39133) for 2 hours at 4°C. Freshly rinsed Dynabeads (1:1 Protein A/Protein G mix) were then added to the antibody-treated chromatin, and immunoprecipitation was performed on a rotator for 30 min at 4°C. Libraries were prepared using the Illumina Truseq DNA sample prep kit following the manufacturer instructions with minor modifications. Library quality was assessed using a 2100 Bioanalyzer with the High Sensitivity DNA Kit (Agilent), and quantification was performed using a Qubit Fluorometer with the dsDNA HS Assay Kit (Life Technologies). ChIP-seq and input libraries were pooled and sequenced via single end 50 bp reads on a HiSeq 2000 or 4000 (Illumina).
RNA-seq and ChIP-seq analysis
ChIP-seq and RNA-seq data analysis from limb enhancer KO and related wild-type control samples was performed as follows: CASAVA v1.8.0 (Illumina) was utilized to demultiplex data, and reads with CASAVA ‘Y’ flag (purity filtering) were discarded. For each sample, between 12 – 55 (ChIP-seq) or 23 – 71 (RNA-seq) million reads were obtained following quality filtering and adaptor trimming using cutadapt_v1.1 (https://cutadapt.readthedocs.io/) with parameter ‘-m 25 -q 25’. Mouse genome sequence (mm9) and gene annotations were retrieved from the iGenomes repository (https://support.illumina.com/sequencing/sequencing_software/igenome.html).
For alignment of the RNA-seq reads to the mouse reference genome and transcriptome, Tophat v2.0.651 was used, and the reads mapping to UCSC known genes were counted by HTSeq52. Genes with counts per million (CPM) >1 in at least two samples were processed for further differential gene expression analysis comparing enhancer knockout and wild-type control samples using edgeR53. In each case, the top 100 differentially expressed genes, sorted by false discovery rate (FDR), are listed in Supplementary Tables 5–7.
For read mapping and peak calling of ChIP-seq datasets, bowtie54 (version 0.12.8) with parameter ‘-m 1 -v 2’ and MACS55 (version 1.4.2) with parameter ‘--mfold=10,30 –nomodel -p 0.0001’ were used, respectively. Biological replicates were combined using MSPC56, with the following parameters: -r biological -s 1E-10 -W 1E-6 -m Highest -c 2. The predicted enhancer intervals were assigned the best p-value (as defined by MACS55) among the overlapping peaks.
ENCODE ChIP-seq data analysis
Raw data was downloaded from the Data Coordination Center (DCC) of the ENCODE project (http://www.encodeproject.org/, see Supplementary Table 8 for the complete list of sample identifiers). Short reads were aligned to the mm10 assembly of the mouse genome using bowtie54, with the following parameters: -a -m 1 -n 2 -l 32 -e 3001. Peak calling was performed using MACS v1.455, with the following arguments: --gsize=mm --bw=300 --nomodel --shiftsize=100. Experiment-matched input DNA was used as control.
ENCODE RNA-seq data analysis
Raw data was downloaded from the ENCODE Data Coordination Center (DCC) (http://www.encodeproject.org/, see Supplementary Table 8 for the complete list of sample identifiers). Short reads were aligned to the mm10 assembly of the mouse genome using Tophat v2.0.857 and Gencode vM358 as the reference transcriptome. Cuffnorm v2.2.151 was run to quantify transcripts across conditions using the Gencode vM358 transcriptome as the reference and setting -library-norm-method to geometric. Only genes with a level of expression of at least one RPKM (Reads Per Kilobase of exons per Million mapped reads) in at least one of the considered conditions were included in further analyses. Small and non-coding RNAs were excluded by retaining only those genes with a Gencode biotype58 supporting protein-coding functionality.
Classifying genes by tissue-biased patterns of expression
For each protein-coding gene in the mouse genome, the expression variability across the twenty-nine ENCODE RNA-seq experiments from multiple tissues and developmental time points was evaluated using two metrics:
A measure of tissue-specificity (Tau, as described in ref. 59) ranging from 0 (consistent expression across all conditions) to 1 (expression in one single condition);
A measure of relative expression in a condition of interest (for example, limb at E11.5). Given a gene, this was defined as the difference between the percentile of expression of the gene in the given condition and the median percentile of expression across all the samples. A large positive number indicates a gene that is much more expressed in the condition of interest than the average.
Tissue-biased genes were defined as showing Tau >= 0.7 and relative expression higher than the 95th percentile. Housekeeping genes were defined as having Tau <= 0.4 and relative expression between the 5th and 95th percentiles. The complete lists of genes assigned to each category are available in Supplementary Table 9.
Gene classification based on pre-specified functional categories
Tissue-biased developmental transcription factors (sometimes referred to as tissue-specific transcription factors) were defined as genes with biased expression in a given tissue (see previous section), associated with abnormal developmental phenotypes in the same tissue (terms extracted from the Mouse Genome Informatics [MGI] database60, listed in Supplementary Table 10) and annotated as transcription factor under the terms GO:0003700 or GO:0003705 in The Gene Ontology61. Annotations were downloaded from GO and MGI on July 7, 2016.
Topologically Associated Domains (TADs)
TAD coordinates26 estimated from mouse ESC Hi-C data were downloaded from http://chromosome.sdsc.edu/mouse/hi-c/download.html. Coordinates were converted from mm9 to mm10 using liftOver62.
A statistical framework defining enhancer-promoter associations genome-wide
A list of putative enhancer regions was first defined as follows: after excluding any region annotated to the mitochondrial or any random chromosome, the BED coordinates of the H3K27ac peaks across the twenty-nine conditions (different combinations of tissue and developmental stage as defined by the ENCODE consortium, see ENCODE ChIP-seq data analysis section above) were merged using the mergeBed utility from BEDTools v2.17.063. For a more robust signal estimation (see below) regions shorter than 500 bp were enlarged to 1 kbp from their central coordinate. Promoters, defined as regions within 2.5 kbp of the transcriptional start sites of genes annotated in Gencode vM358, were then excluded using subtractBed from BEDTools v2.17.063. After that, any remaining region shorter than 1 kbp was excluded. Uniquely aligned, de-duplicated reads were then used to quantify the H3K27ac signals at each region, for each one of the 29 conditions. These signals were measured using the coverageBed utility from BEDTools v2.17.063, normalized to RPKM (according to the sequencing depth of each specific sample), and log2-transformed. The resulting list of 74,366 predicted enhancers and their corresponding H3K27ac signal quantifications, along with the mRNA expression measurements for the protein-coding genes (as defined in the section Classifying genes by tissue-biased patterns of expression), were used as input for the statistical framework described below. The main steps of the approach are also outlined in Extended Data Fig. 9b.
For each previously defined TAD in the mouse genome26, we retrieved all of the 1) enhancers predicted and 2) the genes expressed in at least one of the twenty-nine conditions considered that fell within that TAD. Pairwise correlations between all possible enhancer-gene combinations within the TAD were then evaluated by calculating the Spearman’s rank correlation coefficient (SCC or rho) between the H3K27ac pattern of enrichment at the enhancer and the mRNA expression of the gene across the conditions. Each putative enhancer was initially assigned to the gene showing the highest rho value (in the very rare case of ties, all of the genes showing the same rho value were assigned to the enhancer). After that, a null distribution of rho values was estimated empirically, by pairing the enhancer with 1,000 randomly picked genes from the same chromosome. The z-score for the correlation coefficient was then calculated by subtracting the mean and dividing by the standard deviation estimated from the empirical null. The corresponding p-value was calculated using the pnorm function in R. Finally, only those putative enhancers showing a p-value <= 0.05 and a rho >= 0.25 were retained, resulting in a set of 34,882 enhancers with an assigned target (Supplementary Table 11). Considering the entire, genome-wide set of pairwise associations, a p = 0.05 corresponds to a Benjamini-Hochberg corrected FDR of 0.087. This analysis resulted in the assignment of one or more putative enhancers to 9,365 protein-coding genes (Supplementary Table 12). In order to define a set of genes with many redundant enhancers, we considered enhancers as redundant only if they were associated with the same gene by correlation and showed a strong peak of H3K27ac in the same exact tissue under examination (e.g. both enhancers are active in limb and linked to the Gli3 gene). While this correlative approach may result in a subset of false-positive assignments for individual genes, it enables an approximation of both regulatory complexity and potential enhancer redundancy across the entire genome. 1,276 genes show multiple assigned enhancers such that at least five of the enhancers are all active in the same tissue (limb, heart, or brain). We then used a permutation scheme to directly evaluate the statistical robustness of this conclusion (i.e. 1,276 genes with 5 or more redundant enhancers in either developing limbs, heart or forebrain), which considered increasingly higher correlation values between the activity of putative enhancers and expression of genes (Extended Data Figure 10c–f). By re-shuffling the expression values of each gene across conditions (100 genome-wide permutations), we estimated the FDR of observing a gene with 5 or more enhancers attached to it, for increasingly larger correlation coefficients. Each permutation consisted of the very same enhancers and genes, in which the H3K27ac values were left as in the actual data while the RNA expression values of the genes across the different samples were randomly re-shuffled. For each genome-wide permuted matrix, the entire statistical approach described above was re-run and a map of enhancer-promoter associations was devised. For each value of the Spearman’s Correlation Coefficient (0.25 to 0.75, with a 0.01 step) the number of genes showing five or more enhancers in the permuted data was calculated. The average across the 100 iterations was then computed, and used for FDR estimation. This was calculated as the average number of genes showing five or more enhancers across the permuted data, over the number of genes derived from the actual data.
Statistical Analysis
Statistical analyses are described in detail in the respective Methods sections above. Whenever a p-value is reported in the text, the statistical test is also indicated. Unless specified otherwise, all the statistics were estimated and the plots were drawn using the statistical computing environment R (www.r-project.org) or the GraphPad Prism 7 software package.
Data Availability
ChIP-seq and RNA-seq datasets are available in the NCBI GEO database with the accession code GSE93730. Additional data supporting the findings of this study are available from the corresponding authors upon reasonable request.
Extended Data
Extended Data Figure 1. CRISPR-deletion of ten limb enhancers and regulatory interaction landscape of associated target genes.
(a–j) Left panels: Representative activity patterns of the selected enhancers in mouse embryos at E11.5 (VISTA enhancer browser)13 and the respective genomic enhancer region (Tg, blue bar) along with the region deleted in enhancer knockout mice (Del, red bar). Corresponding H3K27 acetylation patterns (green) in wild-type mouse embryonic forelimbs at E11.5 (this study) are depicted with open chromatin (ENCODE DHS in forelimbs at E11.5, purple) and the Placental Mammal basewise conservation track by PhyloP (Cons, blue/red). Scale bars, 500 bp. VISTA enhancer IDs (mm and hs numbers) are indicated on the left, with the distance of the enhancer from the transcriptional start site of the predicted target gene in the mouse genome. Numbers in the bottom right of each embryo indicate reproducibility of enhancer reporter assay. Arrowheads mark additional activity domains (other than limb): hs1262 (hindbrain, reproducibility: 5/6, also shown previously17), mm917 (dorsal root ganglion, 7/7) and hs1603 (nose, 7/7; and branchial arch, 5/7). Asterisk indicates potential craniofacial enhancer activity for mm636, which was observed in 3/9 embryos64. Right panels: PCR validation strategy and results for enhancer KO lines. Red scissors indicate CRISPR-mediated deletion breakpoints. PCR was used to detect the wild-type (+) and enhancer deletion (Δ) alleles. Below, Sanger sequencing traces show the deletion breakpoints (indicated by the dashed line) for the enhancer KO alleles. PCR genotyping results are shown with amplicon sizes indicated on the left (enhancer deletion allele in red). Primers (Ctrl or Ctrl2) amplifying an unrelated genomic region were included as a PCR positive control. See Supplementary Table 3 for all primer sequences and related PCR product sizes. (k) Top: Hi-C interaction heatmaps of topologically associated chromatin domains (mESC TADs)26. Bottom: Selected enhancers (blue triangles) and their predicted target genes (TSS indicated as black bar). The Capture-C UCSC browser track (purple) illustrates three-dimensional chromatin interaction profiles from E11.5 embryonic limbs (3kb window) using promoters of the predicted enhancer target genes as viewpoints22. H3K27ac enrichment (green) in wildtype forelimbs at E11.5 (this study) is shown below. Six of the ten enhancers selected for deletion analysis display local Capture-C enrichment (marked by “*”), indicating physical interaction with the predicted target gene promoter at E10.5 or E11.5, based on the stringent statistical approach (95th percentile threshold) applied in the original study22. Other genes present in the TAD are shown in gray.
Extended Data Figure 2. No major differences in expression of predicted target genes in individual enhancer knockouts.
(a) Spatial enhancer activity domains (LacZ, see also Fig. 1b) are compared to mRNA expression domains (by in situ hybridization) of the predicted target gene in embryonic fore- and hindlimbs at E11.5. No significant changes in expression patterns were observed in enhancer knockouts compared to wild-type limbs, except in limbs lacking hs741, where a small subdomain of target gene expression was lost (red arrowhead marks loss of the posterior Shox2 domain in the distal limb). Transcript distribution was reproduced in at least n=3 independent biological replicates. (b) Quantitative real-time PCR using limbs of homozygous null (KO, red dots) and wild-type (Wt, blue dots) embryos at E11.5 reveals lack of significantly downregulated transcript levels of predicted enhancer target genes in 9/10 cases. Box plots indicate median, interquartile values, range and individual biological replicates. Outliers are shown as circled data points. **, P=0.0012, unpaired, two-tailed t-test. n.s., not significant. Scale bars, 100 μm.
Extended Data Figure 3. Absence of obvious morphological abnormalities in limb enhancer knockouts.
Side-by-side comparison of enhancer KO limb skeletons with wild-type littermate controls at E18.5. Neither forelimbs (this figure) nor hindlimbs (data not shown) of the enhancer KO lines revealed any obvious morphological differences in comparison to wild-type littermates. Cartilage is stained blue and bone dark red. The number of embryos with normal limb phenotypes over the total number of homozygous-null embryos examined is shown in the bottom left. “n”, number of independent biological replicates with similar results. Scale bar, 1 mm.
Extended Data Figure 4. Absence of compensatory enhancer signatures in limbs of enhancer KO embryos.
(a) Layered ChIP-seq H3K27 acetylation (ac) profiles surrounding the deleted enhancers and from wild-type (blue, n=4 independent biological replicates) and enhancer knockout embryos (orange, at least n=2 biological replicates). For all samples, E11.5 forelimb was profiled. For display, replicates were merged using bigWigMerge (UCSC tools) and normalized. Red triangles indicate the position of individual enhancer deletions. (b) H3K27ac enrichments in targeted regions marked by red triangles in A, showing the absence of H3K27ac at the deletion site in individual enhancer knockout (orange) compared to wild-type (blue) samples. Blue bars indicate location of enhancer sequences. Dashed red lines demarcate the region deleted by CRISPR. Vertebrate basewise conservation track by PhyloP (Cons) is shown.
Extended Data Figure 5. Transcriptional and phenotypic impact of dual enhancer deletions engineered by iterative CRISPR/Cas9 genome editing.
(a–c) Upper panels: Enhancer pairs with overlapping limb activities (LacZ), coinciding with domains of predicted target gene expression visualized by in situ hybridization (ISH). For Sox9 enhancers, black arrowheads indicate overlapping domains. Schematics: Double enhancer deletion strategy to delete the three enhancer pairs with overlapping activity (see Methods). Gray numbers indicate enhancer distance (in kb) from the transcriptional start site (TSS). Lower panels: Sanger sequencing verification of the secondary enhancer deletion. Deletion breakpoint is marked by the dashed line. Gray horizontal bars indicate bases present in the primary deletions (single enhancer KO lines, see Extended Data Fig. 1a–j). Shox2- and Sox9- associated LacZ panels are also used in Extended Data Fig. 2. (d) Gli3 transcript distribution (ISH) in wildtype (Wt) and mm1179/hs1586 double enhancer knockout (DKO) embryos. Arrowhead points to reduced Gli3 transcript in the anterior limb mesenchyme. Dashed line indicates dissected hand plate for RNA-seq. (e) RNA-seq confirmed significantly reduced Gli3 expression in hand plates of DKO, but not individual enhancer KO embryos (compared to wildtype hand plates). (f) Unaffected hindlimb morphology in mm1179/hs1586 DKO embryos. Red arrowhead points to digit 1 duplication in forelimbs (see also Fig. 2). (g) Shox2 expression (ISH) in fore- and hindlimbs of hs741/hs1262 double enhancer knockout (DKO) embryos. The distal-posterior domain (arrowhead) is dependent on hs741 (Extended Data Fig. 2). (h) Reduced Shox2 expression in fore- and hindlimbs of hs741/hs1262 DKO embryos (qPCR). Expression of the nearby Rsrc1 gene was unchanged. (i) Left: Representative limb skeletons of wildtype and hs741/hs1262 DKO embryos. Hu, humerus; Ul, ulna; Fe, femur; Ti, Tibia. Right: Mild but significant reduction in humerus ossification length (double arrows) in hs741/hs1262 DKO limb skeletons. ***, P=1.66×10⁻⁷ (two-tailed, unpaired t-test). (j) Absence of evident Sox9 expression differences or skeletal abnormalities in embryos lacking both the hs1467 and mm636 enhancers near Sox9. For ISH, transcript distribution was reproduced in at least n=3 independent biological replicates. “n”, number of independent biological replicates with similar results. For bar graphs and boxplots, individual biological replicates are shown as data points. Bar graphs illustrate mean and standard deviation (error bars). Box plot indicates median, interquartile values and range. ***, P < 0.001; **, P < 0.01 (two-tailed, unpaired t-test). n.s., not significant. Scale bars, 100 μm (white) and 500 μm (black).
Extended Data Figure 6. Cellular resolution of redundant Gli3 enhancer activities at the onset of digit formation.
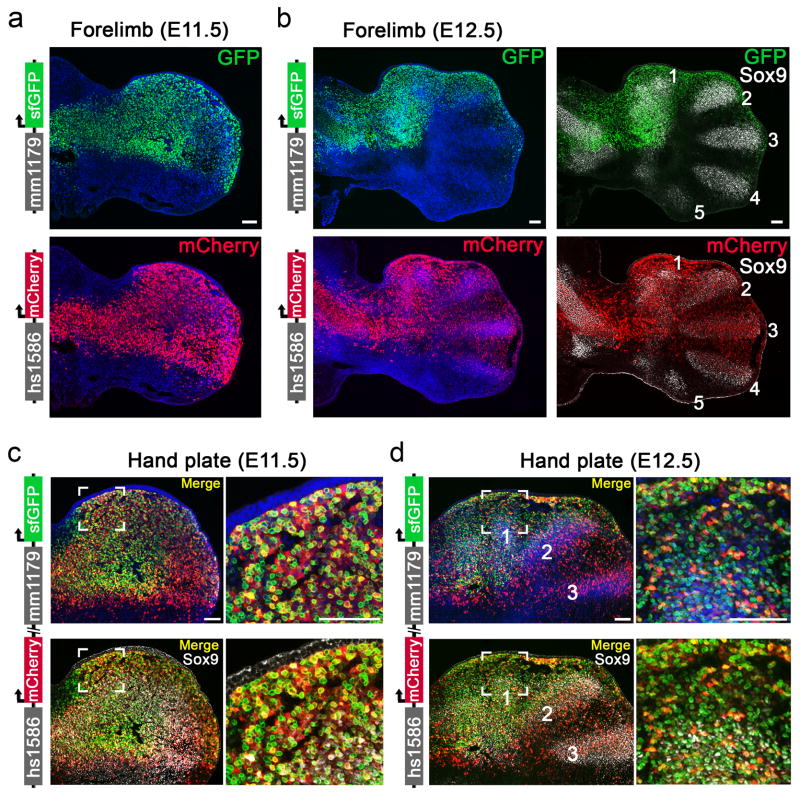
(a, b) Individual Gli3 enhancer activities as detected by immunofluorescence (mm1179: green, hs1586: red) in forelimbs of transgenic reporter embryos. Sox9 (gray) marks chondrogenic progenitors of the mesenchymal condensations forming digit primordia (digits 1–5, from anterior to posterior). (c, d) Co-localization of mm1179 and hs1586 enhancer activities in hand plates of double enhancer transgenic embryos. Close-ups (right panels) show that the anterior mesenchyme (Fig. 2c) harbors many cells with dual enhancer activities (yellow). A fraction of double enhancer positive cells carries the signature of Sox9 digit progenitors (white, bottom). n=3 independent embryos per genotype were analyzed, with similar results. Nuclei, detected via Hoechst, are colored blue. Scale bars, 100 μm (a, b) and 50 μm (c–f).
Extended Data Figure 7. Generation of Gli3 and Shox2 knockout alleles and characterization of enhancer deletions in a sensitized background.
(a, d) Top: Schematic showing CRISPR/Cas9-mediated deletions used to generate Gli3 and Shox2 loss-of-function alleles. Genotyping primers used to validate targeted deletion events are indicated. Middle: Sanger sequencing confirmation of deletion event, with grey and red dashed lines indicating breakpoints. Right: PCR genotyping examples are shown, and the size of the product specific for the deletion allele is depicted in red (primers listed in Supplementary Table 3). (b) In situ hybridization (ISH) showing the gradual decrease of anterior Gli3 transcript in forelimbs of wild-type, Gli3Δ/+ and sensitized mm1179, hs1586 double enhancer knockout (DKO/Gli3Δ) embryos. (c) Quantitative real-time PCR (qPCR) validation of Gli3 mRNA levels in forelimb hand plates from the genotypes shown in panel b. (e) Shox2 expression (ISH) in fore- and hindlimbs of wild-type, Shox2Δ/+ and sensitized hs741, hs1262 double enhancer knockout (DKO/Shox2Δ) embryos. Arrowheads point to the domains in enhancer DKO/Shox2Δ embryos where Shox2 expression is nearly abolished. (f) qPCR revealing significantly downregulated Shox2 mRNA levels in hindlimbs of DKO/Shox2Δ compared to Shox2Δ/+ embryos. “n” indicates the number of independent biological replicates with similar results. Bar plots illustrate mean and standard deviation (error bars), with individual biological replicates shown. ***, P < 0.001; *, P < 0.05 (two-tailed, unpaired t-test). n.s., not significant. For ISH, transcript distribution was reproduced in at least n=3 independent biological replicates. Scale bars, 100 μm.
Extended Data Figure 8. Limb phenotypes of individual and combinatorial Gli3 and Shox2 enhancer knockouts in presence of reduced target gene dosage.
(a) Skeletal phenotypes resulting from mm1179 and hs1586 enhancer deletions in combination with reduction to one copy of the Gli3 gene at E18.5. Genotypes are shown on the left with red crosses indicating elements deleted by CRISPR/Cas9. While forelimbs of Gli3Δ/+ embryos displayed bifurcated digit 1 terminal phalanges65, hindlimbs showed an extra toe structure but without detectable cartilage template. Four out of seven mm1179Δ/Gli3Δ embryos displayed additional bifurcation of digit 2 of the right forelimb, which suggests that removal of mm1179 reduces Gli3 levels in the anterior forelimb more than deletion of hs1586. An almost complete anterior extra toe forms in hindlimbs of embryos with single or dual enhancer deletions in the sensitized background (black asterisks). Loss of both Gli3 copies results in anterior hindlimb polydactyly with altered digit identities (red asterisks)24. (b) Allelic series depicts shortening of the stylopod (humerus and femur) in limb skeletons with individual or combined hs741 and hs1262 enhancer deletions in a Shox2 sensitized condition (see also Fig. 3b). Stylopod ossification length (double arrows) appears less reduced in forelimbs (humerus, Hu) than in hindlimbs (femur, Fe) of embryos lacking the activity of both enhancers (hs741Δ, hs1262Δ/Shox2Δ). Tibia (Ti) and ulna (Ul) were normal in all genotypes examined. (c) Humerus ossification length (normalized to ulna ossification length) is significantly reduced in embryos lacking either hs741 or hs1262 in the presence of only one copy of Shox2. In embryos lacking both enhancers in the sensitized background significant shortening of the humerus ossification is observed (compared to all other genotypes). “n” indicates the number of independent biological replicates with similar results. Box plots indicate median, interquartile values, range and individual biological replicates. ***, P < 0.001; *, P < 0.05 (two-tailed, unpaired t-test). Scale bars, 500 μm.
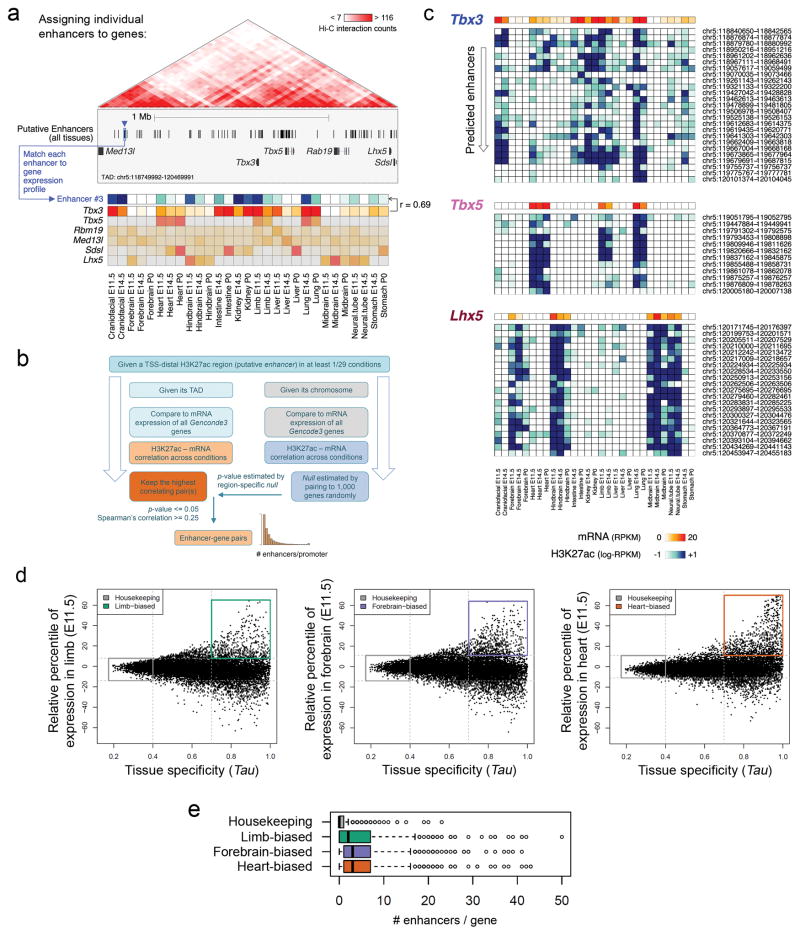
Extended Data Figure 9. A correlative framework to define enhancer-promoter associations across the mouse genome.
(a) The TAD including the transcriptional regulators Tbx3, Tbx5 and Lhx5 illustrates the statistical framework to define enhancer-promoter associations genome-wide. For each predicted enhancer, correlation between its H3K27ac signal (blue arrowhead, blue-shades heat map) with the mRNA expression profiles of every gene in the TAD (red-shades heat map) across all available tissues and developmental stages was assessed. The enhancer was then assigned to the most highly correlated gene, Tbx3 in the case of Enhancer #3. (b) Schematic depicting the underlying statistical framework used to determine genome-wide enhancer-promoter interactions (see Methods for a detailed description). (c) Activity pattern for the enhancers assigned to Tbx3, Tbx5 and Lhx5 genes. Genomic coordinates are listed on the right. For each predicted enhancer-gene pairing, Spearman’s Correlation Coefficient (SCC, n = 29) and the corresponding empirically estimated p-value (from 1,000 random enhancer-gene pairings) are shown in Supplementary Table 11. (d) Identifying genes with biased expression in embryonic limb, forebrain, or heart. Expression variability across 29 RNA-seq datasets from multiple tissues and developmental time points, measures of tissue specificity (Tau, x-axis) and specific tissue-biased expression at E11.5 (y-axis) for each protein-coding gene were calculated (see Methods for additional details). Housekeeping genes were defined as displaying Tau <= 0.4 and relative expression in the limb between the 5th and 95th percentiles. Tissue-biased genes were defined as showing Tau >= 0.7 and relative expression higher than the 95th percentile. (d) Distribution of enhancer numbers assigned to each gene, for the different gene categories. Genes with tissue-biased expression profiles were associated with a significantly higher number of enhancers than housekeeping genes. P = 4e-121 (n=553), P = 7e-97 (n=626) and P = 6e-83 (n=826) for limb, forebrain and heart biased genes, respectively (two sided Mann-Whitney tests). n = 1,287 for housekeeping genes. Box plots indicate median, interquartile values and range. Outliers are shown as individual points.
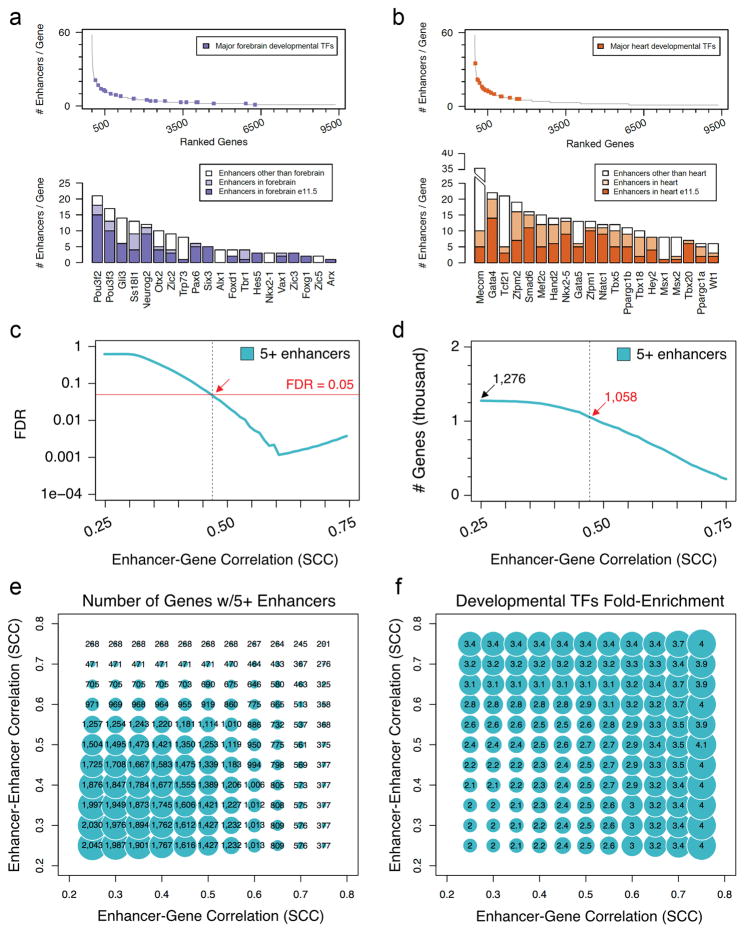
Extended Data Figure 10. Enhancer redundancy as a widespread feature of developmental genes and robustness to the choice of thresholds used in the correlative approach.
(a–b) Top panels: Number of enhancers assigned to each gene through the correlative framework, with developmental TFs showing biased expression in forebrain (a, blue dots) or heart (b, orange dots) indicated. Classification of tissue-biased developmental TFs is described in Methods. Genes with at least one assigned enhancer are displayed and sorted according to the number of assigned enhancers (left to right). Bottom panels: Bar plot showing the total number of enhancers assigned to each of the TFs highlighted in the top panels. For each gene, a color code shows the number of predicted enhancers assigned to that gene in the relevant tissue (A: heart, B: forebrain) at E11.5 (dark color), in the relevant tissue at any other developmental stage included in the analysis (light color), or in any other tissue (white). (c) Estimated FDR (based on genome-wide permutations, see Methods) of observing a gene with 5 or more enhancers assigned to it, for increasingly larger correlation coefficients (0.25 to 0.75). The red solid line indicates an FDR of 0.05. The red arrow and the black dashed line highlight the lowest correlation coefficient (0.47, considering a step of 0.01) with an FDR <= 0.05 (FDR = 0.0495). (d) Number of genes showing 5 or more enhancers assigned to them, for increasingly larger correlation coefficients (0.25 to 0.75). The total number of genes (SCC >= 0.25) along with the number of genes identified using the threshold set in (c) (SCC >= 0.47) is indicated (1,276 and 1,058, respectively; see Supplementary Tables 11 and 12). (e) Bubble plot showing the number of genes with 5 or more enhancers assigned to them, at increasingly higher correlation between enhancer-promoter (x-axis) and between enhancers assigned to the same gene (y-axis). (f) Bubble plot displaying the fold-enrichment (linear) for developmental transcription factor (TF) genes among each set in (c).
Supplementary Material
Acknowledgments
This work was supported by National Institutes of Health grants R01HG003988, U54HG006997, R24HL123879 and UM1HL098166 (to A.V. and L.A.P.) and the University of Basel and the Novartis Foundation for Biomedical Research (to J.L.-R.). M.O. was supported by a Swiss National Science Foundation (SNSF) fellowship. We thank Bing Ren for providing access to the ChIP-seq and RNA-seq data from ENCODE and Jennifer Doudna for providing a plasmid containing a human-optimized Cas9 gene. We thank Wenduo Ye and YiPing Chen for generously sharing the image of a Shox2-deficient limb skeleton (Figure 3b). We are grateful to the members of the L.A.P., A.V., and D.E.D. group for technical advice and useful comments on the manuscript, in particular Cailyn Spurrell and Evgeny Kvon. Research was conducted at the E.O. Lawrence Berkeley National Laboratory and performed under Department of Energy Contract DE-AC02-05CH11231, University of California.
Footnotes
The authors declare no competing financial interests
Author Contributions
M.O., D.E.D., A.V., and L.A.P. conceived the study. M.O., D.E.D., B.J.M, S.Y.A., E.A.L., Y.Z., I.P.-F., C.S.P., M.K., T.H.G., Q.T.P., A.N.H, J.A.A., and V.A performed the genome editing and mouse phenotyping studies. I.B. and M.O. devised the computational framework, and I.B. performed the correlative analysis. V.T. performed in situ hybridization (ISH) under the supervision of J.L.-R. Y.F.-Y. conducted the ChIP-seq and RNA-seq data analysis. M.O., D.E.D., A.V., and L.A.P. wrote the manuscript with input from the remaining authors.
References
- 1.Consortium EP. An integrated encyclopedia of DNA elements in the human genome. Nature. 2012;489:57–74. doi: 10.1038/nature11247. [DOI] [PMC free article] [PubMed] [Google Scholar]
- 2.Long HK, Prescott SL, Wysocka J. Ever-Changing Landscapes: Transcriptional Enhancers in Development and Evolution. Cell. 2016;167:1170–1187. doi: 10.1016/j.cell.2016.09.018. [DOI] [PMC free article] [PubMed] [Google Scholar]
- 3.Andrey G, Mundlos S. The three-dimensional genome: regulating gene expression during pluripotency and development. Development. 2017;144:3646–3658. doi: 10.1242/dev.148304. [DOI] [PubMed] [Google Scholar]
- 4.Sagai T, Hosoya M, Mizushina Y, Tamura M, Shiroishi T. Elimination of a long-range cis-regulatory module causes complete loss of limb-specific Shh expression and truncation of the mouse limb. Development. 2005;132:797–803. doi: 10.1242/dev.01613. [DOI] [PubMed] [Google Scholar]
- 5.Menke DB, Guenther C, Kingsley DM. Dual hindlimb control elements in the Tbx4 gene and region-specific control of bone size in vertebrate limbs. Development. 2008;135:2543–2553. doi: 10.1242/dev.017384. [DOI] [PubMed] [Google Scholar]
- 6.Shim S, Kwan KY, Li M, Lefebvre V, Sestan N. Cis-regulatory control of corticospinal system development and evolution. Nature. 2012;486:74–79. doi: 10.1038/nature11094. [DOI] [PMC free article] [PubMed] [Google Scholar]
- 7.Hay D, et al. Genetic dissection of the alpha-globin super-enhancer in vivo. Nat Genet. 2016;48:895–903. doi: 10.1038/ng.3605. [DOI] [PMC free article] [PubMed] [Google Scholar]
- 8.Frankel N, et al. Phenotypic robustness conferred by apparently redundant transcriptional enhancers. Nature. 2010;466:490–493. doi: 10.1038/nature09158. [DOI] [PMC free article] [PubMed] [Google Scholar]
- 9.Perry MW, Boettiger AN, Bothma JP, Levine M. Shadow enhancers foster robustness of Drosophila gastrulation. Curr Biol. 2010;20:1562–1567. doi: 10.1016/j.cub.2010.07.043. [DOI] [PMC free article] [PubMed] [Google Scholar]
- 10.Montavon T, et al. A regulatory archipelago controls Hox genes transcription in digits. Cell. 2011;147:1132–1145. doi: 10.1016/j.cell.2011.10.023. [DOI] [PubMed] [Google Scholar]
- 11.Petit F, Sears KE, Ahituv N. Limb development: a paradigm of gene regulation. Nat Rev Genet. 2017 doi: 10.1038/nrg.2016.167. [DOI] [PubMed] [Google Scholar]
- 12.Zeller R, Lopez-Rios J, Zuniga A. Vertebrate limb bud development: moving towards integrative analysis of organogenesis. Nat Rev Genet. 2009;10:845–858. doi: 10.1038/nrg2681. [DOI] [PubMed] [Google Scholar]
- 13.Visel A, Minovitsky S, Dubchak I, Pennacchio LA. VISTA Enhancer Browser--a database of tissue-specific human enhancers. Nucleic Acids Res. 2007;35:D88–92. doi: 10.1093/nar/gkl822. [DOI] [PMC free article] [PubMed] [Google Scholar]
- 14.Pennacchio LA, et al. In vivo enhancer analysis of human conserved non-coding sequences. Nature. 2006;444:499–502. doi: 10.1038/nature05295. [DOI] [PubMed] [Google Scholar]
- 15.Attanasio C, et al. Fine tuning of craniofacial morphology by distant-acting enhancers. Science. 2013;342:1241006. doi: 10.1126/science.1241006. [DOI] [PMC free article] [PubMed] [Google Scholar]
- 16.Osterwalder M, et al. HAND2 targets define a network of transcriptional regulators that compartmentalize the early limb bud mesenchyme. Dev Cell. 2014;31:345–357. doi: 10.1016/j.devcel.2014.09.018. [DOI] [PMC free article] [PubMed] [Google Scholar]
- 17.Rosin JM, Abassah-Oppong S, Cobb J. Comparative transgenic analysis of enhancers from the human SHOX and mouse Shox2 genomic regions. Hum Mol Genet. 2013;22:3063–3076. doi: 10.1093/hmg/ddt163. [DOI] [PubMed] [Google Scholar]
- 18.Cobb J, Dierich A, Huss-Garcia Y, Duboule D. A mouse model for human short-stature syndromes identifies Shox2 as an upstream regulator of Runx2 during long-bone development. Proc Natl Acad Sci U S A. 2006;103:4511–4515. doi: 10.1073/pnas.0510544103. [DOI] [PMC free article] [PubMed] [Google Scholar]
- 19.Akiyama H, Chaboissier MC, Martin JF, Schedl A, de Crombrugghe B. The transcription factor Sox9 has essential roles in successive steps of the chondrocyte differentiation pathway and is required for expression of Sox5 and Sox6. Genes Dev. 2002;16:2813–2828. doi: 10.1101/gad.1017802. [DOI] [PMC free article] [PubMed] [Google Scholar]
- 20.Kawakami Y, et al. Sall genes regulate region-specific morphogenesis in the mouse limb by modulating Hox activities. Development. 2009;136:585–594. doi: 10.1242/dev.027748. [DOI] [PMC free article] [PubMed] [Google Scholar]
- 21.Min H, et al. Fgf-10 is required for both limb and lung development and exhibits striking functional similarity to Drosophila branchless. Genes Dev. 1998;12:3156–3161. doi: 10.1101/gad.12.20.3156. [DOI] [PMC free article] [PubMed] [Google Scholar]
- 22.Andrey G, et al. Characterization of hundreds of regulatory landscapes in developing limbs reveals two regimes of chromatin folding. Genome Res. 2017;27:223–233. doi: 10.1101/gr.213066.116. [DOI] [PMC free article] [PubMed] [Google Scholar]
- 23.Hui CC, Joyner AL. A mouse model of greig cephalopolysyndactyly syndrome: the extra-toesJ mutation contains an intragenic deletion of the Gli3 gene. Nat Genet. 1993;3:241–246. doi: 10.1038/ng0393-241. [DOI] [PubMed] [Google Scholar]
- 24.Lopez-Rios J, et al. GLI3 constrains digit number by controlling both progenitor proliferation and BMP-dependent exit to chondrogenesis. Dev Cell. 2012;22:837–848. doi: 10.1016/j.devcel.2012.01.006. [DOI] [PMC free article] [PubMed] [Google Scholar]
- 25.Ye W, et al. A unique stylopod patterning mechanism by Shox2-controlled osteogenesis. Development. 2016;143:2548–2560. doi: 10.1242/dev.138750. [DOI] [PMC free article] [PubMed] [Google Scholar]
- 26.Dixon JR, et al. Topological domains in mammalian genomes identified by analysis of chromatin interactions. Nature. 2012;485:376–380. doi: 10.1038/nature11082. [DOI] [PMC free article] [PubMed] [Google Scholar]
- 27.Marinic M, Aktas T, Ruf S, Spitz F. An integrated holo-enhancer unit defines tissue and gene specificity of the Fgf8 regulatory landscape. Dev Cell. 2013;24:530–542. doi: 10.1016/j.devcel.2013.01.025. [DOI] [PubMed] [Google Scholar]
- 28.Visel A, et al. A high-resolution enhancer atlas of the developing telencephalon. Cell. 2013;152:895–908. doi: 10.1016/j.cell.2012.12.041. [DOI] [PMC free article] [PubMed] [Google Scholar]
- 29.Lam DD, et al. Partially redundant enhancers cooperatively maintain Mammalian pomc expression above a critical functional threshold. PLoS Genet. 2015;11:e1004935. doi: 10.1371/journal.pgen.1004935. [DOI] [PMC free article] [PubMed] [Google Scholar]
- 30.Yao Y, et al. Cis-regulatory architecture of a brain signaling center predates the origin of chordates. Nat Genet. 2016;48:575–580. doi: 10.1038/ng.3542. [DOI] [PMC free article] [PubMed] [Google Scholar]
- 31.Antosova B, et al. The Gene Regulatory Network of Lens Induction Is Wired through Meis-Dependent Shadow Enhancers of Pax6. PLoS Genet. 2016;12:e1006441. doi: 10.1371/journal.pgen.1006441. [DOI] [PMC free article] [PubMed] [Google Scholar]
- 32.Will AJ, et al. Composition and dosage of a multipartite enhancer cluster control developmental expression of Ihh (Indian hedgehog) Nat Genet. 2017 doi: 10.1038/ng.3939. [DOI] [PMC free article] [PubMed] [Google Scholar]
- 33.Hong JW, Hendrix DA, Levine MS. Shadow enhancers as a source of evolutionary novelty. Science. 2008;321:1314. doi: 10.1126/science.1160631. [DOI] [PMC free article] [PubMed] [Google Scholar]
- 34.Barolo S. Shadow enhancers: frequently asked questions about distributed cis-regulatory information and enhancer redundancy. Bioessays. 2012;34:135–141. doi: 10.1002/bies.201100121. [DOI] [PMC free article] [PubMed] [Google Scholar]
- 35.Cannavo E, et al. Shadow Enhancers Are Pervasive Features of Developmental Regulatory Networks. Curr Biol. 2016;26:38–51. doi: 10.1016/j.cub.2015.11.034. [DOI] [PMC free article] [PubMed] [Google Scholar]
- 36.Yanagisawa H, Clouthier DE, Richardson JA, Charite J, Olson EN. Targeted deletion of a branchial arch-specific enhancer reveals a role of dHAND in craniofacial development. Development. 2003;130:1069–1078. doi: 10.1242/dev.00337. [DOI] [PubMed] [Google Scholar]
- 37.Fulco CP, et al. Systematic mapping of functional enhancer-promoter connections with CRISPR interference. Science. 2016;354:769–773. doi: 10.1126/science.aag2445. [DOI] [PMC free article] [PubMed] [Google Scholar]
- 38.Lettice LA, Hill AE, Devenney PS, Hill RE. Point mutations in a distant sonic hedgehog cis-regulator generate a variable regulatory output responsible for preaxial polydactyly. Hum Mol Genet. 2008;17:978–985. doi: 10.1093/hmg/ddm370. [DOI] [PubMed] [Google Scholar]
- 39.Lupianez DG, et al. Disruptions of topological chromatin domains cause pathogenic rewiring of gene-enhancer interactions. Cell. 2015;161:1012–1025. doi: 10.1016/j.cell.2015.04.004. [DOI] [PMC free article] [PubMed] [Google Scholar]
- 40.Kothary R, et al. Inducible expression of an hsp68-lacZ hybrid gene in transgenic mice. Development. 1989;105:707–714. doi: 10.1242/dev.105.4.707. [DOI] [PubMed] [Google Scholar]
- 41.Gibson DG, et al. Enzymatic assembly of DNA molecules up to several hundred kilobases. Nat Methods. 2009;6:343–345. doi: 10.1038/nmeth.1318. [DOI] [PubMed] [Google Scholar]
- 42.Mo A, et al. Epigenomic Signatures of Neuronal Diversity in the Mammalian Brain. Neuron. 2015;86:1369–1384. doi: 10.1016/j.neuron.2015.05.018. [DOI] [PMC free article] [PubMed] [Google Scholar]
- 43.Yang H, et al. One-step generation of mice carrying reporter and conditional alleles by CRISPR/Cas-mediated genome engineering. Cell. 2013;154:1370–1379. doi: 10.1016/j.cell.2013.08.022. [DOI] [PMC free article] [PubMed] [Google Scholar]
- 44.Yang H, Wang H, Jaenisch R. Generating genetically modified mice using CRISPR/Cas-mediated genome engineering. Nat Protoc. 2014;9:1956–1968. doi: 10.1038/nprot.2014.134. [DOI] [PubMed] [Google Scholar]
- 45.Montague TG, Cruz JM, Gagnon JA, Church GM, Valen E. CHOPCHOP: a CRISPR/Cas9 and TALEN web tool for genome editing. Nucleic Acids Res. 2014;42:W401–407. doi: 10.1093/nar/gku410. [DOI] [PMC free article] [PubMed] [Google Scholar]
- 46.Kvon EZ, et al. Progressive Loss of Function in a Limb Enhancer during Snake Evolution. Cell. 2016;167:633–642 e611. doi: 10.1016/j.cell.2016.09.028. [DOI] [PMC free article] [PubMed] [Google Scholar]
- 47.Ovchinnikov D. Alcian blue/alizarin red staining of cartilage and bone in mouse. Cold Spring Harb Protoc. 2009;2009 doi: 10.1101/pdb.prot5170. pdb prot5170. [DOI] [PubMed] [Google Scholar]
- 48.Schmittgen TD, Livak KJ. Analyzing real-time PCR data by the comparative C(T) method. Nat Protoc. 2008;3:1101–1108. doi: 10.1038/nprot.2008.73. [DOI] [PubMed] [Google Scholar]
- 49.Dickel DE, et al. Genome-wide compendium and functional assessment of in vivo heart enhancers. Nat Commun. 2016;7:12923. doi: 10.1038/ncomms12923. [DOI] [PMC free article] [PubMed] [Google Scholar]
- 50.Nord AS, et al. Rapid and pervasive changes in genome-wide enhancer usage during mammalian development. Cell. 2013;155:1521–1531. doi: 10.1016/j.cell.2013.11.033. [DOI] [PMC free article] [PubMed] [Google Scholar]
- 51.Trapnell C, et al. Transcript assembly and quantification by RNA-Seq reveals unannotated transcripts and isoform switching during cell differentiation. Nat Biotechnol. 2010;28:511–515. doi: 10.1038/nbt.1621. [DOI] [PMC free article] [PubMed] [Google Scholar]
- 52.Anders S, Pyl PT, Huber W. HTSeq--a Python framework to work with high-throughput sequencing data. Bioinformatics. 2015;31:166–169. doi: 10.1093/bioinformatics/btu638. [DOI] [PMC free article] [PubMed] [Google Scholar]
- 53.Robinson MD, McCarthy DJ, Smyth GK. edgeR: a Bioconductor package for differential expression analysis of digital gene expression data. Bioinformatics. 2010;26:139–140. doi: 10.1093/bioinformatics/btp616. [DOI] [PMC free article] [PubMed] [Google Scholar]
- 54.Langmead B, Trapnell C, Pop M, Salzberg SL. Ultrafast and memory-efficient alignment of short DNA sequences to the human genome. Genome Biol. 2009;10:R25. doi: 10.1186/gb-2009-10-3-r25. [DOI] [PMC free article] [PubMed] [Google Scholar]
- 55.Zhang Y, et al. Model-based analysis of ChIP-Seq (MACS) Genome Biol. 2008;9:R137. doi: 10.1186/gb-2008-9-9-r137. [DOI] [PMC free article] [PubMed] [Google Scholar]
- 56.Jalili V, Matteucci M, Masseroli M, Morelli MJ. Using combined evidence from replicates to evaluate ChIP-seq peaks. Bioinformatics. 2015;31:2761–2769. doi: 10.1093/bioinformatics/btv293. [DOI] [PubMed] [Google Scholar]
- 57.Kim D, et al. TopHat2: accurate alignment of transcriptomes in the presence of insertions, deletions and gene fusions. Genome Biol. 2013;14:R36. doi: 10.1186/gb-2013-14-4-r36. [DOI] [PMC free article] [PubMed] [Google Scholar]
- 58.Harrow J, et al. GENCODE: the reference human genome annotation for The ENCODE Project. Genome Res. 2012;22:1760–1774. doi: 10.1101/gr.135350.111. [DOI] [PMC free article] [PubMed] [Google Scholar]
- 59.Yanai I, et al. Genome-wide midrange transcription profiles reveal expression level relationships in human tissue specification. Bioinformatics. 2005;21:650–659. doi: 10.1093/bioinformatics/bti042. [DOI] [PubMed] [Google Scholar]
- 60.Bult CJ, et al. Mouse genome database 2016. Nucleic Acids Res. 2016;44:D840–847. doi: 10.1093/nar/gkv1211. [DOI] [PMC free article] [PubMed] [Google Scholar]
- 61.Gene Ontology C. Gene Ontology Consortium: going forward. Nucleic Acids Res. 2015;43:D1049–1056. doi: 10.1093/nar/gku1179. [DOI] [PMC free article] [PubMed] [Google Scholar]
- 62.Speir ML, et al. The UCSC Genome Browser database: 2016 update. Nucleic Acids Res. 2016;44:D717–725. doi: 10.1093/nar/gkv1275. [DOI] [PMC free article] [PubMed] [Google Scholar]
- 63.Quinlan AR, Hall IM. BEDTools: a flexible suite of utilities for comparing genomic features. Bioinformatics. 2010;26:841–842. doi: 10.1093/bioinformatics/btq033. [DOI] [PMC free article] [PubMed] [Google Scholar]
- 64.Gordon CT, et al. Identification of novel craniofacial regulatory domains located far upstream of SOX9 and disrupted in Pierre Robin sequence. Hum Mutat. 2014;35:1011–1020. doi: 10.1002/humu.22606. [DOI] [PMC free article] [PubMed] [Google Scholar]
- 65.Li Q, et al. A Gli silencer is required for robust repression of gremlin in the vertebrate limb bud. Development. 2014;141:1906–1914. doi: 10.1242/dev.104299. [DOI] [PMC free article] [PubMed] [Google Scholar]
Associated Data
This section collects any data citations, data availability statements, or supplementary materials included in this article.
Supplementary Materials
Data Availability Statement
ChIP-seq and RNA-seq datasets are available in the NCBI GEO database with the accession code GSE93730. Additional data supporting the findings of this study are available from the corresponding authors upon reasonable request.


