

Abstract
Transposable elements (TEs) are an important source of human genetic variation with demonstrable effects on phenotype. Recently, a number of computational methods for the detection of polymorphic TE (polyTE) insertion sites from next-generation sequence data have been developed. The use of such tools will become increasingly important as the pace of human genome sequencing accelerates. For this report, we performed a comparative benchmarking and validation analysis of polyTE detection tools in an effort to inform their selection and use by the TE research community. We analyzed a core set of seven tools with respect to ease of use and accessibility, polyTE detection performance and runtime parameters. An experimentally validated set of 893 human polyTE insertions was used for this purpose, along with a series of simulated data sets that allowed us to assess the impact of sequence coverage on tool performance. The recently developed tool MELT showed the best overall performance followed by Mobster and then RetroSeq. PolyTE detection tools can best detect Alu insertion events in the human genome with reduced reliability for L1 insertions and substantially lowered performance for SVA insertions. We also show evidence that different polyTE detection tools are complementary with respect to their ability to detect a complete set of insertion events. Accordingly, a combined approach, coupled with manual inspection of individual results, may yield the best overall performance. In addition to the benchmarking results, we also provide notes on tool installation and usage as well as suggestions for future polyTE detection algorithm development.
Keywords: transposable elements, polymorphic transposable element detection, next-generation sequencing, human genome
Polymorphic TEs in the human genome
Transposable elements (TEs) are mobile DNA sequences that are capable of accumulating to high copy numbers in their host genomes. Indeed, it has been estimated that ∼50–70% of the human genome is made up of TE-derived sequences [1, 2]. These TE-derived sequences represent scores of families that have accumulated copies in the genome over many millions of years, a small fraction of which remain transpositionally active [3]. The main active families of human TEs are L1 [4, 5], Alu [6] and SVA [7, 8]. All three of these families correspond to retrotransposons that transpose via reverse transcription of an RNA intermediate. L1 elements are a family of long interspersed nuclear elements [9, 10], which are considered to be autonomous in the sense that they encode the enzymatic machinery necessary to catalyze their own retrotransposition [11]. Alu and SVA elements are non-autonomous TEs, which are transposed in trans by the L1 machinery [12, 13]. Alu elements are so-called short interspersed nuclear elements that evolved from 7SL RNA [14, 15], and SVAs are composite elements that are made up of human endogenous retrovirus sequence, simple sequence repeats and Alu sequence [16, 17].
Transpositional activity of active human TE families is an important source of genetic variation that can have severe phenotypic consequences. Mutations caused by TE insertions have been linked to a number of genetic diseases, including several kinds of cancer [18–20]. Alu insertions are linked to breast cancer and cystic fibrosis; L1 insertions can cause colon cancer and hemophilia A, and SVA insertions lead to leukemia and X-linked dystonia-parkinsonism. Active human TEs are also relevant to population genomic studies because polymorphic TE (polyTE) loci can serve as valuable genetic markers for studies of human ancestry [21, 22]. Given the relevance of TE activity to human clinical and population genomics, the ability to systematically characterize polyTEs from accumulating human genome sequences will be critical.
Over the last several years, a number of computational tools have been developed for the characterization of polyTE insertions based on the analysis of next-generation sequence data [23]. Computational polyTE detection tools will become increasingly important for studies of human genome sequence variation owing to the emergence of numerous efforts to characterize thousands of whole genome sequences. The 1000 Genomes (1KG) Project was the first effort of this kind [24, 25], and the recent Phase III data release contains a complete catalog of >16 000 polyTE loci among 2504 individuals [21]. The National Heart, Lung and Blood Institute of the US National Institutes of Health has an initiative underway to sequence whole genomes for 70 000 individuals [26], and the Sanger Institute in the United Kingdom is sequencing 100 000 human genomes [27]. These are just a few of many such initiatives that are underway around the world.
Despite the accumulation of data from these massive sequencing efforts, the development of computational tools for the detection of polyTE insertions from next-generation sequence data remains in its infancy, and there has yet to be a systematic attempt to compare the utility and performance of polyTE detection tools. In this report, we present a comparative benchmarking and validation analysis of computational tools for polyTE detection. We have focused this analysis on human genome sequences owing to their clinical importance and impending abundance. In addition, the presence of an experimentally validated set of polyTE loci for a single human individual provides a valuable resource for tool benchmarking and validation. This study represents a practical evaluation of polyTE detection tools, with an eye toward both users and developers, rather than a comprehensive review of TE sequence analysis tools, which have been covered in depth elsewhere [3, 23, 28].
Polymorphic TE detection tools
The benchmarking study reported here concerns only polyTE detection tools, rather than TE discovery and annotation tools [28] or general structural variant detection tools [29]. TE annotation tools, such as RepeatMasker [30] or CENSOR [31], typically rely on the comparison of TE consensus sequences to assembled genome sequences to characterize the genomic locations, and (sub)family identities, of TE-derived sequences. The vast majority of TE-derived sequences in the human genome are the remnants of ancient insertion events, which are no longer capable of transposition and reside at fixed locations that do not differ between individual genomes. More recent transpositional activity of polyTE families generates insertions that differ between individuals. Detection of such polyTE loci requires different kinds of computational tools, which use (re)sequencing data by analyzing the locations to which sequence reads map to a genome reference sequence. This class of computational tools has only been recently developed and has yet to be systematically compared and benchmarked.
We chose a total of seven polyTE detection tools for comparative benchmarking and validation based on the rationale and preliminary testing described in Supplementary Table S1. We chose these tools based on a number of criteria through which we attempted to pre-assess their viability and potential for use by the TE research community: (i) tools that are both recently released (2013 or later) and currently maintained, (ii) tools that have been evaluated using actual or simulated human genome next-generation sequence data, (iii) tools that were used for polyTE detection in the 1KG Project and (iv) tools developed for other model organisms and have been directly compared with human polyTE detection tools. The seven tools that fit these criteria are listed in Table 1 along with a qualitative assessment of their relative ease of installation, ease of use and comprehensiveness of their manuals. We provide extended usage details on each of these tools in the Supplement including exact commands with parameters and input files used. We also provide notes with respect to what is needed to install and run each program (e.g. dependencies) along with brief descriptions of any issues we encountered with their use. Finally, we note cases where use of the tools entailed direct communication with their developers, and the adjustments that were made to facilitate the tools’ execution.
Table 1.
List of polyTE detection tools benchmarked in this study. The tools are compared with respect to their ease of installation, ease of use and the comprehensiveness of their manual
| Tool | Reference | Year | Algorithma | Reported testing setb | Web site | Langc | Ease of Installationd | Ease of Use | Manual | Open Source | VCF Outpute |
|---|---|---|---|---|---|---|---|---|---|---|---|
| MELT | Unpublished | DP/SR | 1KG | http://melt.igs.umaryland.edu/ | Java | Easy | Easy | Detailed | No | Yes | |
| ITIS | [32] | 2015 | DP/SR | M. truncatula | https://github.com/Chuan-Jiang/ITIS | Perl | Easy | Easy | Detailed | Yes | No |
| TEMP | [33] | 2014 | DP | 1KG; Simulated | https://github.com/JialiUMassWengLab/TEMP | Perl | Moderate | Moderate | Detailed | Yes | No |
| Mobster | [34] | 2014 | DP/SR | 1KG; EGA | http://sourceforge.net/projects/mobster/ | Java | Easy | Easy | Detailed | No | No |
| Tangram | [35] | 2014 | DP/SR | 1KG; Simulated | https://github.com/jiantao/Tangram | C ++ | Moderate | Difficult | Brief | Yes | Yes |
| RetroSeq | [44] | 2013 | DP | 1KG | https://github.com/tk2/RetroSeq | Perl | Easy | Easy | Detailed | Yes | Yes |
| T-lex2 | [45] | 2014 | RM/RD | 1KG; DM | http://petrov.stanford.edu/cgi-bin/Tlex.html | Perl | Difficult | Difficult | Moderate | Yes | No |
aAlgorithmic paradigm used by the tool: DP = discordant read pairs, SR = split/clipped reads, RM = read mapping, RD = read depth.
bTest data set used for previously reported validation: 1KG = 1000 Genomes Project, EGA = European Genome-phenome Archive, DM = Drosophila melanogaster.
cCoding language used for the tool development.
dIncludes installation of the program and all required dependencies.
eWhether or not the program produces a VCF output.
While the considerations we used to pre-select polyTE detection tools for analysis here may be somewhat subjective, we feel that the collection of tools benchmarked for this report represents the current state-of-the art for polyTE detection. Readers should be aware that more exhaustive lists of polyTE detection tools have been reported in a recent review of such detection methods [23] as well as an older review that covered a broader range of TE sequence analysis tools [28]. In addition, online lists of polyTE detection tools can be found on the TE tools @ Bergman Lab Web site [38] and on the OMICtools Web site [39]. While the lists found in these papers and Web sites are far more inclusive than the set of tools we analyze here, they do not provide any indication of utility or performance for the tools or any practical guide for tool selection and use. Here, we have opted for a deeper analysis of a core set of tools, which we hope can serve as a reliable guide for investigators interested in TE discovery as well as those who may be inclined to pursue further algorithm development in this area.
All of the polyTE detection tools analyzed here operate on the same basic algorithmic paradigm for the analysis of short, paired-end sequence reads mapped to a reference genome sequence (Figure 1). There are two particularly important classes of reads that point to the presence of a polyTE insertion relative to a reference genome sequence that lacks an insertion at that locus. These are so-called discordant read pairs (DPs) and split, or clipped, read pairs (SRs) (left panel of Figure 1). DPs are read pairs where one member of the pair maps uniquely to the reference genome sequence, while the other member of the pair maps ambiguously to members of an active TE family. SRs contain one read that maps to the junction of the reference genome sequence and the inserted polyTE sequence. In other words, the reads are split (clipped) with one part of the read mapped to unique sequence and the other part mapped to a repetitive TE sequence. DPs and SRs will show distinct mapping characteristics when mapped to a reference genome that lacks the polyTE insertion (right panel Figure 1). These mapping characteristics are used by the polyTE detection programs, together with the partial mapping to active TE sequences, to identify and locate polyTE insertions. Various programs also incorporate additional sources of information, e.g. read depth and prior information about polyTE insertion locations, but the DP and SR paradigm is the essence of these algorithms.
Figure 1.

Detection of polyTE insertions using next-generation sequence data. Two schemes are shown illustrating how paired-end read mapping information is used for the detection of polyTE insertion sites. One scheme shows the actual sequence being characterized with the polyTE insertion present and the other scheme shows the reference sequence that lacks the polyTE insertion. Sequence reads generated from the actual sequence will be mapped to the reference sequence as shown. There are three classes of locally mapped reads that inform polyTE detection: (1) both reads in a pair map uniquely, (2) DP where one read maps uniquely and one read maps to a repetitive TE sequence and (3) SR where part of one read maps uniquely and the other part maps to a repetitive TE sequence. The presence of DPs and SRs, along with the mapping distance between their paired reads, is used in the prediction of polyTE insertion sites.
Benchmarking sequence data sets
As previously discussed, we focused our polyTE detection tool benchmarking and validation efforts on human genome sequences. To do this, we evaluated a series of actual and simulated next-generation human genome sequence data sets. The actual next-generation sequence data that we analyzed were characterized from the HapMap/1KG Project CEU (European) female sample ‘NA12878’. This individual corresponds to the sample that has been analyzed extensively as part of the Genome in a Bottle Consortium project, which aims to validate tools for human genome sequence variant calling [40]. As such, it represents the most reliably characterized individual human genome sequence in existence. This sample was sequenced to low coverage (5.7×) in Phase I, and high coverage (95.6×) in Phase II, of the 1KG Project using Illumina short read sequencing technology [25]. Sequence reads for these two phases were mapped to the human genome reference sequence as previously described [25], and the read-to-genome alignment files (i.e. the BAM files) were obtained from the 1KG Web site [41] for use with the polyTE detection tools evaluated here.
Most importantly, with respect to the validation of polyTE detection tools, this same sample was also characterized using the Pacific Biosciences (PacBio) long read sequencing technology by members of the 1KG Project Structural Variation Group [21]. The use of PacBio sequencing technology allowed this group to unambiguously characterize the insertion sites for 893 human polyTEs in the NA12878 genome sequence, as the long reads span (or can be readily assembled across) polyTE insertion sites. The resulting validated polyTE insertion sites (generously provided by Dr Ali Bashir, Icahn School of Medicine at Mount Sinai) were used to assess the performance of the polyTE detection tools benchmarked here.
We also benchmarked the polyTE detection tools using simulated human genome sequence data in an effort to more thoroughly explore the effect of different sequence coverage levels on the performance of the tools. The simulated data were generated by randomly inserting AluY, L1 and SVA consensus sequences, taken from RepBase 14.02 [42], into the autosomes of the human genome reference sequence (build 19, GRCh37) using a custom written Perl script. Each simulated polyTE insertion had a chance of undergoing stochastic single-base mutations at a rate of up to 15% in an effort to reflect naturally occurring variation among dispersed TE copies. Simulated insertions included poly-A tails and target site duplications, as these features are used by some polyTE detection tools. A total of 893 polyTE insertions were created with the proportions of AluY, L1 and SVA following the reported worldwide genomic averages of 915, 128 and 51 insertions, respectively [21, 22]. Having created an in silico set of polyTE insertions in this way, paired-end reads were then simulated using the ART simulator [43] with the Illumina MiSeq profile, read length of 150 bp, mean fragment length of 500 bp and a standard deviation of 10 bp. Read simulation was done across a range of approximate coverage values: 5×, 10×, 15×, 30× and 50× (Table 2). Simulated reads were mapped to the human genome reference sequence (build 19, GRCh37) using the program BWA [32], and all subsequent file format conversions and sorting were done using SAMtools [33].
Table 2.
Actual and simulated data sets used for benchmarking polyTE detection tools
| Data seta | Source | # of readsb | Bases sequenced | Read length | Coveragec |
|---|---|---|---|---|---|
| NA12878 Low | 1KG Phase I | 172 724 240 | 17 445 148 240 | 101 | 5.74× |
| NA12878 High | 1KG Phase II | 2 873 647 625 | 290 238 410 125 | 101 | 95.59× |
| Sim5× | 89 510 496 | 13 426 574 400 | 150 | 4.66× | |
| Sim10× | 179 023 214 | 26 853 482 100 | 150 | 9.32× | |
| Sim15× | Simulated data set | 268 528 918 | 40 279 337 700 | 150 | 13.98× |
| Sim30× | 537,056,924 | 80,558,538,600 | 150 | 27.96× | |
| Sim50× | 895 112 564 | 134 266 884 600 | 150 | 46.60× |
aActual and simulated data sets used for benchmarking (as described in the text).
bTotal number of sequence reads present in each data set.
cGenomic coverage (i.e. sequencing depth) for each data set.
Benchmarking and validation parameters
The seven polyTE detection tools shown in Table 1 were run using the low and high coverage actual human genome sequence read data sets from the NA12878 sample as well as the five simulated read data sets representing a range of coverages (Table 2). The tools were run on a high-performance server with 512 GB of RAM and four 10-core Intel Xeon 2.8 GHz processors. The details for how each tool was run, along with notes guiding their installation and use, are shown in the Supplement. The tools were benchmarked and validated according to two broad performance categories: (i) polyTE detection performance and (ii) runtime parameters. The details of the results of this comparative analysis are shown in Table 3.
Table 3.
Benchmarking and validation results for seven polyTE detection tools. The tools were evaluated broadly for polyTE detection performance and runtime parameters as described in the text
| Data | Tool |
PolyTE detection performance |
Runtime parameters |
|||||||||
|---|---|---|---|---|---|---|---|---|---|---|---|---|
| Total predictionsa |
Correct prediction |
TPe | FPf | FNg | CPU timeh | Wall timei | Peak RAMj | % CPUk | ||||
| Exactb | ≤100 bpc | ≤1kbd | ||||||||||
| NA12878 Low | MELT | 1189 | 853 | 862 | 862 | 862 | 327 | 31 | 13.5 | 18.6 | 19.07 | 111 |
| Mobster | 1035 | 39 | 651 | 678 | 651 | 384 | 242 | 18.3 | 65.2 | 101.43 | 76 | |
| RetroSeq | 749 | 5 | 408 | 515 | 408 | 341 | 485 | 96.6 | 83 | 0.39 | 121 | |
| TEMP | 4928 | 0 | 31 | 45 | 31 | 4897 | 862 | 36 | 42.9 | 2.19 | 97 | |
| Tangram | 3186 | 172 | 411 | 413 | 411 | 2775 | 482 | 384.8 | 123.8 | 98.3 | 322 | |
| ITIS | 237 | 37 | 77 | 184 | 77 | 160 | 816 | 2316.20 | 689.9 | 28.67 | 347 | |
| T-lex2 | Process killed. Reason: Process not finished within a week | >1 week | – | – | – | |||||||
| NA12878 High | MELT | 179 | 45 | 47 | 47 | 47 | 132 | 846 | 232.3 | 360.6 | 80.12 | 92 |
| Mobster | 1572 | 303 | 819 | 825 | 819 | 753 | 74 | 449.5 | 426 | 118.55 | 156 | |
| RetroSeq | 4404 | 21 | 850 | 859 | 850 | 3554 | 43 | 1889.40 | 1653.50 | 1.67 | 124 | |
| TEMP | 1109 | 2 | 49 | 87 | 49 | 1060 | 844 | 948.9 | 1187.10 | 150.14 | 92 | |
| Tangram | Process killed. Reason: Exited with error message. Reported problem. | 6611.20 | 3128.90 | 261.61 | 221 | |||||||
| Reported | MELT | 990 | 807 | 807 | 807 | 807 | 183 | 86 | – | – | – | – |
| Mobster | 1250 | 352 | 800 | 805 | 800 | 450 | 93 | – | – | – | – | |
| RetroSeq | 1252 | 18 | 791 | 799 | 791 | 461 | 102 | – | – | – | – | |
| Tangram | 1553 | 250 | 828 | 837 | 828 | 725 | 65 | – | – | – | – | |
| Sim5× | MELT | 304 | 22 | 264 | 294 | 264 | 40 | 628 | 6.1 | 16.8 | 13.98 | 95 |
| Mobster | 322 | 4 | 271 | 300 | 271 | 51 | 621 | 11.31 | 14.3 | 10.42 | 120 | |
| RetroSeq | 662 | 3 | 348 | 631 | 348 | 314 | 544 | 42.45 | 35.32 | 0.39 | 124 | |
| ITIS | 66 | 0 | 23 | 62 | 23 | 43 | 870 | 2621.10 | 1057.90 | 57.14 | 261 | |
| TEMP | No predictions | 2.37 | 2.47 | 2.04 | 98 | |||||||
| Tangram | Process killed. Reason: Exited with error message. Reported problem. | 180.4 | 71.58 | 51.02 | 256 | |||||||
| Sim10× | MELT | 416 | 35 | 396 | 402 | 396 | 20 | 496 | 11.45 | 12.85 | 14.92 | 122 |
| Mobster | 505 | 7 | 406 | 439 | 406 | 99 | 486 | 17.89 | 18.71 | 10.43 | 110 | |
| RetroSeq | 769 | 5 | 434 | 730 | 434 | 335 | 458 | 96.05 | 78.35 | 0.39 | 126 | |
| ITIS | 172 | 0 | 35 | 160 | 35 | 137 | 857 | 4247.16 | 1248.63 | 57.14 | 352 | |
| TEMP | No predictions | 5.06 | 5.26 | 2.04 | 99 | |||||||
| Tangram | Process killed. Reason: Exited with error message. Reported problem. | 343.34 | 143.78 | 102.04 | 246 | |||||||
| Sim15× | MELT | 484 | 51 | 460 | 467 | 460 | 24 | 432 | 16.84 | 20.72 | 12.97 | 118 |
| Mobster | 570 | 9 | 460 | 493 | 460 | 110 | 432 | 26.36 | 39.33 | 10.53 | 124 | |
| RetroSeq | 734 | 11 | 489 | 734 | 489 | 245 | 403 | 113.5 | 92.08 | 0.39 | 126 | |
| ITIS | 256 | 0 | 42 | 241 | 42 | 214 | 850 | 6985.06 | 1937.70 | 57.14 | 372 | |
| TEMP | No predictions | 6.54 | 6.67 | 2.04 | 100 | |||||||
| Sim30× | MELT | 542 | 67 | 509 | 520 | 509 | 33 | 383 | 28.55 | 27.75 | 12.05 | 112 |
| Mobster | 439 | 16 | 405 | 413 | 405 | 34 | 487 | 44.89 | 35.03 | 10.52 | 134 | |
| RetroSeq | 804 | 14 | 507 | 738 | 507 | 297 | 385 | 260.82 | 216.38 | 0.39 | 123 | |
| ITIS | 399 | 0 | 49 | 352 | 49 | 350 | 843 | 13 286.89 | 3185.67 | 57.14 | 428 | |
| TEMP | No predictions | 12.19 | 12.45 | 2.04 | 100 | |||||||
| Sim50× | MELT | 562 | 68 | 527 | 539 | 527 | 35 | 365 | 45.42 | 52.14 | 41.66 | 102 |
| Mobster | 593 | 14 | 505 | 515 | 505 | 88 | 387 | 60.78 | 69.95 | 34.05 | 107 | |
| RetroSeq | 828 | 19 | 489 | 742 | 489 | 339 | 403 | 398.71 | 323.13 | 0.39 | 126 | |
aTotal number of predicted polyTE insertions.
bNumber of polyTE predictions with the correct insertion position.
c,dNumber of polyTE predictions with the correct insertion position <100 bpc or 1 kbd away from predicted position.
eTP = Number of predictions with correct insertion position <100 bp away.
fFP = Number of incorrectly predicted polyTE insertions.
gFN = Number of polyTE insertions not predicted by the tool.
hTime (in minutes) the tool spent on the processor.
iWall clock time (in minutes) that the tool took to finish.
jMaximum amount of memory that the tool occupied during its execution time.
kPercentage of the CPUs that the tool used.
For polyTE detection performance, the locations of predicted polyTE insertions for each tool were compared with known insertion sites from the actual and simulated data sets. PolyTE insertion site locations that were predicted within 100 bp of a known insertion site were counted as true positives (TP). Predictions that fell outside this range were counted as false positives (FP), and known polyTE insertion sites that did not have any prediction within 100 bp were counted as false negatives (FN). The resulting TP, FP and FN counts were used to compute Precision, Recall and F1-Scores, as metrics of the relative performance of the polyTE detection tools. Precision (also known as positive predictive value) is computed as TP/(TP + FP), and it characterizes the ability of the tool to reject false insertion predictions. Recall (also known as sensitivity or true positive rate) is computed as TP/(TP + FN), and it characterizes the ability of the tool to predict true insertions. Finally, the F1-Score (also known as the F-measure) is computed as the harmonic mean of Precision and Recall, 2x[(PrecisionxRecall)/(Precision + Recall)], and it is used here to measure the overall polyTE detection performance of each tool.
Runtime parameters measure the amount of time and computational resources used by the polyTE detection tools. The CPU time is the amount of processor time used by the tool, whereas the wall time is the actual wall clock time that the tool takes to finish. Peak RAM is the maximum amount of memory occupied by the tool over the course of its run, and the %CPU is the percentage of the available cores that the tool was able to use.
PolyTE detection performance
The relative performance of the seven polyTE detection tools evaluated here is shown in terms of Precision, Recall and the F1-Score for the actual low and high coverage human genome sequence data sets analyzed here (Figure 2). The unpublished tool MELT shows the best overall performance on the low coverage (5.7×) data set followed by Mobster and then RetroSeq. Tangram shows intermediate performance and then there is a precipitous drop off to the next set of three tools, all of which show poor or no performance. Results for the program T-lex2 are not shown here, as it took >4 weeks to run and predicted >300K insertions. The superior performance of MELT (97% of all polyTE insertions detected) on this data set is consistent with the fact that it was the program used for the 1KG Project from which the validation data were derived [21], and the tool incorporates prior information in the form of known human polyTE insertion sites. The empirical performance of MELT measured via the current benchmarking analysis is similar to what has been previously reported as opposed to the other tools evaluated here, which tend to show previously reported performance levels that are substantially higher than those observed here.
Figure 2.
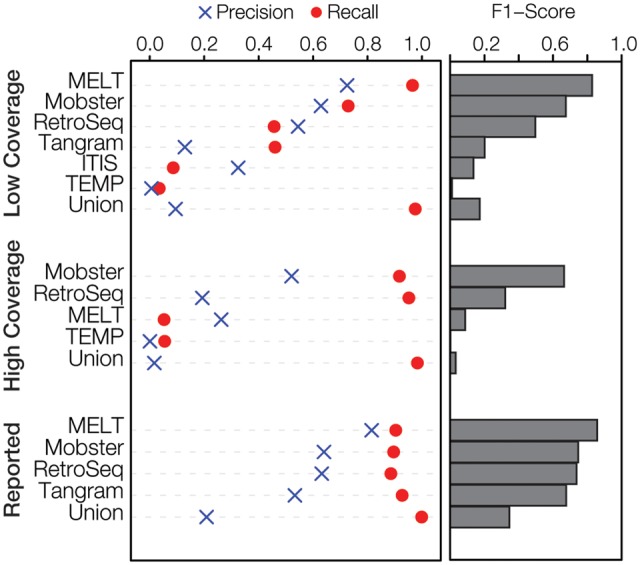
Overall polyTE detection tool performance. Precision, Recall and F1-Score are shown for the different polyTE detection tools evaluated here for the low- (5.7×) and high- (95.6×) coverage human genome sequence NA12878 data. The same parameter values are shown based on previous reports on these tools. The union of predictions made by all tools under consideration is shown for each category. For each category, the tools are ranked according to the F1-Score, which provides an overall measure of performance.
Surprisingly, the results of the polyTE detection tool evaluation on the high coverage (95.6×) data set indicate that additional sequence coverage can yield reduced tool performance or no performance at all in some cases. In fact, only four of the seven tools evaluated here were able to successfully run on the high coverage data set. In addition, all of the tools showed worse performance on the high coverage data set compared with the low coverage data set. This is based on the fact that all of the tools, except for MELT, predicted substantially higher numbers of polyTE insertions and accordingly had higher numbers of FP (Table 3). MELT gave an error for Alu and SVA predictions for the high coverage data set and was only able to predict the longer L1 insertions for these data. Mobster and RetroSeq show the best performance for this data set, but both of these tools also have high numbers of FP and accordingly low Precision. One possible explanation for this could be that the higher coverage data set allows for the detection of polyTE insertions that were generated via somatic transposition events, or perhaps even during cell culture, and thereby represent somatic mosaicism that went undetected at low-sequence-coverage levels. However, there is a more likely technical explanation related to the fact that the high-coverage data set includes a mix of both Illumina and Roche/454 sequence read data, which could be the source of errors for the tools that were not able to run on this data set. In summary, none of these tools work reliably for such a high-coverage data set, and users should be cautioned against applying them to such data sets. This problem is mitigated by the fact that it is highly unlikely, at least at this time, that many whole human genome sequences will be sequenced to this depth and users will most likely be evaluating data from a single (Illumina) sequencing platform. Nevertheless, these results underscore the fact that polyTE prediction remains an inexact science.
We also compared the performance of the polyTE detection tools for Alu, L1 and SVA separately on the low- and high-coverage data sets (Figure 3). Overall, the three most reliable tools (MELT, Mobster and RetroSeq) work best on Alu elements, followed by L1 and then SVA, which shows the poorest performance by far. Alu insertions are detected with relatively high Precision and Recall in the low-coverage data set; L1 insertions have relatively high Recall but much lower Precision, whereas SVAs are low for both Precision and Recall. MELT showed the most uniformly strong performance across all three polyTE families. Alu elements are also distinguished by the fact that the vast majority of insertions can be found by all three of the best methods, whereas there is no single SVA insertion that is found by all of these methods.
Figure 3.

Family-specific polyTE detection tool performance. TE family-specific Precision and Recall values are shown for the different polyTE detection tools evaluated here for the low- (5.7×) and high- (95.6×) coverage human genome sequence NA12878 data. The same parameter values are shown based on previous reports on these tools. The union of predictions made by all tools under consideration is shown for each category. Venn diagrams compare the numbers of unique and shared polyTE insertions reported to have been detected by the three most reliable methods: MELT, Mobster and RetroSeq.
Sequence coverage and tool performance
The low- (5.7×) and high- (95.6×) coverage data sets described in the previous section represent extreme differences in sequencing depth. We used simulated polyTE insertion data sets across a range of coverages (5×, 10×, 15×, 30× and 50×) to more systematically evaluate the effect of sequence depth on the polyTE detection methods evaluated here (Table 3 and Figure 4). The overall performance of the polyTE tools for the simulated data sets is lower than seen for the actual data, indicating that the tools evaluated here work on empirically observed characteristics of polyTE insertions, which cannot be replicated in their entirety via the simulation of in silico polyTE data sets. Nevertheless, the relative performance of the tools is similar to what is seen for the actual data, and it remains stable across the different coverage levels. MELT shows the best overall performance followed by Mobster and then RetroSeq. Recall increases consistently across coverage levels for these three tools, whereas Precision peaks and then flattens out or declines owing to an increase in FP at higher coverage levels. The overall trend suggests that performance is flattening out or diminishing at ∼30×–50×, suggesting a possible coverage limit for these kinds of tools. ITIS gave consistently poor results for these simulated data, whereas TEMP and Tangram failed to make predictions or gave errors.
Figure 4.

Effect of sequence coverage on polyTE detection tool performance. Precision, Recall and F1-Score are shown for the different polyTE detection tools evaluated here across a range of sequence coverages (5×, 10×, 15×, 30× and 50×) from the simulated TE insertion data set.
It should be noted that we also generated a number of additional in silico data sets using different simulation parameters than those described for the results reported here. The goal of these additional simulations was to evaluate the effect of different fragment lengths on polyTE detection tools. We evaluated fragment (insert) lengths of 1 kb, 3 kb, 5 kb and 8 kb, which are more typical of mate-pair sequencing technology as opposed to the paired-end technology used to generate the empirical and simulated data evaluated here. The data sets simulated with longer fragments failed to generated reliable results using any of the tools we evaluated. These results (or lack thereof) underscore the extent to which polyTE detection tools are designed for the widely used Illumina paired-end sequencing technology; investigators who wish to use whole genome sequence data for polyTE discovery should be aware of this limitation.
Runtime parameters
A variety of runtime parameters were measured for the tools on both actual and simulated data as previously described (Table 3). The overall trends are similar for the actual and simulated data (Figure 5). The programs’ runtimes vary over several orders of magnitude and increase in a nearly linear fashion with increasing sequence coverage. The only exception to this trend is seen for ITIS, which has by far the longest runtime and increases much more precipitously with increasing coverage. The CPU time and wall time are closely coupled for most of the tools analyzed here, indicating that the processes executed by the tools are CPU-bound and do not take advantage of parallel execution on multiple cores. ITIS was again the exception to this pattern showing much higher CPU time than wall time, consistent with parallel processing on multiple cores. However, this potential advantage is mitigated by its overall long runtime (and poor performance). In addition to its superior performance, MELT is also distinguished by a relatively fast runtime.
Figure 5.

PolyTE detection program runtime parameters. Runtime, memory and CPU usage are shown for polyTE detection programs run on (A) actual and (B) simulated data sets.
Peak memory usage is fairly similar for most of the tools analyzed here and falls well within the range of RAM available for most servers. RetroSeq has an extremely light memory footprint (<1 GB RAM) indicating that it can be run on virtually any computer. Results from the %CPU utilization indicate that most of the tools evaluated here only used one core for most of their runtime, with the exception of ITIS whose %CPU utilization scales with sequence coverage. In theory, this should yield superior performance, but that was not observed in this case.
Interestingly, the runtime parameters do not seem to be affected by the choice of programming language used by developers of the different tools, as is commonly believed by programmers. For example, Tangram is written in C ++ and thus should in principle be much faster and more efficient than the other programs written in Perl; this did not prove to be the case. On the other hand, RetroSeq is written in Perl but has the lowest memory footprint, contrary to what may be expected. Clearly, the programming language of choice is less relevant than the algorithm design principles used by these programs. This may be a truism, but it also may point to the opportunity for substantial future improvement in the design of these tools.
Additional notes for users and developers
We provide detailed notes on the installation and use of the benchmarked polyTE detection programs in the Supplement. Here, we provide some more general notes on practical issues that users of these programs should be aware of, along with possible suggestions for developers related to these same issues.
Installation of dependencies: Some of the tools require that users install dependencies from third-party developers that are not bundled with the tool. This seemingly trivial requirement can prove to be challenging for both relatively naïve users and in the case where the dependency version changes affect program output. We recommend that developers bundle all dependencies with their polyTE detection software.
Parameter choice: Some of the tools require that users provide a number of parameters, many of which could be easily calculated from the input data sets. We recommend that developers consider automatic parameter calculation from input data, where possible, to allow for ease of use and improved performance.
Input reference databases: Most of the tools have specific formatting requirements for the databases of TE consensus sequences and/or coordinates that users are required to provide. Generation of such tool-specific reference databases is time-consuming and potentially error prone. We recommend that developers provide pre-formatted reference databases for human and model organisms to facilitate accurate and ready use of their tools.
Filtering TE predictions:Some of the tools have criteria by which users should filter the automatically generated output of TE predictions (e.g. number of reads that support predictions). Lack of guidance as to specific filtering criteria leads to numerous FP. We recommend that developers provide the option for filtering based on parameters derived from the input data set (see point #2 above).
VCF output: Output formats vary among the tools evaluated here. Variant call format (VCF) is a generally accepted and widely used format for variant representation. Availability of VCF output would allow for ease of interpretation and better integration with downstream analysis tools.
Conclusions and future prospects
It is notable that the published tools evaluated here did not perform as previously reported (Figure 2 and Table 3). This could be owing to slight differences in parameter usage, filtering details and/or data post-processing compared with the initial evaluations done by the tool developers. To address this possibility, tool developers were contacted and parameter usage and settings were refined as described in detail in the Supplement. Nevertheless, the most important point for prospective tool users is that the benchmarking conducted here on empirical and simulated human data sets allowed for a controlled comparison of the tools with respect to their relative performance and usage features.
The polyTE detection tool MELT shows consistently superior performance on the human genome sequence data (actual and simulated) analyzed here. The only exception to this trend was seen for the high coverage data set, where MELT failed to predict Alu and SVA insertions. The superior performance of MELT may be related to the fact that it was the program used by the 1KG Project Structural Variation Group to make predictions on the same sample (NA12878) that was used for validation purposes here. In addition, MELT takes advantage of prior information on the known locations of human polyTE insertions. Despite these caveats, or perhaps owing in part to the additional information gained during the development process of the tool, MELT is currently the best choice for the detection of human polyTE insertions.
In our hands, Mobster and RetroSeq were slightly less reliable options for human polyTE detection. These tools showed consistent performance across the data sets analyzed here, and they were both relatively easy to install and run. RetroSeq is further distinguished by a particularly light computational footprint that makes it useable on virtually any computer. None of the other tools benchmarked here are currently recommended for the detection of human polyTE insertions. It is formally possible that some of the more poorly performing tools may in fact work well in the hands of their developers, and that the performance metrics reported here reflect the fact that we were unable to get them to work correctly. However, whenever we had problems with tool use, we made efforts to thoroughly review the documentation, verify the input and reference files, vary usage parameters and change the dependency versions. When none of this worked, we contacted the developers directly for their feedback. Thus, we made extensive efforts to get the tools to work, and our ability (or lack thereof) to do so can be considered as an important source of information for potential tool users and developers. It may also be the case that some of the tools evaluated here, such as Tangram, are no longer actively supported and represent a stage in the ongoing development of polyTE detection algorithms.
Another caveat is that some of these tools were developed for other model organisms. For example, ITIS was developed for the plant Medicago trunculata, and T-lex2 was developed for the analysis of Drosophila sequence data. It is possible that their relatively poor performance on human data sets reflects the fact that they are better tuned to the TEs and genomic sequence context of their respective organisms.
Although the tools evaluated here work on the same general algorithmic principle, it is possible that subtle differences in the algorithmic design may explain the observed performance differences. To explore this possibility, we reviewed the salient algorithmic features of each tool we evaluated (Supplementary Tables S2 and S3). The main systematic differences relate to (i) the read-to-mobilome (i.e. TE consensus sequence) mapping method used and (ii) the manner in which DPs and SRs are characterized. There are also individual differences in how breakpoint estimation is done and the filtering criteria used. Nevertheless, there is no apparent combination of algorithmic design features that appears to explain the relative performance of the tools tested here.
It is also worth noting that the union of predictions made by all the methods under consideration always yields higher Recall than any single method (Figures 2 and 3). Thus, the polyTE detection tools evaluated here may be considered to be complementary. Of course, combining results of all methods for any given set of predictions yields numerous FP. Nevertheless, a careful combined analysis—using MELT, Mobster and RetroSeq for example—with some kind of majority rule criterion and/or careful manual (visual) inspection of read mapping results may provide for the optimal polyTE detection.
Despite the fact that we ran all of these tools on a high-performance server with substantial memory and processing power, several of the tools ran for an extremely long time and/or failed to produce output. In some cases, higher coverage, which should in principle allow for improved performance, severely impeded the programs’ execution. A number of these tools have been developed by genome analysis consortia and/or as part of large-scale sequencing efforts, which are likely to have substantial computational resources at their disposal. But in order for these tools to be widely adopted by the research community, a concerted effort will have to be made to ensure that they are both user friendly and scalable. This suggests an excellent opportunity for developers to create algorithms that are more computationally efficient and thereby more widely accessible to the research community. In short, there is still a lot room for development in the area of polyTE detection.
Finally, it is important to note that many of the large-scale human genome projects underway will continue to use relatively short read sequencing technology, Illumina in particular, which is by far the current industry leader for re-sequencing. Accordingly, the use of the kinds of polyTE detection tools evaluated here will remain critical for the characterization of TE-generated genetic variation. However, the era of single molecule sequencing is very much underway, and the long-sequence reads generated by technologies such as PacBio and Oxford Nanopore would render these short read computational techniques irrelevant. But it is currently unclear whether, and the extent to which, such long-sequence read technologies may eventually supplant Illumina for human genome re-sequencing.
Key Points
Transposable element activity is an important source of human genetic variation that has yet to be fully explored.
It is now possible to identify insertion sites for polymorphic transposable elements (polyTEs) genome-wide using computational analysis of next-generation (re)sequencing data.
Computational methods for the detection of polyTE insertion sites have been recently developed and have yet to be systematically compared and benchmarked.
We used a validated set of human polyTE loci to compare the performance of the most widely used methods for the computational detection of insertion sites.
We provide results on the relative performance and resource utilization of different polyTE detection programs along with specific information regarding their installations and use.
Funding
This work was supported by the Georgia Institute of Technology Bioinformatics Graduate Program, IHRC-GIT Applied Bioinformatics Laboratory (ABiL). This work was supported in part by the Intramural Research Program of the National Institutes of Health, National Library of Medicine and National Center for Biotechnology Information (NIH, NLM, NCBI) ZIA LM082713-04.
Supplementary data
Supplementary data are available online at http://bib.oxfordjournals.org/.
Supplementary Material
Lavanya Rishishwar is a PhD student in the Bioinformatics Graduate Program at Georgia Tech and team lead of the Applied Bioinformatics Laboratory. His research interests include computationally enabled human population and clinical genomic analyses.
Leonardo Mariño-Ramírez is a Staff Scientist at the National Center for Biotechnology Information. He co-founded the PanAmerican Bioinformatics Institute together with King Jordan. His research interests include the evolutionary and functional aspects of eukaryotic gene regulation.
King Jordan is an Associate Professor in the School of Biology and Director of the Bioinformatics Graduate Program at Georgia Tech. He co-founded the PanAmerican Bioinformatics Institute together with Leonardo Mariño-Ramírez. His research interests include computational genomic approaches to human evolution and health.
References
- 1. de Koning AP, Gu W, Castoe TA, et al. Repetitive elements may comprise over two-thirds of the human genome. PLoS Genet 2011;7:e1002384.. [DOI] [PMC free article] [PubMed] [Google Scholar]
- 2. Lander ES, Linton LM, Birren B, et al. Initial sequencing and analysis of the human genome. Nature 2001;409:860–921. [DOI] [PubMed] [Google Scholar]
- 3. Ray DA, Batzer MA.. Reading TE leaves: new approaches to the identification of transposable element insertions. Genome Res 2011;21:813–20. [DOI] [PMC free article] [PubMed] [Google Scholar]
- 4. Brouha B, Schustak J, Badge RM, et al. Hot L1s account for the bulk of retrotransposition in the human population. Proc Natl Acad Sci USA 2003;100:5280–5. [DOI] [PMC free article] [PubMed] [Google Scholar]
- 5. Kazazian HH Jr., Wong C, Youssoufian H, et al. Haemophilia A resulting from de novo insertion of L1 sequences represents a novel mechanism for mutation in man. Nature 1988;332:164–6. [DOI] [PubMed] [Google Scholar]
- 6. Batzer MA, Deininger PL.. A human-specific subfamily of Alu sequences. Genomics 1991;9:481–7. [DOI] [PubMed] [Google Scholar]
- 7. Wang H, Xing J, Grover D, et al. SVA elements: a hominid-specific retroposon family. J Mol Biol 2005;354:994–1007. [DOI] [PubMed] [Google Scholar]
- 8. Ostertag EM, Goodier JL, Zhang Y, et al. SVA elements are nonautonomous retrotransposons that cause disease in humans. Am J Hum Genet 2003;73:1444–51. [DOI] [PMC free article] [PubMed] [Google Scholar]
- 9. Fanning TG, Singer MF.. LINE-1: a mammalian transposable element. Biochim Biophys Acta 1987;910:203–12. [DOI] [PubMed] [Google Scholar]
- 10. Burton FH, Loeb DD, Voliva CF, et al. Conservation throughout mammalia and extensive protein-encoding capacity of the highly repeated DNA long interspersed sequence one. J Mol Biol 1986;187:291–304. [DOI] [PubMed] [Google Scholar]
- 11. Moran JV, Holmes SE, Naas TP, et al. High frequency retrotransposition in cultured mammalian cells. Cell 1996;87:917–27. [DOI] [PubMed] [Google Scholar]
- 12. Dewannieux M, Esnault C, Heidmann T.. LINE-mediated retrotransposition of marked Alu sequences. Nat Genet 2003;35:41–8. [DOI] [PubMed] [Google Scholar]
- 13. Salem AH, Kilroy GE, Watkins WS, et al. Recently integrated Alu elements and human genomic diversity. Mol Biol Evol 2003;20:1349–61. [DOI] [PubMed] [Google Scholar]
- 14. Schmid CW, Deininger PL.. Sequence organization of the human genome. Cell 1975;6:345–58. [DOI] [PubMed] [Google Scholar]
- 15. Ullu E, Tschudi C.. Alu sequences are processed 7SL RNA genes. Nature 1984;312:171–2. [DOI] [PubMed] [Google Scholar]
- 16. Ono M, Kawakami M, Takezawa T.. A novel human nonviral retroposon derived from an endogenous retrovirus. Nucleic Acids Res 1987;15:8725–37. [DOI] [PMC free article] [PubMed] [Google Scholar]
- 17. Shen L, Wu LC, Sanlioglu S, et al. Structure and genetics of the partially duplicated gene RP located immediately upstream of the complement C4A and the C4B genes in the HLA class III region. Molecular cloning, exon-intron structure, composite retroposon, and breakpoint of gene duplication. J Biol Chem 1994;269:8466–76. [PubMed] [Google Scholar]
- 18. Deininger PL, Batzer MA.. Alu repeats and human disease. Mol Genet Metab 1999;67:183–93. [DOI] [PubMed] [Google Scholar]
- 19. Hancks DC, Kazazian HH Jr.. Active human retrotransposons: variation and disease. Curr Opin Genet Dev 2012;22:191–203. [DOI] [PMC free article] [PubMed] [Google Scholar]
- 20. Beck CR, Garcia-Perez JL, Badge RM, et al. LINE-1 elements in structural variation and disease. Annu Rev Genomics Hum Genet 2011;12:187–215. [DOI] [PMC free article] [PubMed] [Google Scholar]
- 21. Sudmant PH, Rausch T, Gardner EJ, et al. An integrated map of structural variation in 2,504 human genomes. Nature 2015;526:75–81. [DOI] [PMC free article] [PubMed] [Google Scholar]
- 22. Rishishwar L, Tellez Villa CE, Jordan IK.. Transposable element polymorphisms recapitulate human evolution. Mob DNA 2015;6:21.. [DOI] [PMC free article] [PubMed] [Google Scholar]
- 23. Ewing AD. Transposable element detection from whole genome sequence data. Mob DNA 2015;6:24.. [DOI] [PMC free article] [PubMed] [Google Scholar]
- 24. Genomes Project C, Auton A, Brooks LD, et al. A global reference for human genetic variation. Nature 2015;526:68–74. [DOI] [PMC free article] [PubMed] [Google Scholar]
- 25. Genomes Project C, Abecasis GR, Auton A, et al. An integrated map of genetic variation from 1,092 human genomes. Nature 2012;491:56–65. [DOI] [PMC free article] [PubMed] [Google Scholar]
- 26. Initiative NPM. Trans-Omics for Precision Medicine (TOPMed) Program. http://www.nhlbi.nih.gov/research/resources/nhlbi-precision-medicine-initiative/topmed (15 March 2016, date last accessed).
- 27. Barwell J, Powell C, Harrison H.. The dawn of genomic medicine: the role of the 100,000 Genomes Project in breast care management. Breast Cancer Management 2016;5:7–11. [Google Scholar]
- 28. Bergman CM, Quesneville H.. Discovering and detecting transposable elements in genome sequences. Brief Bioinform 2007;8:382–92. [DOI] [PubMed] [Google Scholar]
- 29. Alkan C, Coe BP, Eichler EE.. Genome structural variation discovery and genotyping. Nat Rev Genet 2011;12:363–76. [DOI] [PMC free article] [PubMed] [Google Scholar]
- 30. Smit AFA, Hubley R, Green P. RepeatMasker Open-4.0. http://www.repeatmasker.org.
- 31. Jurka J, Kapitonov VV, Pavlicek A, et al. Repbase update, a database of eukaryotic repetitive elements. Cytogenet Genome Res 2005;110:462–7. [DOI] [PubMed] [Google Scholar]
- 32. Li H, Durbin R.. Fast and accurate short read alignment with Burrows-Wheeler transform. Bioinformatics 2009;25:1754–60. [DOI] [PMC free article] [PubMed] [Google Scholar]
- 33. Li H, Handsaker B, Wysoker A, et al. The sequence alignment/map format and SAMtools. Bioinformatics 2009;25:2078–9. [DOI] [PMC free article] [PubMed] [Google Scholar]
- 34. Jiang C, Chen C, Huang Z, et al. ITIS, a bioinformatics tool for accurate identification of transposon insertion sites using next-generation sequencing data. BMC Bioinformatics 2015;16:72.. [DOI] [PMC free article] [PubMed] [Google Scholar]
- 35. Zhuang J, Wang J, Theurkauf W, et al. TEMP: a computational method for analyzing transposable element polymorphism in populations. Nucleic Acids Res 2014;42:6826–38. [DOI] [PMC free article] [PubMed] [Google Scholar]
- 36. Thung DT, de Ligt J, Vissers LE, et al. Mobster: accurate detection of mobile element insertions in next generation sequencing data. Genome Biol 2014;15:488.. [DOI] [PMC free article] [PubMed] [Google Scholar]
- 37. Wu J, Lee WP, Ward A, et al. Tangram: a comprehensive toolbox for mobile element insertion detection. BMC Genomics 2014;15:795.. [DOI] [PMC free article] [PubMed] [Google Scholar]
- 38. Bergman CM, Quesneville H. TE Tools @ Bergman Lab. http://bergmanlab.ls.manchester.ac.uk/?page_id=295 (15 March 2016, date last accessed).
- 39. OMICtools. Transposable element detection tools. http://omictools.com/transposon-detection-category (15 March 2016, date last accessed).
- 40. Zook JM, Chapman B, Wang J, et al. Integrating human sequence data sets provides a resource of benchmark SNP and indel genotype calls. Nat Biotechnol 2014;32:246–51. [DOI] [PubMed] [Google Scholar]
- 41. Genomes Project Consortium. A global reference for human genetic variation. ftp://ftp-trace.ncbi.nih.gov/1000genomes/ftp (15 March 2016, date last accessed).
- 42. Bao W, Kojima KK, Kohany O.. Repbase Update, a database of repetitive elements in eukaryotic genomes. Mob DNA 2015;6:11.. [DOI] [PMC free article] [PubMed] [Google Scholar]
- 43. Huang W, Li L, Myers JR, et al. ART: a next-generation sequencing read simulator. Bioinformatics 2012;28:593–4. [DOI] [PMC free article] [PubMed] [Google Scholar]
- 44. Keane TM, Wong K, Adams DJ.. RetroSeq: transposable element discovery from next-generation sequencing data. Bioinformatics 2013;29:389–90. [DOI] [PMC free article] [PubMed] [Google Scholar]
- 45. Fiston-Lavier AS, Barron MG, Petrov DA, et al. T-lex2: genotyping, frequency estimation and re-annotation of transposable elements using single or pooled next-generation sequencing data. Nucleic Acids Res 2015;43:e22.. [DOI] [PMC free article] [PubMed] [Google Scholar]
Associated Data
This section collects any data citations, data availability statements, or supplementary materials included in this article.