

Abstract
The ryanodine receptor ion channel RyR1 is present in skeletal muscle and has a large cytoplasmic N-terminal domain and smaller C-terminal pore-forming domain comprising six transmembrane helices, a pore helix, and a selectivity filter. The RyR1 S6 pore-lining helix has two conserved glycines, Gly-4934 and Gly-4941, that facilitate RyR1 channel gating by providing S6 flexibility and minimizing amino acid clashes. Here, we report that substitution of Gly-4941 with Asp or Lys results in functional channels as indicated by caffeine-induced Ca2+ release response in HEK293 cells, whereas a low response of the corresponding Gly-4934 variants suggested loss of function. Following purification, the RyR1 mutants G4934D, G4934K, and G4941D did not noticeably conduct Ca2+ in single-channel measurements. Gly-4941 replacement with Lys resulted in channels having reduced K+ conductance and reduced selectivity for Ca2+ compared with wildtype. RyR1-G4941K did not fully close at nanomolar cytosolic Ca2+ concentrations and nearly fully opened at 2 μm cytosolic or sarcoplasmic reticulum luminal Ca2+, and Ca2+- and voltage-dependent regulation of RyR1-G4941K mutant channels was demonstrated. Computational methods and single-channel recordings indicated that the open G4941K variant results in the formation of a salt bridge to Asp-4938. In contrast, wildtype RyR1 was closed and not activated by luminal Ca2+ at low cytosolic Ca2+ levels. A model suggested that luminal Ca2+ activates RyR1 by accessing a recently identified cytosolic Ca2+-binding site in the open channel as the Ca2+ ions pass through the pore.
Keywords: membrane transport, molecular dynamics, mutagenesis, ryanodine receptor, sarcoplasmic reticulum (SR), skeletal muscle
Introduction
The skeletal muscle ryanodine receptor ion channel (RyR1) is a 2,200-kDa homotetrameric ion channel that releases Ca2+ ions from an intracellular Ca2+ store, the sarcoplasmic reticulum (SR)4 (1–5). The large RyR1 cytoplasmic N-terminal “foot” structure forms the site of regulation by multiple factors that include Ca2+, Mg2+, ATP, and in vitro ligands such as ryanodine and caffeine. The C-terminal transmembrane domain forms a pore in the SR membrane that conducts monovalent and divalent cations (∼800 pS with 250 mm K+ as conducting ion, ∼150 pS with 50 mm Ca2+) but is selective for divalent cations (permeability ratio of Ca2+/K+ ∼7:1). Mutations in RyR1 give rise to central core disease and malignant hyperthermia muscle diseases (6). Many of the naturally occurring central core disease mutations are in the C-terminal pore-forming region and impair RyR1 activity and ion conductance.
RyR1 has a pore structure characteristic of the voltage-gated ion channel family (7–12). The RyR1 pore-forming region has an inner S6 helix, a pore helix, and a selectivity filter GGGIGDE motif (Fig. 1). Mutagenesis and single-channel measurements showed that negatively charged luminal residues Asp-4899 and Glu-4900 and the cytosolic residues Asp-4938, Glu-4942, and Asp-4945 in the pore-lining S6 helix impact RyR1 ion permeation and selectivity (13, 14). The RyR1 S6 pore-lining helix has also two conserved glycines, Gly-4934 and Gly-4941, whose replacement with uncharged residues with an increased side-chain volume altered RyR1 channel gating and ion permeation (15). High-resolution cryoelectron microscopy (cryo-EM) using open RyR1 (Fig. 1) and closed RyR1 (16) and cardiac muscle RyR2 isoforms (17) provided structural insights in the mechanisms of channel opening and closing. Binding sites for channel activators Ca2+, ATP, and caffeine were identified (16). It was also shown that the RyR2 pore constriction site of Ile-4868 in the closed state is shifted to Gln-4864 in the open state (corresponding to Ile-4937 and Gln-4933 in RyR1, respectively) (17). Ion-pulling simulations that generated an open-channel conformation of RyR1 (18) from the 3.8-Å closed state of RyR1 (7) also showed that the pore constriction site was shifted from Ile-4937 in the closed channel to Gln-4933 in the open channel.
Figure 1.

Alignment of RyR pore sequences and RyR1 structures. A, shown are the amino acid sequences of the pore region of rabbit RyR1, RyR2, and RyR3. B, open RyR1 channel structure (PDB code 5tal). C, pore structure of RyR1 (PDB code 5tal). For clarity, B and C show only two of the four RyR1 subunits.
The premise of this study was that Gly-4934 and Gly-4941 have critical roles in the ion permeation and Ca2+ regulation of RyR1. We addressed this by replacing the two glycines with two oppositely charged residues, aspartic acid and lysine. The results indicate that RyR1-G4934D, G4934K, and G4941D mutants were not gated by Ca2+, did not conduct Ca2+, and had reduced K+ conductances in single-channel measurements. In contrast to the closed wildtype (WT) channel, a K+-conducting RyR1-G4941K mutant channel was recorded at nanomolar Ca2+ concentrations. The mutant channel was nearly fully opened by SR luminal Ca2+ in a voltage-dependent manner, which suggested that luminal Ca2+ activated RyR1-G4941K by accessing a cytosolic Ca2+-binding site. Computational methods suggested that RyR1-G4941K formed a salt bridge with Asp-4938. Single-channel measurements of RyR1-G4941K/D4938N and RyR1-G4941K/D4945N mutants validated the computational predictions.
Results
Expression and functional properties of RyR1-Gly-4934 and RyR1-Gly-4941 mutants
To assess the functional role of two conserved glycines in the S6 pore-lining helix in RyR1 gating and ion permeation, Gly-4934 and Gly-4941 were mutated to negatively charged aspartic acid and positively charged lysine. RyR1 mutant protein expression levels in HEK293 cells ranged from ∼50 to 100% of WT (Table 1). In initial experiments, expression of functional channels was studied using two assays. A cellular Ca2+ release assay indicated the number of HEK293 cells that expressed Ca2+-conducting WT and mutant channels, using the Ca2+-releasing drug caffeine. Retention of function in membrane isolates was determined in an in vitro ligand-binding assay using [3H]ryanodine, a plant alkaloid commonly used to assess RyR activity and content (19). Caffeine-induced Ca2+ release was observed in 30–50% of HEK293 cells that expressed WT-RyR1 (Fig. 2). Cells expressing RyR1-G4934D or -G4934K showed a caffeine response near background levels, whereas replacement of Gly-4941 with aspartic acid or lysine showed a caffeine response similar to WT in ∼75% of cells. This suggests a reduced number of HEK293 cells expressed caffeine-sensitive, Ca2+-conducting mutant channels. The variable responses may have resulted from the non-homogeneous exposure to caffeine and removal of Ca2+ by cellular transport systems. The in vitro [3H]ryanodine-binding assay in membrane isolates showed no binding for RyR1-G4934D to levels for RyR1-G4941K that exceeded WT (Table 1). This indicated variable levels of retention of function of the mutants compared with WT. Major differences in cellular caffeine-induced Ca2+ release response and [3H]ryanodine binding in membrane isolates were observed for RyR1-G4934K and -G4941D. These may have resulted from RyR1-G4934K having a reduced sensitivity to caffeine and RyR1-G4941D having lost function during isolation or in the binding assay. An alternative possibility for reduced sensitivity to caffeine and loss of high-affinity [3H]ryanodine binding but not Ca2+-dependent channel activity is considered in single-channel measurements described below.
Table 1.
Single channel measurements with wildtype and mutant RyR1s
The following abbreviations are used: Ry, ryanodine; ND, not determined. Caffeine response indicates the number of HEK293 cells showing a caffeine-induced Ca2+ response normalized to WT. Single-channel data of mutant channels not conducting Ca2+ were excluded from the statistical analysis. Single-channel open probabilities (Po) and K+ conductances were determined with 2 μm Ca2+ in the trans (SR luminal) lipid bilayer chamber. Ca2+ currents were determined at 0 mV.
| Intensity on immunoblots | Caffeine response | Bmax of [3H]Ry binding | Po (2 μm calcium) | Po (0.1 μm calcium) | γK+ | ICa (+10 mm calcium trans) | PCa/PK | |
|---|---|---|---|---|---|---|---|---|
| % WT | % WT | % WT | pS | pA | ||||
| WT-RyR1 | 100 | 100 | 100 | 0.13 ± 0.04(9) | 0.01 ± 0.01(5) | 820 ± 3(9) | −2.3 ± 0.1(5) | 6.6 ± 0.1(5) |
| G4934D | 51.4 ± 12.8(5) | 2.0 ± 1.4(4)a,b | 0 ± 0(6)a,b,c | 0.91 ± 0.05(13) | 0.95 ± 0.04(5) | 519 ± 45(15) | −0.1 ± 0.1(11) | ND |
| G4934K | 80.0 ± 24.9(5) | 2.6 ± 1.3(4)a,b | 24.8 ± 6.0(9)a,b,c | 0.99 ± 0.10(15) | 0.57 ± 0.17(7) | 304 ± 30(20) | −0.1 ± 0.1(10) | ND |
| G4941D | 106.2 ± 28.7(6) | 84.0 ± 30.0(4) | 5.3 ± 2.2(6)a,b,c | 0.48 ± 0.18(7) | 0.51 ± 0.11(7) | 413 ± 79(9) | −0.1 ± 0.1(7) | ND |
| G4941K | 80.6 ± 18.7(5) | 72.9 ± 19.2(4) | 130.5 ± 14.9(15)d | 0.89 ± 0.04(14)a | 0.56 ± 0.10(9)a | 364 ± 5(10)a,c,d | −0.6 ± 0.1(7)a,d | 2.1 ± 0.1(7)a,d |
| G4941 M | 115.6 ± 11.2(5) | 63.5 ± 11.2(4) | 37.8 ± 9.2(10)a,b,c | 0.15 ± 0.05(9)b | 0.01 ± 0.01(9)b | 773 ± 3(9)b,c | −2.0 ± 0.1(7)b | 6.0 ± 0.1(6)b,c |
| D4938N | 84.1 ± 29.3(4) | 49.9 ± 11.6(5) | 128.3 ± 14.3(8)d | 0.13 ± 0.04(15)b | 0.01 ± 0.01(3)b | 520 ± 6(9)a,b,d,e | −0.8 ± 0.1(4)a,d,e | 3.3 ± 0.2(4)a,d,e |
| G4941K/D4938N | 97.5 ± 5.2(5) | 115.3 ± 15.2(4)c,d | 135.0 ± 23.1(7)d | 0.13 ± 0.05(4)b | 0.22 ± 0.14(4) | 264 ± 78(4)a,b,c,d | −0.6 ± 0.1(4)a,d | <1 (4)a,b,c,d |
| D4945N | 61.7 ± 33.6(4) | 41.7 ± 3.6(5) | 50.9 ± 4.8(8)b,c | 0.06 ± 0.02(11)b | 0.01 ± 0.01(3)b | 737 ± 11(6)a,b,c,e | −2.0 ± 0.2(5)b,c,e | 6.5 ± 0.6(5)b,e |
| G4941K/D4945N | 48.2 ± 12.6(5) | 40.9 ± 10.4(4) | 57.6 ± 9.1(7)b,c | 0.99 ± 0.01(5)a,c,d | 0.99 ± 0.01(5)a | 183 ± 3(5)a,b,c,d | −0.5 ± 0.1(4)a,d | 1.0 ± 0.2(5)a,d |
a p < 0.05 compared with WT.
b p < 0.05 compared with G4941K.
c p < 0.05 as compared with D4938N.
d p < 0.05 as compared with D4945N by analysis of variance.
e Data are from Ref. 14.
Figure 2.
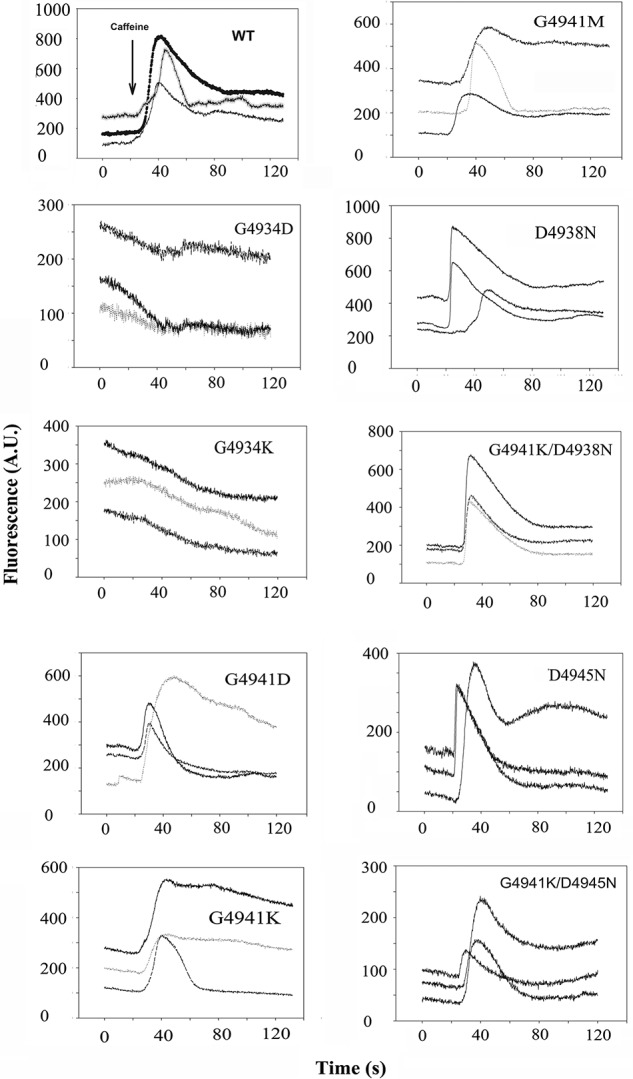
Caffeine-induced Ca2+ release in HEK293 cells expressing WT and mutant RyR1s. Ca2+ transients were determined in Ca2+-free Krebs Ringers Henseleit bath solution as changes of Fluo-4 fluorescence (F/Fo) before and following the addition of ∼8 mm caffeine to the bath solution. Arrow in top left panel indicates the position of caffeine addition to WT and mutant cells. Number of mutant cells showing a caffeine response were normalized to WT cells showing a caffeine response and are summarized in Table 1.
Single-channel measurements with WT- RyR1 and Gly-4934 and Gly-4941 mutants
Single channel measurements were performed with purified WT and mutant RyR1s to determine how mutagenesis of Gly-4934 and Gly-4941 affected channel gating and ion permeation. WT and mutant RyR1 channels were solubilized using the zwitterionic detergent CHAPS, purified on sucrose gradients, and reconstituted in proteoliposomes by removing the detergent by dialysis (20). In recording single channels, we took advantage of the finding that RyRs are Ca2+-gated channels impermeant to Cl− and conduct K+ more efficiently than Ca2+. The upper left trace in Fig. 3A shows a partially activated single WT-RyR1 channel recorded using 0.25 m KCl and 2 μm Ca2+ on both sides of the bilayer. K+ conductance was 820 pS (Fig. 3A, right panel, and Table 1). Reduction to 0.1 μm cytosolic Ca2+ decreased channel open probability (Po) to near zero (Fig. 3A, 2nd trace on left, and Table 1). In the presence of 10 mm SR luminal Ca2+, a Ca2+ current of −2.3 pA at 0 mV and reversal potential (Erev) of 9.2 were obtained (Fig. 3A, 3rd trace, right panel). Applying constant field theory, Erev of 9.2 mV resulted in a permeability ratio of Ca2+ over K+ (PCa/PK) of 6.6 for WT (Table 1).
Figure 3.

Single-channel measurements of WT and mutant RyR1 channels. Left panels show representative single-channel currents at −35 mV (upper and middle traces) or 0 mV (bottom traces) as downward deflections from the closed states (c−). Channels were recorded in symmetrical 250 mm KCl, 20 mm KHEPES, pH 7.4, 2 μm Ca2+ bath solution (upper traces) and following the subsequent addition of EGTA to yield free cytosolic Ca2+ of 0.1 μm (middle traces) or the addition of 10 mm Ca2+ to the luminal chamber (bottom traces). Right panels show representative current voltage relationships in 250 mm symmetrical KCl (●) and after the addition of 10 mm luminal Ca2+ (○). Averaged Po values and ion permeation properties are summarized in Table 1.
RyR1-G4934D and G4934K mutant channels were nearly fully open at 2 μm cytosolic Ca2+ (Po >0.9), whereas RyR1-G4941D had Po 3–4-fold that of WT (Fig. 3, B–D, top traces on left, and Table 1). Reduction from 2 to 0.1 μm cytosolic Ca2+ reduced Po of RyR1-G4934K about 2-fold, whereas RyR1-G4934D and G4941D maintained a similar Po at 2 and 0.1 μm cytosolic Ca2+. The three RyR1-G4934K, G4934D, and G4941D mutants exhibited a reduced K+ conductance and did not conduct Ca2+. We considered the possibility that exposure to detergent during purification caused loss of function. However, RyR1-G4934D, G4934K, and G4941D also had a reduced K+ conductance and did not conduct Ca2+ when membrane fractions isolated from HEK293 cells were fused with lipid bilayers (data not shown). This suggested that RyR1-G4934D, G4934K, and G4941D mutations had a major impact on channel structure and impaired ion conductances in single-channel measurements.
RyR1-G4941K conducted Ca2+ and had a reduced K+ conductance of 364 pS between ±40 mV compared with 820 pS for WT with 0.25 m KCl on both sides of the bilayer (Fig. 3E and Table 1). Changes in KCl concentration indicated maximal K+ conductances for WT-RyR1 and RyR1-G4941K near 600 mosm K+ (Fig. 4). Maximal conductances and apparent KD values were 453 pS and 38 mm for G4941K versus 943 pS and 28 mm for WT. In the presence of 10 mm luminal Ca2+, the Ca2+ current (−0.6 pA versus −2.3 pA for WT at 0 mV) and permeability ratio of Ca2+ over K+ (PCa/PK = 2.1 versus 6.6 for WT) were greatly reduced (Table 1).
Figure 4.

Conductances as a function of K+ activity. A, representative current voltage relations of G4941K at indicated symmetrical KCl concentrations. B, relationships between WT (●) and G4941K (○) conductances and K+ activities give KD = 28 mm and γmax = 943 pS for WT and KD = 38 mm and ymax = 453 pS for G4941K, using equation γ = γmax (1 + KD/aK[K])−1.
Channel open probability of RyR1-G4941K was elevated at 2 μm cytosolic Ca2+ (0.89 versus 0.13 for WT) and 0.1 μm Ca2+ (0.56 versus 0.01 for WT) (Fig. 3E, Table 1). At 2 μm Ca2+ in the bath solution, the RyR1-G4941K mutation increased the duration of open events (34.6 ms versus 0.47 ms for WT) and decreased the duration of the closed events (0.32 ms versus 6.5 ms for WT) (Table 2). The results suggest that RyR1-G4941K exhibited altered Ca2+-dependent gating and reduced ion conductances compared with WT.
Table 2.
Time analysis of wildtype and mutant RyR1s
Single channels were recorded at 2 μm cytosolic and 2 μm luminal Ca2+ were analyzed.
| Po | No. of events/min | To | Tc | |
|---|---|---|---|---|
| ms | ms | |||
| WT-RyR1 | 0.12 ± 0.04(6) | 13,242 ± 2776(6) | 0.47 ± 0.06(6) | 6.50 ± 2.60(6) |
| G4941K | 0.96 ± 0.01(10)a,b | 7651 ± 1828(10) | 34.6 ± 17.9(10) | 0.32 ± 0.03(10)b |
| G4941M | 0.15 ± 0.06(7)c | 8036 ± 1676(7) | 0.93 ± 0.29(7) | 8.90 ± 2.37(7) |
| D4938N | 0.13 ± 0.04(14)c | 16,829 ± 2445(14) | 0.39 ± 0.05(14) | 6.80 ± 3.30(14)b |
| G4941K/D4938N | 0.13 ± 0.06(4)c | 4291 ± 1193(4) | 1.29 ± 0.19(4) | 28.8 ± 15.3(4) |
| D4945N | 0.05 ± 0.03(8)c | 8237 ± 4044(8) | 0.31 ± 0.02(8) | 71.4 ± 34.6(8)c |
| G4941K/D4945N | 0.99 ± 0.01(5) )a,b,d | 125 ± 76(5)d | 2091 ± 1115(5)a,b,c,d | 0.45 ± 0.11(5)b |
a p < 0.05 compared with WT.
b p < 0.05 compared with D4945N by analysis of variance.
c p < 0.05 compared with G4941K.
d p < 0.05 compared with D4938N.
As a control, RyR1-G4941M was analyzed with methionine having a side-chain volume comparable with lysine. RyR1-G4941M exhibited caffeine-induced Ca2+ release in HEK293 cells (Fig. 2) and bound [3H]ryanodine in an in vitro ligand-binding assay, albeit at reduced levels compared with WT (Table 1). Single-channel measurements showed that replacement of a positively charged residue in G4941K with methionine with a comparable side-chain volume but uncharged side chain resulted in channel open probability, K+ conductance, and permeability ratios of Ca2+ over K+ close to WT (Fig. 3F and Table 1).
Activation of RyR1-G4941K by 2 μm cytosolic or 2 μm luminal Ca2+
Dependence of WT-RyR1 and RyR1-G4941K single-channel activities by 2 μm cytosolic or 2 μm luminal Ca2+ was determined at −35 mV membrane potential, which promoted the movement of luminal Ca2+ to the cis cytosolic side of the bilayer (Fig. 5). In the presence of 0.01 μm cytosolic and luminal Ca2+, WT Po was essentially 0, and G4941K Po was 0.13. An increase in luminal or cytosolic Ca2+ to 2 μm Ca2+ nearly fully activated RyR1-G4941K (Po = 0.86 and 0.98, respectively), whereas WT was incompletely activated by 2 μm cytosolic Ca2+ (Po = 0.16). The results indicate that in contrast to WT, (i) RyR1-G4941K had a Po >0.1 at low cytosolic and luminal Ca2+, which indicated Ca2+-independent open channel state(s), and (ii) was nearly fully opened (Po close to 1.0) by 2 μm luminal or 2 μm cytosolic Ca2+.
Figure 5.

Effects of cytosolic and luminal Ca2+ on single-channel open probabilities of WT and G4941K mutant channels. Single-channel currents are shown at −35 mV as downward deflections from the closed states (c−) in symmetrical 250 mm KCl at indicated Ca2+ concentrations in luminal and cytosolic bilayer chambers.
Altered regulation of RyR1-G4941K by cytosolic Ca2+ in the presence of 2 μm luminal Ca2+
In agreement with rapid 45Ca2+ flux measurements of SR vesicles (21). WT-RyR1 channels were activated by micromolar cytosolic Ca2+ and inhibited by millimolar cytosolic Ca2+ at −35 mV (Fig. 6). Ca2+-dependent regulation of G4941K differed in several respects from WT. G4941K had elevated open probability at 0.01 μm cytoplasmic Ca2+ in the presence of 2 μm luminal Ca2+. G4941K was also nearly fully activated at 2 −100 μm cytosolic Ca2+ and displayed elevated activity at 10 mm cytosolic Ca2+ compared with WT.
Figure 6.

Effects of cytosolic Ca2+ on Po of WT and G4941K mutant channels. Single-channel open probabilities of WT (■) and G4941K (●) were determined at −35 mV in symmetrical 250 mm KCl with 2 μm luminal Ca2+ and indicated cytosolic Ca2+ concentrations. Data are the mean ± S.E. of number of recordings in parenthesis. *, p < 0.05 compared with WT by Student's t test.
RyR1-G4941K regulation by luminal Ca2+
RyR1 has been reported to be regulated by luminal Ca2+ by binding to luminal channel sites (22) or cytosolic sites following passage of luminal Ca2+ through the open channel (23). To distinguish these mechanisms, dependence of channel open probability on the luminal Ca2+ concentration was probed at −35 and +35 mV (Fig. 7). Cytosolic Ca2+ was 0.01 or 2 μm. In WT at 0.01 cytosolic Ca2+, an increase from 0.01 to 10 mm luminal Ca2+ did not increase the low Po at −35 or +35 mV (Fig. 7A). At 2 μm cytosolic Ca2+, an increase of luminal Ca2+ from 0.01 to 10 mm significantly decreased Po at −35 mV but not at +35 mV. Regulation of RyR1-G4941K by luminal Ca2+ differed greatly from WT (Fig. 7B). At 2 μm cytosolic Ca2+, RyR1-G4941K was fully activated at both membrane potentials at 0.01 μm to 10 mm luminal Ca2+ At 0.01 μm cytosolic Ca2+, which kept the mutant channel open, luminal Ca2+ was more effective in increasing Po at negative than positive membrane potentials. This suggested that luminal Ca2+ flowing through the channel accessed cytosolic Ca2+ activation sites in RyR1-G4941K. This was tested further by recording voltage dependence of RyR1-WT and -G4941K channel activities at 0.01 μm cytosolic Ca2+ and 0.01 or 2 μm luminal Ca2+ (Fig. 8). At 0.01 and 2 μm luminal Ca2+, WT channels were closed, displaying no voltage-dependent activity. At 0.01 μm luminal Ca2+, RyR1-G4941K displayed a weak voltage-dependent Po at membrane potentials ranging from −80 to +80 mV. At 2 μm luminal Ca2+, Po was higher at negative than positive membrane potentials. Thus, a larger number of Ca2+ ions appeared to flow through the channel at negative than positive membrane potentials to activate RyR1-G4941K to a greater extent at negative potentials.
Figure 7.
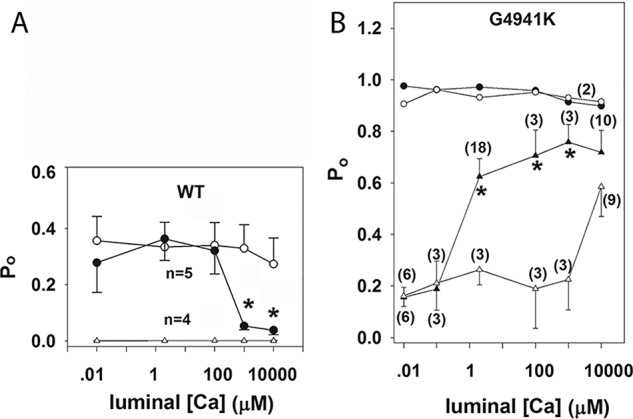
Effects of luminal Ca2+ on WT and G4941K mutant channel activities. Single open channel probabilities of WT (A) and G4941K (B) were determined at −35 mV (● and ▴) or +35 mV (○ and ▵) in symmetrical 250 mm KCl with 0.01 μm (▵ and ▴) or 2 μm (○ and ●) cytosolic Ca2+ and indicated luminal Ca2+ concentrations. Data are the mean ± S.E. of indicated recordings. *, p < 0.05 compared with + 35 mV by Student's t test.
Figure 8.
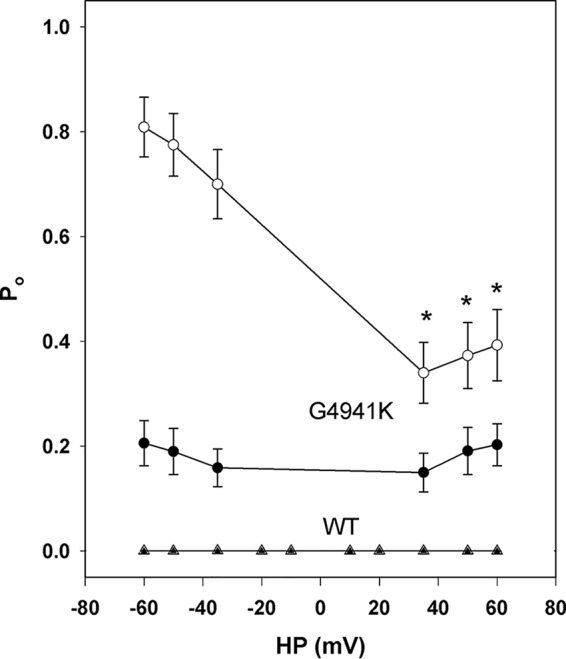
Effects of luminal Ca2+ and membrane potential on Po of WT and G4941K mutant channel activities. Single-channel open probabilities of WT (▵ and ▴) and G4941K (○ and ●) were determined in 250 mm symmetrical KCl at 0.01 μm (● and ▴) or 2 μm (○ and ▵) luminal Ca2+ and indicated membrane potentials. Cytosolic Ca2+ was 0.01 μm. Data are the mean ± S.E. of 4 (WT) and 7 (G4941K) recordings. *, p < 0.05 compared with corresponding negative voltages by Student's t test.
RyR1-WT and -G4941K activities in the presence of FKBP12 and in membrane isolates
We considered the possibility that elevated RyR1-G4941K channel open probability may result from the absence of FKBP12, a closely associated subunit of RyR1. Absence of FKBP12 in the WT-RyR1 macromolecular complex activates Ca2+ release from the SR and increases channel activity in lipid bilayers (24, 25). Proteoliposomes containing purified WT and RyR1-G4941K channels were therefore treated for 30 min with 5 μm FKBP12 before addition to the cis bilayer chamber. Treatment of WT and RyR1-G4941K with FKBP12 did not significantly affect Po at 0.1 and 2 μm Ca2+ compared with channels recorded in the absence of FKBP12, respectively (Fig. 9, A and B). To increase the probability of preserving normal function, experiments were also performed with channels that were not subjected to detergent treatment. Fig. 9, A and B, shows that RyR1-G4941K channels obtained using membrane preparations isolated from HEK293 cells maintained an elevated Po at 0.1 and 2 μm cytosolic Ca2+ compared with WT, respectively. The results indicate that preincubation with FKBP12 and elimination of detergent treatment did not decrease the single-channel activities of RyR1-G4941K to those of WT.
Figure 9.
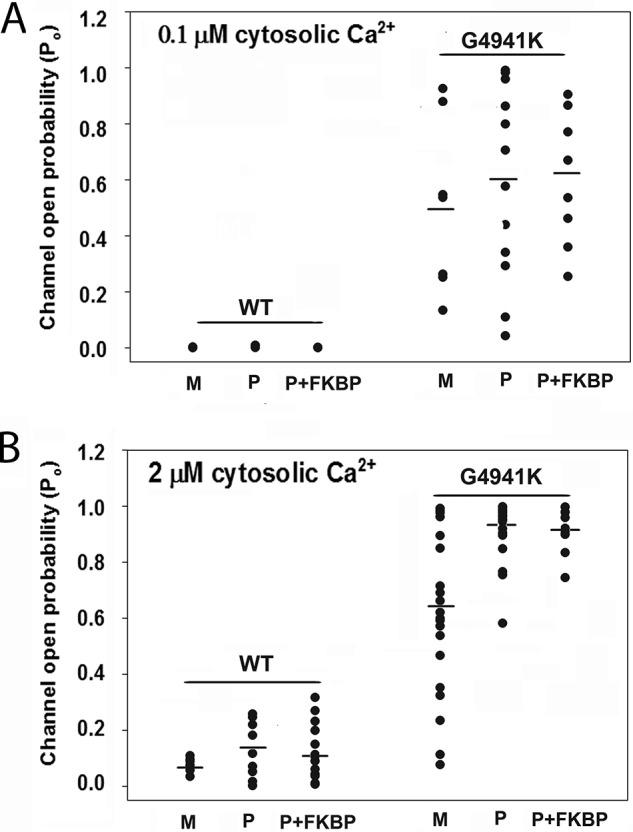
Effects of FKBP12 on purified WT and G4941K mutant channel open probabilities and fusing membrane fractions with lipid bilayers. Single open probabilities of WT and G4941K in 250 mm symmetrical KCl were determined at −35 mV. SR luminal Ca2+ was 2 μm. Single-channel open probabilities were at 0.1 μm (A) and 2 μm (B) cytosolic Ca2+ of WT and G4941K membrane isolates (M), purified WT, and G4941K mutant channels not incubated (P), and incubated with 5 μm FKBP12 for 30 min at 24 °C (P+FKBP). Bars show means of data.
RyR1-G4941K interaction with RyR1-Asp-4938 and Asp-4945
Modeling revealed an interaction of RyR1-G4941K with Asp-4938 (Fig. 10, see under “Discussion”). The computational predictions were tested by performing single-channel measurements with RyR1-G4941K/D4938N and G4941K/D4945N double mutants. Their properties were compared with WT, RyR1-G4941K, and two previously studied single-site mutants (RyR1-D4938N and -D4945N) (Tables 1 and 2) (14). The two single-site (D4938N and D4945N) and double-site (G4941K/D4938N and G4941K/D4945N) mutants had cellular caffeine-induced Ca2+ release and bound [3H]ryanodine that indicated function was retained (Fig. 2 and Table 1). In single-channel measurements, substitution of Asp-4938 with Asn in RyR1-D4938N and RyR1-G4941K/D4938 and Asp-4945 with Asn in RyR1–4941K/D4945 reduced K+ conductances and Ca2+ currents at 0 mV (Fig. 3 and Table 1). In contrast, RyR1-D4945N maintained K+ conductance and Ca2+ current close to WT–RyR1.
Figure 10.

Salt bridges in open mutant channels. Upper panels show representative images of salt bridges in G4941K, G4941K/D4945N, and G4941K/D4938N mutant channel structures. Lysine, aspartate, and asparagine are colored blue, red, and green, respectively. Salt-bridge contacts are shown with dotted lines. In the G4941K mutant, G4941K preferentially forms intersubunit salt bridges with Asp-4938 (observed between two of the four chains). An increase in the G4941K–D4938 interaction in the G4941K/D4945N mutant is observed in three of the four chains. In the G4941K/D4938N double mutant, we observe attenuation of the G4941K–D4938N interaction. A small preference of G4941K to form an intrasubunit salt bridge with Asp-4945 is observed in one of four subunits. The lower panels show distance distributions for the three mutants. Distances were monitored between the terminal amine groups and the oxygen or nitrogen atoms in the carboxyl or amide side chains. Distances were computed among all four chains for 11 structures sampled from MD simulations of each of the three open-channel RyR1 structures (PDB codes 5t9v, 5tal, and 5ta3). Distances less than 3.5 Å are considered as potential salt bridges. For G4941K, we observe a salt bridge preference between G4941K and Asp-4938. When Asp-4945 is mutated to Asn, we observe an increased preference for the G4941K-Asp-4938 salt bridge. As expected, mutating Asp-4938 to Asn attenuates the salt-bridge formation, and G4941K now shows a preference for Asp-4945.
RyR1-D4938N, -D4945N, and -G4941K/D4938N had channel open probabilities comparable with WT-RyR1 at 2 μm cytosolic Ca2+ (Fig. 3 and Table 1). In contrast, RyR1-G4941K/D4945N maintained high Po comparable with RyR1-G4941K (Po ∼1.0 versus 0.89). Significant differences were also obtained for the open and closed times (Table 2). Compared with the D4938N mutant, the mean open time of RyR1-G4941K/D4938N increased 4-fold (p < 0.05, Student's t test), and compared with G4941K, it decreased ∼25-fold. Mean closed time of RyR1-G4941K/D4938N increased ∼4-fold compared with WT-RyR1 and RyR1-D4938N (p < 0.05, Student's t test). The mean open time of RyR1-G4941K/D4945N increased ∼4000-, ∼60-, and 6,500-fold, respectively, compared with WT, RyR1-G4941K, and D4945N. The mean closed time of RyR1-G4941K/D4945N decreased 14-fold compared with WT, was comparable with RyR1-G4941K, and decreased ∼160-fold compared with RyR1-D4945N. The results suggest that attenuation of the G4941K interaction with Asp-4938 favors the closed state, whereas attenuation of the G4941K-D4945 interaction favors the open state.
Discussion
The principal finding of this study is that RyR1-G4941K exhibits a marked increase in the sensitivity of SR luminal Ca2+ regulation in single-channel recordings. The RyR1-G4941K mutant exhibited a caffeine-induced Ca2+ response in HEK293 cells and bound [3H]ryanodine, but it had reduced Ca2+ over K+ permeability ratio compared with WT. This was in contrast to the finding that RyR1-G4934D and -G4934K mutants lost caffeine-induced Ca2+ response in HEK293 cells, had a pronounced decrease in [3H]ryanodine binding, and Ca2+ currents decreased to background levels. These findings suggest loss-of-function channels in HEK293 cells, membrane isolates, and single-channel measurements. By comparison, the G4941D mutation resulted in a more complex behavior. RyR1-G4941D responded to caffeine, which suggested the formation of a functional Ca2+-conducting channel in HEK293 cells. However, [3H]ryanodine binding was low, and Ca2+ currents decreased to background levels, which suggested loss of function on removal from HEK293 cells. The mutagenesis results support the modeling data described below that RyR1-G4941K forms a salt bridge to Asp-4938 and luminal Ca2+ accesses a recently identified Ca2+-binding site in the open-channel conformation.
Our results suggest that the RyR1-G4941K mutant undergoes a structural change during extraction from HEK293 cells. The caffeine-induced Ca2+ release suggested an intracellular Ca2+ store in HEK293 cells in the absence of caffeine. In contrast, single-channel measurements suggested that RyR1-G4941K rapidly released Ca2+ from the intracellular membrane compartment. Neither the potential loss of the FKBP12 subunit from the RyR1 channel complex during purification nor exposure to detergent was found to be responsible for the elevated channel activity in single-channel measurements. The results may be interpreted that the mutant channel underwent a structural change upon removal from the cellular environment.
Previous single-channel studies showed that mutagenesis of the two conserved glycines in the pore-lining S6 pore-lining helix altered RyR function. Substitution of RyR2-Gly-4864 (corresponding to RyR1-Gly-4934) with alanine resulted in no significant changes of RyR2 function, whereas replacement with valine and proline profoundly altered both channel gating and ion permeation (26). Single-channel studies were done using purified RyR2 channel preparations. We reported that replacement of RyR1-Gly-4934 and Gly-4941 with Ala altered RyR1 channel function in single-channel measurements using purified RyR1 preparations (15). A mutation further increasing the side-chain volume at Gly-4934 (G4934V) resulted in loss of function. In contrast, function was maintained when membrane fractions isolated from HEK293 cells were fused with lipid bilayers (18). In this study, loss of function by the G4934D and G4941D mutant channels was seen when proteoliposomes containing the purified mutants or membrane fractions were fused with lipid bilayers.
Aspartic acid has a smaller residue volume than valine (115 Å3 versus 138Å3) (27). This suggested that the introduction of additional negative charges near Asp-4938 and Glu-4942 rendered RyR1-G4934D structurally unstable in HEK293 cells and RyR1-G4941D when removed from the cellular environment.
Modeling the RyR1-G4941K mutation in the open-channel conformation revealed the preferential formation of an intersubunit salt bridge with Asp-4938 (Fig. 10) compared with interaction with Asp-4945. Among the four chains the interaction persists for 34% of the simulation, meaning that on average between one and two salt bridges with Asp-4938 are present at any point in the simulation. Single-channel recordings suggested that the formation of a salt bridge stabilizes the open channel state. In the G4941K/D4945N double mutant, we observed an increase in the G4941K and Asp-4938 interaction in the open-channel conformation and in single-channel measurements a prolonged duration of channel openings. As expected, mutating Asp-4938 to Asn attenuated salt-bridge formation with D4938N. G4941K now showed a preference for intrasubunit salt bridge formation with Asp-4945, and single-channel measurements indicated decreased stability of the open-channel in favor of a closed-channel conformation.
Time analysis of the single-channel data is in agreement with these conclusions. The RyR1-G4941K/D4945N double mutant showed a substantial increase in To compared with RyR1-G4941K and D4945N, which indicated increased stability of the open-state or a barrier to return to the closed state. In contrast, the G4941K/D4938N double mutation resulted in an elevated Tc compared with G4941K and D4938N, which implies that the closed state was more stable or that there was an additional barrier to opening. As a control, we modeled the open channel conformation of the G4941M mutation and monitored the distances between G4941M and Asp-4938 or Asp-4945 (Fig. 11). We observed closer contacts of G4941M with Asp-4945; however, neither showed significant contacts below the 3.5 Å range required for salt-bridge formation.
Figure 11.
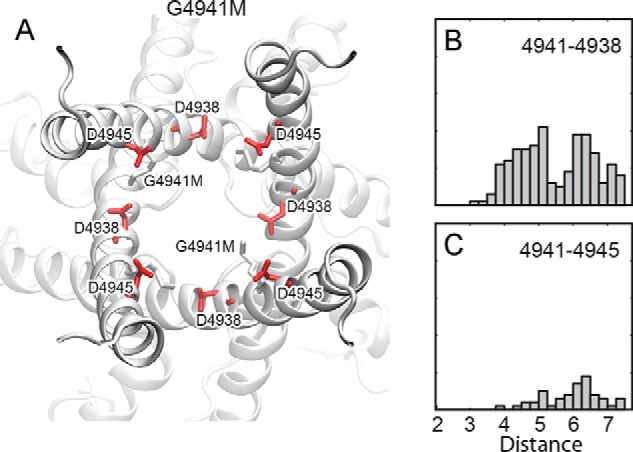
G4941M contacts in the open channel. A, as a control the conformations of G4941M are shown with respect to Asp-4938, Asp-4945, and the pore. G4941M is observed to move into an intersubunit pocket that is out of the pore and below Asp-4938 explaining contacts between Asp-4938 and G4941M and the increased pore radius of the G4941M mutation compared with G4941K. The two right panels monitor distances between G4941M and Asp-4938 (B) or Asp-4945 (C). We observe more close contacts between G4941M and Asp-4938 than between G4941M and Asp-4945; however, neither show significant contacts below 3.5 Å (the range expected for salt-bridge formation).
Single-channel measurements showed that replacement of glycine with positively charged lysine reduced K+ conductance and Ca2+ selectivity of RyR1-G4941K, G4941K/D4938N, and G4941K/D4945N mutants to a greater extent than G4941M, D4938N, and D4945N mutants. Pore profiles for the open-channel RyR1-G4941K, G4941M, G4941K/D4938N, and G4941K/D4945N mutants are compared with WT in Fig. 12A. The four mutations had a pore radius comparable with WT at Gly-4894, a site of the selectivity filter, and Gln-4933, the pore constriction site of the open RyRs. In contrast, the G4941K mutation decreased the pore radius from ∼5 Å in the WT open channel to ∼3 Å. Combining the D4945N mutation with G4941K preserved the radius of RyR1-G4941K but decreased the variance of the radius, likely due to an increased preference for an intersubunit salt bridge between G4941K and Asp-4938. The G4941K/D4938N double mutation resulted in a small decrease in pore radius compared with G4941K, which was likely due to the decreased formation of intersubunit salt bridges. The decreased formation of intersubunit salt bridges caused G4941K to either protrude into the pore or form an intrasubunit salt bridge with Asp-4945, which caused the β, γ, or δ carbons of lysine to protrude into the pore. RyR1-G4941M had a pore radius of ∼4.5 Å. A move out of the pore into an intersubunit pocket may explain the larger pore radius for methionine compared with G4941K.
Figure 12.
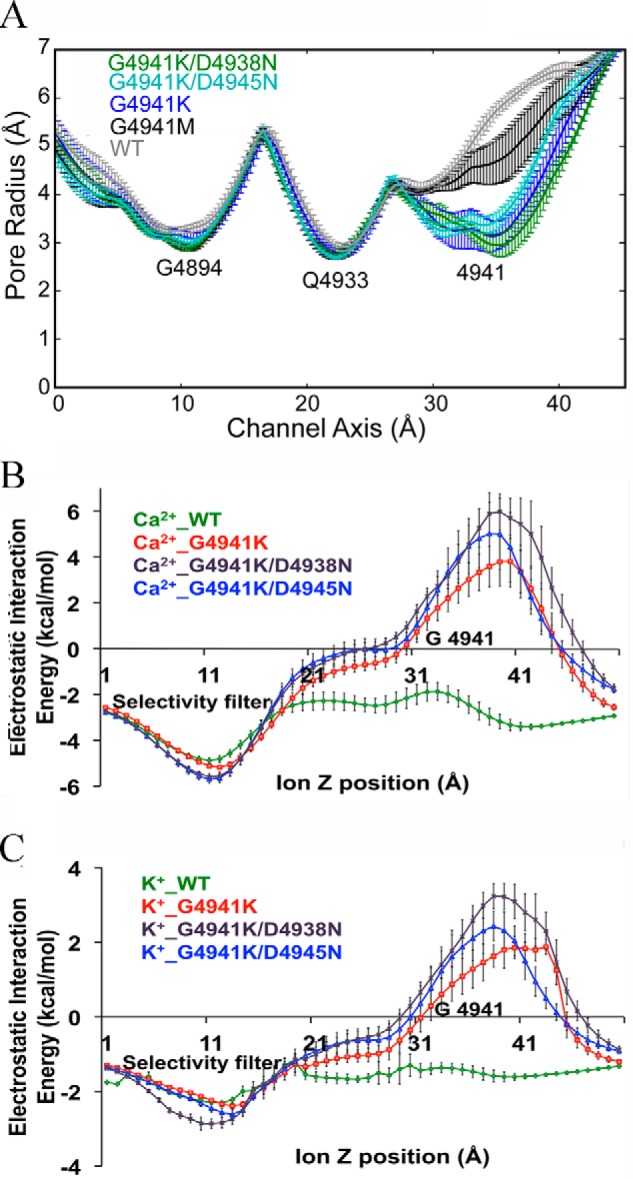
Pore profiles and electrostatic interaction energies for WT and G4941 mutant channels. A, Gly-4941 mutations decreased the pore radius from ∼5 Å in the WT open channel. The G4941K mutation shows a 3-Å pore radius with a significant amount of fluctuation. Introducing the D4945N mutation to the G4941K mutant preserves the radius of the G4941K mutant but significantly decreases the variance of the radius, likely due to increased preference for intersubunit salt bridges between G4941K and Asp-4938. The G4941K/D4938N double mutant shows a decreased pore radius compared with the G4941K mutant likely due to the formation of less salt bridges and the formation of the G4941K-Asp-4945 intrasubunit salt bridge. A move out of the pore may explain the larger pore radius for methionine compared with lysine in Gly-4941. B and C, Ca2+– and K+–protein interaction energies in WT and mutants. Changes in the electrostatics of Ca2+ (B) and K+ (C) ion passages through the pore in WT-RyR1, G4941K, G4941K/D4938N, and G4941K/D4945N. The interaction energies were estimated by performing APBSmem calculations on 10 structures, which were sampled evenly over the last 5 ns of the respective trajectories. For each of these 10 structures, Ca2+ or K+ were moved through the pore along the channel axis with a step size of 1.0 Å. Error bars represent the difference between the means with a 95% confidence interval.
The data of Fig. 12A suggest that the flow of ions through the channel will be likely limited at two additional sites (RyR1-Gly-4894 and -Gln-4933). Therefore, the changes in pore size at RyR1-Gly-4941 should not be sufficient to account for the reduced ion conductances of RyR1-G4941K, G4941K/D4938N, and G4941K/D4945N. However, the introduction of positive charges from lysine must be also considered. The change in electrostatics was likely to have had a greater effect on Ca2+ carrying a +2 charge than on K+ carrying a +1 charge. To estimate the electrostatics of the ions within the pore, we calculated the electrostatic Ca2+- and K+-protein interaction energies using APBSmem software tool (28, 29). Fig. 12, B and C, shows the interaction energies of the pore residues with Ca2+ and K+ ions as the two ions move through the pore. The results show that the electrostatic interaction energies of WT varied between −5 and −2 kcal/mol for Ca2+ and −2.5 and −1 kcal/mol for K+. A rightward shift from the RyR1-G4941K position was observed for the energy maxima. The negative interaction energies of Ca2+ and K+ are likely primarily due to a favorable interaction with negatively charged amino acid residues (RyR1-Asp-4899 and -Glu-4900) immediately after the GGGIG selectivity motif in the luminal vestibule and negatively charged residues in the cytoplasmic vestibule (Fig. 1A). Substitution of glycine in RyR1-G4941K with four positively charged lysine increased interaction energies for Ca2+ and K+ to +6 and +3.3 kcal/mol, respectively. A further moderate increase in the interaction energies was obtained when the negatively charged aspartate residues in Gly-4941/D4938 and Gly-4941/D4945 were replaced with asparagine. Together, the results of Fig. 12 suggest that the introduction of positive charges in G4941K and the further reduction of negative charges in the two double mutants introduced energetic and structural barriers, both of which likely contributed to the reduced ion conductances and selectivities of RyR1-G4941K, G4941K/D4938N, and G4941K/D4945N.
Recent cryo-EM studies identified a binding site for Ca2+ at the interface of the RyR1 CSol and C-terminal domains (16). Earlier studies indicated that mutations at other sites affected Ca2+-gated channel activity. Substitution of RyR1-Glu-4032 by alanine and the corresponding amino acid residues in the RyR3 isoform reduced Ca2+-gated channel activity (30, 31). RyR1-Glu-4032 is not part of the Ca2+-binding site but was suggested to stabilize the interaction between two RyR1 regions by H+ bonding to amide nitrogens (16). Mutations that give rise to central core disease in skeletal muscle exhibit loss of Ca2+-dependent channel activity and Ca2+ conductance (32–34). Many of the central core disease mutations are located in the pore-forming region of RyR1. To our knowledge, G4941K mutant has not been associated with a human pathology.
Other sites involved in the regulation of RyR1 by Ca2+ include residues in S2 (35), the S4-S5 linker (36, 37), and S6 of the cardiac RyR2 isoform corresponding to RyR1 amino acid residues Gln-4946 to Met-4954 of RyR1 (38). This study extends these findings and shows that sensitivity of RyR1-G4941K to cytosolic and luminal Ca2+ increased compared with WT.
Regulation of the RyRs by luminal Ca2+ has been attributed to luminal Ca2+-sensing channel sites (22, 39–41), the binding to cytosolic sites following the passage of Ca2+ through the open channel (23, 42, 43), or the involvement of Ca2+-sensing sites on both the luminal and cytosolic channel sites (44). To distinguish between luminal and cytosolic Ca2+-regulatory sites, we previously determined the voltage- and Ca2+-dependent regulation of WT-RyR1 (23). As shown in this study, closed WT-RyR1 channels are not activated by luminal Ca2+, and single channels were partially opened by cytosolic ATP in the presence of a low cytosolic Ca2+ concentration. Channels were activated by 50 μm luminal Ca2+ to a greater extent at negative membrane potentials that favored Ca2+ flow through the RyR1 pore than at positive membrane potentials that disfavored passage of Ca2+ through RyR1. This suggested that luminal Ca2+ bound to cytosolic channel sites following their passage through the open channel. A similar result was obtained when the partially open G4941K mutant channel was recorded at a low cytosolic Ca2+ concentration. G4941K was activated to a greater extent by 2 μm luminal Ca2+ at negative than positive membrane potentials. These results are best rationalized by luminal Ca2+ accessing cytosolic channel sites.
A model consistent with the results of this study suggests that cytosolic Ca2+ ions access a recently identified Ca2+ activation site located in the cytosolic foot structure of RyR1 (16). The model suggests that cytosolic Ca2+ can access the Ca2+ activation site when channels are closed or open (Fig. 13). In contrast, luminal Ca2+ can access the site in WT only when channels are open. RyR2 channel opening shifts the pore constriction site of Ile-4968 in the closed state to Gln-4864 in the open state (corresponding to Ile-4937 and Gln-4933 in RyR1, respectively) (17). According to the model, luminal Ca2+ activates RyR1 when gaining access to the Ca2+ activation site following passage through the open-channel RyR1-Gln-4933 restriction site. RyR1-G4941K differs in two respects from WT in its regulation by Ca2+. First, the RyR1-G4941K mutant channel remains open at low cytosolic Ca2+ concentrations; second, it exhibits an increased sensitivity to activation by cytosolic and luminal Ca2+ compared with WT. Our results suggest that luminal Ca2+ accesses Ca2+ activation sites as they pass through the pore rather than traveling to openings that lie outside the pore.
Figure 13.

Schematic for cytosolic and luminal Ca2+ access to Ca2+-binding site in closed and open RyR1 channels. Two of the four subunits are shown (PDB code 5tal). Closed- and open-channel RyR1 structures are shown in gray and white, respectively. The position of the Ca2+-binding site is shown in magenta. Shown in blue is a cutaway of the structure highlighting a cavity through which Ca2+ can access the Ca2+-binding site. In the closed-channel RyR1, Ca2+ can only access the Ca2+-binding site from the cytosolic side of the channel. However, in the case of an open-channel RyR1 Ca2+ can also reach the Ca2+-activation site by approaching from the luminal side of the channel.
Experimental procedures
Materials
[3H]Ryanodine was obtained from PerkinElmer Life Sciences; protease and phosphatase inhibitors were from Sigma, and phospholipids were from Avanti Polar Lipids.
Preparation of wildtype and mutant channels
RyR1 mutations G4934D, G4934K, G4941D, and G4941K were introduced by Pfu polymerase-based chain reaction using mutagenic oligonucleotides and the QuikChange II site-directed mutagenesis kit (Stratagene, La Jolla, CA) (45). RyR1-G4941M, G4941K/D4938N, and G4941K/D4945N were prepared using a gene synthesis method and a proprietary protocol (Genewiz, Inc., South Plainfield, NJ). WT-RyR1 and mutants were transiently expressed in HEK293 cells using FuGENE 6 (Roche Applied Sciences) or jetPRIME (Polyplus, New York) according to the manufacturers' instructions. Cells were maintained in DMEM/F-12 (1:1) medium containing 10% fetal bovine serum at 37 °C and 5% CO2 and plated the day before transfection. Following transfection, cells were maintained at 35 or 37 °C and harvested ∼70 h after transfection. Crude membrane isolates (45) and proteoliposomes containing purified WT or mutant RyR1 channels were prepared as described (20).
Cellular Ca2+ release
Stored Ca2+ release was determined as described (46). Briefly, HEK293 cells were grown on glass coverslips, and Ca2+ transients were monitored with the fluorescence Ca2+ indicator Fluo-4. The addition of ∼8 mm caffeine induced cellular Ca2+ release. Individual cells were monitored using the EasyRatioPro algorithm (Photon Technology International, Lawrenceville, NJ).
SDS-PAGE and immunoblot analyses
Proteins in crude membrane fractions (20 μg of protein/lane) were separated using 3–12% gradient SDS-PAGE, transferred overnight to nitrocellulose membranes (37), and probed with primary rabbit anti-RyR1 polyclonal antibody 6425 prepared by ΨProSci against RyR1 sequence FIKGLDSFSGKPRGSG. Immunoblots were developed using enhanced chemiluminescence and quantified using the Bio-Rad ChemiDoc MP Imaging System and ImageQuantTL analysis software.
[3H]Ryanodine binding
Ryanodine binds with high specificity to RyR1 and is widely used to probe RyR activity and content (19). [3H]Ryanodine binding was measured by incubating crude membrane isolates for 4–5 h at 24 °C with a near-saturating concentration of 20 nm [3H]ryanodine in 20 mm imidazole, pH 7.0, 0.6 m KCl, protease inhibitors, 1 mm oxidized glutathione (GSSG), and 0.1 mm Ca2+. Non-specific binding was determined using a 100-fold excess of unlabeled ryanodine. Aliquots of samples were diluted 9-fold with ice-cold water and placed on Whatman GF/B filters saturated with 2% polyethyleneimine. Filters were washed with ice-cold 0.1 m KCl, 1 mm imidazole, pH 7.0. Radioactivity remaining on the filters was determined by liquid scintillation counting to obtain bound [3H]ryanodine.
Single-channel recordings
Single-channel measurements were performed using planar lipid bilayers (14). Unless otherwise indicated, proteoliposomes containing purified recombinant RyR1s were added to the cis (cytosolic) chamber of a bilayer apparatus containing 0.25 m KCl in the cis chamber and 20 mm KCl in the trans (SR luminal) chamber in 20 mm KHEPES, pH 7.4, and 2 μm Ca2+. After the appearance of channel activity, the trans KCl concentration was increased to 0.25 m KCl. A strong dependence of WT channel activity on cis Ca2+ concentration indicated that the cytosolic region faced the cis chamber of the bilayer. The trans side of the bilayer was defined as ground. Electrical signals were filtered at 2 kHz (0.5 kHz for Ca2+ currents at 0 mV), digitized at 10 kHz, and analyzed at 50% threshold setting (14). Data acquisition and analysis of 2-min recordings were performed using a commercially available software package (pClamp, Axon Instruments). Single-channel activities were also recorded in symmetrical 0.25 m KCl solution with 10 mm Ca2+ on the trans side, and the reversal potential (Erev) was measured to determine permeability ratios. The permeability ratio of Ca2+ versus K+ (PCa/PK) was calculated using a modified form of the Goldman-Hodgkin-Katz Equation 1,
| (1) |
Computational methods
To model the effects of the mutations, in silico mutations were performed for each of the three open-channel cryo-EM structures (PDB codes 5tal, 5t9v, and 5ta3). Amino acid substitutions were performed using Eris (47, 48) followed by side-chain optimization in GROMACS 4.6.1 (49). Starting structures from Eris were obtained from 40 independent Monte-Carlo simulations with 20 steps each. The lowest energy structure among the 40 structures was selected as the starting point for GROMACS simulations. Each system was solvated using the TIP3P water model. Simulations were performed using the CHARMM36 force field (50, 51). The systems were equilibrated with 10,000 steps of steepest descent energy minimization followed by 200 ps of constant volume MD simulation performed at 310 K. Simulations were performed using a time step of 2 fs with all bonds constrained using the LINCS algorithm (52). Particle mesh Ewald was used for long-range electrostatic interactions. A 10-Å cutoff was used for non-bonded interactions. For production runs, 10 ns of MD simulations were performed at constant temperature and pressure of 310 K and 1 atm followed by 4 ns of annealing. For annealing simulations, pressure was held constant at 1 atm, whereas temperature was linearly decreased from 310 to 200 K. A 10,000 kJ/(mol·nm) potential was applied to fix the backbone atoms throughout the simulations and prevent large structural arrangements in the absence of the membrane. For analysis, 10 structures sampled evenly over the last 5 ns of the simulation were extracted. Pore profiles were calculated using the HOLE program (53). Data are the mean and standard error among 30 pore profiles computed from the sampled structures.
The Adaptive Poisson-Boltzmann Solver (APBS) as applied in APBSmem (28) was used to examine the electrostatics of Ca2+ and K+ ion passage through the pore. APBSmem estimates the protein-ion electrostatic interaction energy by subtracting the energies of the membrane-embedded protein without the ion and the energy of the ion in bulk water from the total energy of the protein-ion assembly embedded in the lipid bilayer. For analysis, 10 WT and mutant structures sampled evenly over the last 5 ns of the respective simulations were extracted. Two focusing layers with a grid length of 90 Å and a total of 97 grid points in the x, y, and z dimensions were employed. Ion concentrations were set at 0.1 m, both for Ca2+ and K+; the temperature was 298 K, and non-linear Poisson-Boltzmann method was engaged in Adaptive Poisson-Boltzmann Solver (29). To omit the membrane from the pore region, the upper and lower exclusions were set at 16 Å. Based on previously reported calculations of Ca2+ solvation energy profile of the TRPV1 receptor (54), membrane thickness was 42.5 Å, and headgroup thickness was 7 Å. During the calculation, the dielectric constant for protein and membrane was set at 2.0, and the dielectric constant for headgroups and solvent was set at 80.0. The ion step size was 1.0 Å along the channel axis and the ionic radius used for Ca2+ and K+ were 1.03 and 1.41 Å, respectively.
Biochemical assays and data analysis
Free Ca2+ concentrations were determined by adding varying amounts of Ca2+ to 1 mm EGTA solutions. Free Ca2+ concentrations were measured using a Ca2+-selective electrode. Differences between samples were analyzed using Student's t test or analysis of variance followed by Tukey's test, where p < 0.05 was considered significant.
Author contributions
L. X., D. D. M., N. V. D., and G. M. designed the experiments; L. X., D. D. M., V. R. C., Y. W., and D. A. P. performed the experiments, and D. D. M. and G. M. wrote the paper. All authors reviewed the results and approved the final version of the manuscript.
This work was supported by National Institutes of Health Grant AR018687. The authors declare that they have no conflicts of interest with the contents of this article. The content is solely the responsibility of the authors and does not necessarily represent the official views of the National Institutes of Health.
- SR
- sarcoplasmic reticulum
- pS
- picosiemens
- PDB
- Protein Data Bank
- MD
- molecular dynamics
- APBS
- Adaptive Poisson-Boltzmann Solver.
References
- 1. Franzini-Armstrong C., and Protasi F. (1997) Ryanodine receptors of striated muscles: a complex channel capable of multiple interactions. Physiol. Rev. 77, 699–729 10.1152/physrev.1997.77.3.699 [DOI] [PubMed] [Google Scholar]
- 2. Fill M., and Copello J. A. (2002) Ryanodine receptor calcium release channels. Physiol. Rev. 82, 893–922 10.1152/physrev.00013.2002 [DOI] [PubMed] [Google Scholar]
- 3. Meissner G. (2002) Regulation of mammalian ryanodine receptors. Front. Biosci. 7, d2072–d2080 [DOI] [PubMed] [Google Scholar]
- 4. Meissner G. (1994) Ryanodine receptor/Ca2+ release channels and their regulation by endogenous effectors. Annu. Rev. Physiol. 56, 485–508 10.1146/annurev.ph.56.030194.002413 [DOI] [PubMed] [Google Scholar]
- 5. Hamilton S. L., and Serysheva I. I. (2009) Ryanodine receptor structure: progress and challenges. J. Biol. Chem. 284, 4047–4051 10.1074/jbc.R800054200 [DOI] [PMC free article] [PubMed] [Google Scholar]
- 6. Lanner J. T., Georgiou D. K., Joshi A. D., and Hamilton S. L. (2010) Ryanodine receptors: structure, expression, molecular details, and function in calcium release. Cold Spring Harb. Perspect. Biol. 2, a003996 [DOI] [PMC free article] [PubMed] [Google Scholar]
- 7. Yan Z., Bai X., Yan C., Wu J., Li Z., Xie T., Peng W., Yin C. C., Li X., Scheres S. H., Shi Y., and Yan N. (2015) Structure of the rabbit ryanodine receptor RyR1 at near-atomic resolution. Nature 517, 50–55 [DOI] [PMC free article] [PubMed] [Google Scholar]
- 8. Gao L., Balshaw D., Xu L., Tripathy A., Xin C., and Meissner G. (2000) Evidence for a role of the lumenal M3-M4 loop in skeletal muscle Ca2+ release channel (ryanodine receptor) activity and conductance. Biophys. J. 79, 828–840 10.1016/S0006-3495(00)76339-9 [DOI] [PMC free article] [PubMed] [Google Scholar]
- 9. Efremov R. G., Leitner A., Aebersold R., and Raunser S. (2015) Architecture and conformational switch mechanism of the ryanodine receptor. Nature 517, 39–43 [DOI] [PubMed] [Google Scholar]
- 10. Ludtke S. J., Serysheva I. I., Hamilton S. L., and Chiu W. (2005) The pore structure of the closed RyR1 channel. Structure 13, 1203–1211 10.1016/j.str.2005.06.005 [DOI] [PMC free article] [PubMed] [Google Scholar]
- 11. Samso M., Feng W., Pessah I. N., and Allen P. D. (2009) Coordinated movement of cytoplasmic and transmembrane domains of RyR1 upon gating. PLoS Biol. 7, e85 10.1371/journal.pbio.1000085 [DOI] [PMC free article] [PubMed] [Google Scholar]
- 12. Zalk R., Clarke O. B., des Georges A., Grassucci R. A., Reiken S., Mancia F., Hendrickson W. A., Frank J., and Marks A. R. (2015) Structure of a mammalian ryanodine receptor. Nature 517, 44–49 [DOI] [PMC free article] [PubMed] [Google Scholar]
- 13. Wang Y., Xu L., Pasek D. A., Gillespie D., and Meissner G. (2005) Probing the role of negatively charged amino acid residues in ion permeation of skeletal muscle ryanodine receptor. Biophys. J. 89, 256–265 10.1529/biophysj.104.056002 [DOI] [PMC free article] [PubMed] [Google Scholar]
- 14. Xu L., Wang Y., Gillespie D., and Meissner G. (2006) Two rings of negative charges in the cytosolic vestibule of type-1 ryanodine receptor modulate ion fluxes. Biophys. J. 90, 443–453 10.1529/biophysj.105.072538 [DOI] [PMC free article] [PubMed] [Google Scholar]
- 15. Mei Y., Xu L., Mowrey D. D., Mendez Giraldez R., Wang Y., Pasek D. A., Dokholyan N. V., and Meissner G. (2015) Channel gating dependence on pore-lining helix glycine residues in skeletal muscle ryanodine receptor. J. Biol. Chem. 290, 17535–17545 10.1074/jbc.M115.659672 [DOI] [PMC free article] [PubMed] [Google Scholar]
- 16. des Georges A., Clarke O. B., Zalk R., Yuan Q., Condon K. J., Grassucci R. A., Hendrickson W. A., Marks A. R., and Frank J. (2016) Structural basis for gating and activation of RyR1. Cell 167, 145–157 10.1016/j.cell.2016.08.075 [DOI] [PMC free article] [PubMed] [Google Scholar]
- 17. Peng W., Shen H., Wu J., Guo W., Pan X., Wang R., Chen S. R., and Yan N. (2016) Structural basis for the gating mechanism of the type 2 ryanodine receptor RyR2. Science 354, aah5324 [DOI] [PubMed] [Google Scholar]
- 18. Mowrey D. D., Xu L., Mei Y., Pasek D. A., Meissner G., and Dokholyan N. V. (2017) Ion-pulling simulations provide insights into the mechanisms of channel opening of the skeletal muscle ryanodine receptor. J. Biol. Chem. 292, 12947–12958 10.1074/jbc.M116.760199 [DOI] [PMC free article] [PubMed] [Google Scholar]
- 19. Sutko J. L., Airey J. A., Welch W., and Ruest L. (1997) The pharmacology of ryanodine and related compounds. Pharmacol. Rev. 49, 53–98 [PubMed] [Google Scholar]
- 20. Lee H. B., Xu L., and Meissner G. (1994) Reconstitution of the skeletal muscle ryanodine receptor-Ca2+ release channel protein complex into proteoliposomes. J. Biol. Chem. 269, 13305–13312 [PubMed] [Google Scholar]
- 21. Meissner G., Darling E., and Eveleth J. (1986) Kinetics of rapid Ca2+ release by sarcoplasmic reticulum. Effects of Ca2+, Mg2+, and adenine nucleotides. Biochemistry 25, 236–244 10.1021/bi00349a033 [DOI] [PubMed] [Google Scholar]
- 22. Sitsapesan R., and Williams A. J. (1995) The gating of the sheep skeletal sarcoplasmic reticulum Ca2+-release channel is regulated by luminal Ca2+. J. Membr. Biol. 146, 133–144 [DOI] [PubMed] [Google Scholar]
- 23. Tripathy A., and Meissner G. (1996) Sarcoplasmic reticulum lumenal Ca2+ has access to cytosolic activation and inactivation sites of skeletal muscle Ca2+ release channel. Biophys. J. 70, 2600–2615 10.1016/S0006-3495(96)79831-4 [DOI] [PMC free article] [PubMed] [Google Scholar]
- 24. Ahern G. P., Junankar P. R., and Dulhunty A. F. (1994) Single channel activity of the ryanodine receptor calcium release channel is modulated by FK-506. FEBS Lett. 352, 369–374 10.1016/0014-5793(94)01001-3 [DOI] [PubMed] [Google Scholar]
- 25. Brillantes A. B., Ondrias K., Scott A., Kobrinsky E., Ondriasová E., Moschella M. C., Jayaraman T., Landers M., Ehrlich B. E., and Marks A. R. (1994) Stabilization of calcium release channel (ryanodine receptor) function by FK506-binding protein. Cell 77, 513–523 10.1016/0092-8674(94)90214-3 [DOI] [PubMed] [Google Scholar]
- 26. Euden J., Mason S. A., Viero C., Thomas N. L., and Williams A. J. (2013) Investigations of the contribution of a putative glycine hinge to ryanodine receptor channel gating. J. Biol. Chem. 288, 16671–16679 10.1074/jbc.M113.465310 [DOI] [PMC free article] [PubMed] [Google Scholar]
- 27. Tsai J., Taylor R., Chothia C., and Gerstein M. (1999) The packing density in proteins: standard radii and volumes. J. Mol. Biol. 290, 253–266 10.1006/jmbi.1999.2829 [DOI] [PubMed] [Google Scholar]
- 28. Callenberg K. M., Choudhary O. P., de Forest G. L., Gohara D. W., Baker N. A., and Grabe M. (2010) APBSmem: a graphical interface for electrostatic calculations at the membrane. PLoS One 5, e12722 10.1371/journal.pone.0012722 [DOI] [PMC free article] [PubMed] [Google Scholar]
- 29. Baker N. A., Sept D., Joseph S., Holst M. J., and McCammon J. A. (2001) Electrostatics of nanosystems: application to microtubules and the ribosome. Proc. Natl. Acad. Sci. U.S.A. 98, 10037–10041 10.1073/pnas.181342398 [DOI] [PMC free article] [PubMed] [Google Scholar]
- 30. Chen S. R., Ebisawa K., Li X., and Zhang L. (1998) Molecular identification of the ryanodine receptor Ca2+ sensor. J. Biol. Chem. 273, 14675–14678 10.1074/jbc.273.24.14675 [DOI] [PubMed] [Google Scholar]
- 31. Du G. G., and MacLennan D. H. (1998) Functional consequences of mutations of conserved, polar amino acids in transmembrane sequences of the Ca2+ release channel (ryanodine receptor) of rabbit skeletal muscle sarcoplasmic reticulum. J. Biol. Chem. 273, 31867–31872 10.1074/jbc.273.48.31867 [DOI] [PubMed] [Google Scholar]
- 32. Dirksen R. T., and Avila G. (2002) Altered ryanodine receptor function in central core disease: leaky or uncoupled Ca2+ release channels? Trends Cardiovasc. Med. 12, 189–197 10.1016/S1050-1738(02)00163-9 [DOI] [PubMed] [Google Scholar]
- 33. Xu L., Wang Y., Yamaguchi N., Pasek D. A., and Meissner G. (2008) Single channel properties of heterotetrameric mutant RyR1 ion channels linked to core myopathies. J. Biol. Chem. 283, 6321–6329 10.1074/jbc.M707353200 [DOI] [PMC free article] [PubMed] [Google Scholar]
- 34. McCarthy T. V., Quane K. A., and Lynch P. J. (2000) Ryanodine receptor mutations in malignant hyperthermia and central core disease. Hum. Mutat. 15, 410–417 10.1002/(SICI)1098-1004(200005)15:5%3C410::AID-HUMU2%3E3.0.CO%3B2-D [DOI] [PubMed] [Google Scholar]
- 35. Gomez A. C., and Yamaguchi N. (2014) Two regions of the ryanodine receptor calcium channel are involved in Ca2+-dependent inactivation. Biochemistry 53, 1373–1379 10.1021/bi401586h [DOI] [PMC free article] [PubMed] [Google Scholar]
- 36. Murayama T., Kurebayashi N., Oba T., Oyamada H., Oguchi K., Sakurai T., and Ogawa Y. (2011) Role of amino-terminal half of the S4-S5 linker in type 1 ryanodine receptor (RyR1) channel gating. J. Biol. Chem. 286, 35571–35577 10.1074/jbc.M111.255240 [DOI] [PMC free article] [PubMed] [Google Scholar]
- 37. Ramachandran S., Chakraborty A., Xu L., Mei Y., Samsó M., Dokholyan N. V., and Meissner G. (2013) Structural determinants of skeletal muscle ryanodine receptor gating. J. Biol. Chem. 288, 6154–6165 10.1074/jbc.M112.433789 [DOI] [PMC free article] [PubMed] [Google Scholar]
- 38. Sun B., Guo W., Tian X., Yao J., Zhang L., Wang R., and Chen S. R. (2016) The cytoplasmic region of inner helix S6 is an important determinant of cardiac ryanodine receptor channel gating. J. Biol. Chem. 291, 26024–26034 10.1074/jbc.M116.758821 [DOI] [PMC free article] [PubMed] [Google Scholar]
- 39. Gaburjakova J., and Gaburjakova M. (2016) Cardiac ryanodine receptor: selectivity for alkaline earth metal cations points to the EF-hand nature of luminal binding sites. Bioelectrochemistry 109, 49–56 10.1016/j.bioelechem.2016.01.002 [DOI] [PubMed] [Google Scholar]
- 40. Györke I., and Györke S. (1998) Regulation of the cardiac ryanodine receptor channel by luminal Ca2+ involves luminal Ca2+ sensing sites. Biophys. J. 75, 2801–2810 10.1016/S0006-3495(98)77723-9 [DOI] [PMC free article] [PubMed] [Google Scholar]
- 41. Gaburjakova J., and Gaburjakova M. (2006) Comparison of the effects exerted by luminal Ca2+ on the sensitivity of the cardiac ryanodine receptor to caffeine and cytosolic Ca2+. J. Membr. Biol. 212, 17–28 10.1007/s00232-006-7018-z [DOI] [PubMed] [Google Scholar]
- 42. Uehara A., Murayama T., Yasukochi M., Fill M., Horie M., Okamoto T., Matsuura Y., Uehara K., Fujimoto T., Sakurai T., and Kurebayashi N. (2017) Extensive Ca2+ leak through K4750Q cardiac ryanodine receptors caused by cytosolic and luminal Ca2+ hypersensitivity. J. Gen. Physiol. 149, 199–218 10.1085/jgp.201611624 [DOI] [PMC free article] [PubMed] [Google Scholar]
- 43. Herrmann-Frank A., and Lehmann-Horn F. (1996) Regulation of the purified Ca2+ release channel/ryanodine receptor complex of skeletal muscle sarcoplasmic reticulum by luminal calcium. Pflugers Arch. 432, 155–157 10.1007/s004240050117 [DOI] [PubMed] [Google Scholar]
- 44. Laver D. R. (2007) Ca2+ stores regulate ryanodine receptor Ca2+ release channels via luminal and cytosolic Ca2+ sites. Biophys. J. 92, 3541–3555 10.1529/biophysj.106.099028 [DOI] [PMC free article] [PubMed] [Google Scholar]
- 45. Gao L., Tripathy A., Lu X., and Meissner G. (1997) Evidence for a role of C-terminal amino acid residues in skeletal muscle Ca2+ release channel (ryanodine receptor) function. FEBS Lett. 412, 223–226 10.1016/S0014-5793(97)00781-3 [DOI] [PubMed] [Google Scholar]
- 46. Wang Y., Xu L., Duan H., Pasek D. A., Eu J. P., and Meissner G. (2006) Knocking down type 2 but not type 1 calsequestrin reduces calcium sequestration and release in C2C12 skeletal muscle myotubes. J. Biol. Chem. 281, 15572–15581 10.1074/jbc.M600090200 [DOI] [PubMed] [Google Scholar]
- 47. Yin S., Ding F., and Dokholyan N. V. (2007) Modeling backbone flexibility improves protein stability estimation. Structure 15, 1567–1576 10.1016/j.str.2007.09.024 [DOI] [PubMed] [Google Scholar]
- 48. Yin S., Ding F., and Dokholyan N. V. (2007) Eris: an automated estimator of protein stability. Nat. Methods 4, 466–467 10.1038/nmeth0607-466 [DOI] [PubMed] [Google Scholar]
- 49. Hess B., Kutzner C., van der Spoel D., and Lindahl E. (2008) GROMACS 4: algorithms for highly efficient, load-balanced, and scalable molecular simulation. J. Chem. Theory Comput. 4, 435–447 10.1021/ct700301q [DOI] [PubMed] [Google Scholar]
- 50. Best R. B., Zhu X., Shim J., Lopes P. E., Mittal J., Feig M., and Mackerell A. D. Jr. (2012) Optimization of the additive CHARMM all-atom protein force field targeting improved sampling of the backbone φ, ψ, and side-chain χ1 and χ2 dihedral angles. J. Chem. Theory Comput. 8, 3257–3273 10.1021/ct300400x [DOI] [PMC free article] [PubMed] [Google Scholar]
- 51. Klauda J. B., Monje V., Kim T., and Im W. (2012) Improving the CHARMM force field for polyunsaturated fatty acid chains. J. Phys. Chem. B 116, 9424–9431 10.1021/jp304056p [DOI] [PubMed] [Google Scholar]
- 52. Hess B. (2008) P-LINCS: a parallel linear constraint solver for molecular simulation. J. Chem. Theory Comput. 4, 116–122 10.1021/ct700200b [DOI] [PubMed] [Google Scholar]
- 53. Smart O. S., Neduvelil J. G., Wang X., Wallace B. A., and Sansom M. S. (1996) HOLE: a program for the analysis of the pore dimensions of ion channel structural models. J. Mol. Graph. 14, 354–360 [DOI] [PubMed] [Google Scholar]
- 54. Marcoline F. V., Bethel N., Guerriero C. J., Brodsky J. L., and Grabe M. (2015) Membrane protein properties revealed through data-rich electrostatics calculations. Structure 23, 1526–1537 10.1016/j.str.2015.05.014 [DOI] [PMC free article] [PubMed] [Google Scholar]