

Abstract
Intestinal fructose uptake is mainly mediated by glucose transporter 5 (GLUT5/SLC2A5). Its closest relative, GLUT7, is also expressed in the intestine but does not transport fructose. For rat Glut5, a change of glutamine to glutamic acid at codon 166 (p.Q166E) has been reported to alter the substrate-binding specificity by shifting Glut5-mediated transport from fructose to glucose. Using chimeric proteins of GLUT5 and GLUT7, here we identified amino acid residues of GLUT5 that define its substrate specificity. The proteins were expressed in NIH-3T3 fibroblasts, and their activities were determined by fructose radiotracer flux. We divided the human GLUT5 sequence into 26 fragments and then replaced each fragment with the corresponding region in GLUT7. All fragments that yielded reduced fructose uptake were analyzed further by assessing the role of individual amino acid residues. Various positions in the first extracellular loop, in the fifth, seventh, eighth, ninth, and tenth transmembrane domains (TMDs), and in the regions between the ninth and tenth TMDs and tenth and 11th TMDs were identified as being important for proper fructose uptake. Although the p.Q167E change did not render the human protein into a glucose transporter, molecular dynamics simulations revealed a drastic change in the dynamics and a movement of the intracellular loop connecting the sixth and seventh TMDs, which covers the exit of the ligand. Finally, we generated a GLUT7–GLUT5 chimera consisting of the N-terminal part of GLUT7 and the C-terminal part of GLUT5. Although this chimera was inactive, we demonstrate fructose transport after introduction of four amino acids derived from GLUT5.
Keywords: glucose transport, fructose, protein chimera, molecular dynamics, membrane protein, GLUT5, GLUT7, transporter
Introduction
Members of the major facilitator superfamily enable sugar transport across membranes. Among others, the GLUT5 (SLC2) family of facilitative sugar transporters provides the different monosaccharides to cells as uniporters. All 14 members share common features, such as 12 putative membrane-spanning helices and intracellular C and N termini, but differ in transport characteristics and tissue expression (1). Fructose transport across the apical membrane of enterocytes is mediated by GLUT5, whereas GLUT2 facilitates transport across the basolateral membrane. Although other members of the GLUT family (e.g. GLUT7, GLUT8, and GLUT12) are present in the small intestine, their expression level and contribution to overall fructose transport seems to be of minor importance (2–4). The involvement of GLUT5 in the pathophysiology of fructose malabsorption is a matter of debate. With this condition, intestinal fructose absorption is limited, leading to osmotic diarrhea combined with abdominal pain and flatulence following fermentation of non-absorbed fructose by colonic bacteria. Although GLUT5 is the only fructose transporter in the apical membrane, GLUT5 expression is not lower in affected subjects (5).
Recently, the crystal structure of rat and bovine Glut5 has been described. The authors provide evidence that a gated pore mechanism with involvement of the seventh and tenth transmembrane domain (TMD), in addition to the previously described rocker switch-type movement, controls transport. On the basis of this crystal structure, several amino acids in the central cavity that could be involved in substrate binding were identified. However, direct fructose transport measurements were not performed (6). Studies with GLUT2–GLUT3 chimeras indicate that the sequence between the ninth and 12th TMD determines the glucose affinity of GLUT2, whereas the region from the seventh to the eighth TMD is involved in fructose recognition (7). Analysis of GLUT5–GLUT3 chimeras revealed that the region between the N terminus and the first intracellular loop and the sequence including the third extracellular loop to the 11th TMD are important for fructose transport (8).
So far, only large regions and not individual amino acid residues have been found to be of importance in fructose transport upon functional analysis. Regarding GLUT5, only chimeras with GLUT family members of different classes were analyzed. GLUT5 and GLUT7 both belong to class II. Although their protein sequence is ∼60% identical, the transport characteristics are different. GLUT5 represents a high-capacity fructose transporter (2), whereas GLUT7 does not transport fructose, and its physiological substrate remains unknown (9). We thus considered that the generation of chimeras of these two transporters might be a suitable model to identify amino acids and protein domains involved in fructose transport.
Results
We constructed GLUT5–GLUT7 chimeras by dividing the complete protein sequence of GLUT5 into 26 fragments that we consecutively replaced with homologous domains of GLUT7. To be able to assess whether the proteins were delivered to the cell membrane, GFP was fused onto the carboxyl terminus. Protein abundance and membrane localization were tested for all chimeras by means of Western blot analysis and fluorescence microscopy. Except for chimera F9, all chimeric proteins were produced properly and were detected in the plasma membrane of NIH-3T3 cells (Figs. S1 and S2).
An analysis of the fructose uptake activity of the GLUT5–GLUT7 chimeras revealed several important regions that mediate fructose transport (Fig. 1). The amino acid numbers of the exchanged fragments are given in brackets. Chimeras F1 (1–18), F3 (43–48), F4 (55–73), F5 (80–96), F6 (101–111), F7 (118–141), F8 (143–162), F10 (183–197), F11 (204–225), F12 (229–241), F14 (255–271), F16 (310–321), F22 (429–447), F23 (453–473), F24 (476–487), and F26 (+5 amino acids) showed normal or even slightly elevated fructose uptake compared with the G5GFP wildtype protein and were not further studied. A decreased uptake ranging between 30% and 80% of that obtained with the wildtype proteins was observed for chimeras F2 (23–41), F13 (242–254), F17 (323–338), F18 (343–357), F19 (361–381), and F25 (488–501). Fragment 25 was also excluded after recording normal fructose uptake by chimera G5-429-G7 (GLUT7 sequence from amino acid 429, corresponding to F22–F26). A very strong reduction in fructose uptake (<30% of wildtype GLUT5–GFP) was observed for chimeras F9 (164–181), F15 (286–305), F20 (382–399), and F21 (409–428).
Figure 1.

Fructose uptake into NIH-3T3 cells by GLUT5–GLUT7–GFP chimeras (large fragments). GFP control, GLUT5–GFP, and GLUT5–GLUT7–GFP chimera cells were incubated with 1 mm fructose for 1 min. Columns represent mean values of 6 wells as a percentage of GLUT5–GFP after subtraction of GFP control values. Error bars indicate the standard deviation. Mann-Whitney U test was used to test for statistical significance compared with GLUT5–GFP (**, p < 0.01).
The chimeras that showed intermediately reduced and drastically reduced fructose transport were further investigated. Fragments that contained many amino acid changes were divided into smaller fragments (9a (164–165), 9b (166–168), 9c (170–174), 9d (175–181), 13a (242–245) 13b (247–249) 13c (250–254), 17a (323–330), 17b (331–333), 17c (334–338), 18a (343–349), 18b (350–357), 19a (361–364), 19b (365–368), 19c (370–373), 19d (375–381), 20a (382–384), 20b (385–389), 20c (394–397), 20d (398–399), 21a (409–410), 21b (415–417), 21c (422–425), and 21d (426–428)) and, after subsequent analysis, further split to come to the level of individual amino acids (9ba (p.P166T), 9bb (p.Q167E), 9bc (p.L168V), 9ca (p.I170V), 9cb (p.T171I), 9cc (p.I174V), 17aa (p.A323V), 17ab (p.V326I), 17ac (p.F330I), 17ba (p.C331T), 17bb (p.A332S), 17bc (p.V333A), 19aa (p.A361V), 19ab (p.A362V), 19ac (p.A364L), 19ba (p.L365F), 19bb (p.D367N), 19bc (p.T369R), 20aa (p.S382A), 20ab (p.V384I), 20ba (p.I385A), 20bb (p.A388S), 20bc (p.L389I), 20da (p.L398V), 20db (p.I399R), 21aa (p.P409R), 21ab (p.S410A), 21ba (p.G415D), 21bb (p.S417A), 21da (p.V426I), and 21db (p.L428F)). The other fragments were broken down to the amino acid level directly (2a (p.I23S), 2b (p.S29A), 2c (p.V36L), 2d (p.A37S), 2e (p.A38V), 2f (p.S41T), 15a (p.G286A), 15b (p.V293I), 15c (p.Y297N), 15d (p.Q302T), and 15e (p.L305T)). Chimeras F9b, F9c, F17b, F20d, F21a, F21b, and F21d exhibited drastically reduced fructose uptake, whereas chimeras F17a, F19a, F19b, F20a, and F20b demonstrated an intermediately decreased uptake of fructose. Because normal fructose uptake was shown by chimeras F13a, F13b, F13c, F18a, and F18b, these fragments were not further divided (Fig. 2).
Figure 2.

Fructose uptake into NIH-3T3 cells by GLUT5–GLUT7–GFP chimeras (smaller fragments and single amino acid changes). GFP control, GLUT5–GFP, and GLUT5–GLUT7–GFP chimera cells were incubated with 1 mm fructose for 1 min. Columns represent mean values of 6 wells as a percentage of GLUT5–GFP after subtraction of GFP control values. Error bars indicate the standard deviation. Mann-Whitney U test was used to test for statistical significance compared with GLUT5–GFP (**, p < 0.01).
A variety of single amino acid mutants in the GLUT5 backbone as p.S41T (F2f), p.L168V (F9bc), p.I170V (F9ca), p.I174V (F9cc), p.V293I (F15b), p.A323V (F17aa), p.C331T (F17ba), p.A362V (F19ab), p.A364L (F19ac), p.T368R (F19bc), p.A388S (F20bb), and p.L398V (F20da) displayed fructose uptake rates reduced between 30% and 80%, whereas the mutants p.V36L (F2c), p.Q167E (F9bb), p.T171I (F9cb), p.Y297N (F15c), p.V326I (F17ab), p.A332S (F17bb), p.V333A (F17bc), p.V384I (F20ab), p.I399R (F20db), p.P409R (F21aa), p.G415D (F21ba), and p.L428F (F21db) showed fructose uptake below 30% of wildtype GLUT5–GFP (Fig. 2). These amino acids are localized in the first extracellular loop; the fifth, seventh, eighth, ninth, and tenth TMD; and the regions between the ninth and tenth TMD and the tenth and 11th TMD (Fig. 3).
Figure 3.

Illustration of exchanged fragments and amino acids in GLUT5–GLUT7 chimeras. Amino acid changes that resulted in decreased fructose transport are shown in blue (30–80%) or red (<30%), whereas green dots represent amino acid exchanges that did not influence fructose transport. White circles indicate amino acids that are identical in GLUT5 and GLUT7. Fragments 13 and 18 are illustrated in yellow because exchange of the whole fragment reduced fructose transport but exchange of smaller fragments did not. Squares indicate additional amino acids of GLUT7 because GLUT7 compromises 512 amino acids compared with 501 amino acids of GLUT5. In total, GLUT7 has six additional amino acids at the N terminus and five additional amino acids at the C terminus. All domains besides the first and seventh intracellular domain are assumed to be similar in length.
Nomura et al. (6) reported that the rat Glut5 variant p.Q166E, corresponding to p.Q167E in human GLUT5, alters the substrate transport specificity from fructose to glucose based on the finding that glucose binding by this mutant was enhanced. However, we could not find any evidence in the corresponding human GLUT5 mutant for transport of glucose. We also tested the uptake of fructose and glucose in four further variants located in the neighborhood of p.Q167E (p.L168V, p.I170V, p.T171I, and p.I174V). Although all mutants showed similar protein levels in the membrane, we could not detect any glucose transport activity (Fig. S3).
To test whether the exchanges found in GLUT5–GLUT7 chimeras can affect the transport properties of GLUT7, we also constructed a series of GLUT7–GLUT5 chimeras. Here the numbering refers to the GLUT7 sequence (+6 amino acids). Four different constructs with the N-terminal part of GLUT7 and the C-terminal part of GLUT5 (from amino acid 220 GLUT5) were analyzed. Chimera G7-220-G5 served as a control and did not contain any amino acid change in the N-terminal part. G7-220-G5-A contained all exchanges found to be important for fructose transport in the N-terminal part of GLUT5 (p.L42V, p.T47S, p.E173Q, p.V174L, p.V176I, p.I177T and p.V180I). Only amino acid changes that showed drastically reduced fructose uptake in GLUT5–GLUT7 chimeras were exchanged in chimera G7-220-G5-B (p.L42V, p.E173Q, and p.I177T). In chimera G7-220-G5-C, the amino acids that resulted in intermediately reduced fructose uptake in GLUT5 were altered (p.T47S, p.V174L, p.V176I, and p.V180I). From these chimeras, only G7-220-G5-C has the ability to transport fructose. The protein expression of chimeras G7-220-G5-A, G7-220-G5-B, and G7-220-G5-C was comparable, whereas the corresponding control, G7-220-G5, revealed a low expression level (Fig. 4). We also generated 14 other GLUT7 chimeras containing variants found in the C-terminal part of GLUT5. Unfortunately, these chimeras did not appropriately translocate to the plasma membrane, hampering further functional investigations (data not shown).
Figure 4.

Fructose uptake into NIH-3T3 cells expressing GLUT7–GLUT5–GFP chimeras. Stable cell lines were created using retroviral transduction. A, GFP–control, GLUT5–GFP, G7-220-G5, G7-220-G5-A, G7-220-G5-B, and G7-220-G5-C fibroblasts were incubated for 1 min with 1 mm fructose. Values of GFP–control cells were subtracted and the percentage of wildtype GLUT5–GFP was calculated. Columns represent mean values of 11–12 wells from two independent experiments. Error bars indicate the standard deviation. Mann-Whitney U test was used to test for significant differences compared with GLUT5–GFP (***, p < 0.001). B, Western blot of NIH-3T3 protein extracts (5 μg per lane) stained with GFP (red) and actin (green) antibodies. C, GFP fluorescence was visualized using a Leica microscope (×10 magnification).
The dynamics of three systems, the WT and two selected variants (p.Q167E and p.I174V), were studied through 200-ns-long molecular dynamics (MD) simulations. The analysis of the root mean square deviation (RMSD) of the α carbons of the transporter from the starting structure (Fig. S4) shows a strikingly different behavior for p.Q167E (Fig. S5, left panel): the WT and the p.I174V variant do not deviate from the starting configuration for more than 2.5–3 Å, whereas p.Q167E shows RMSD values of up to 4.5 Å. Visual inspection of the trajectories revealed that the intracellular loop between the sixth and seventh TMD is particularly flexible in the p.Q167E variant. This was verified by calculating the α carbon RMSD of the proteins excluding this loop. In that case, similar RMSD values can be observed for all three systems (Fig. S5, right panel).
To quantify the flexibility of each amino acid during the simulations, we calculated their root mean square fluctuation during the simulations (Fig. S6). We observed that the p.Q167E system (Fig. S6, red line) is much more flexible than the WT, especially concerning the loops between the third and fourth TMD and sixth and seventh TMD, whereas the WT and the p.I174V variant show similar flexibility. As anticipated by the RMSD and root mean square fluctuation calculations, in p.Q167E, the intracellular (IC) loop between the TMD moves dramatically during the simulation. This movement leads to a complete change of the loop position and resembles that of a lid covering the exit of the substrate into the cytosol (Fig. 5). This loss of fructose transport into the cytosol mediated by the p.Q167E variant was also functionally demonstrated in Xenopus laevis oocytes (data not shown). Furthermore, efflux of fructose from the cytosol into the surrounding medium was absent (Fig. S7).
Figure 5.
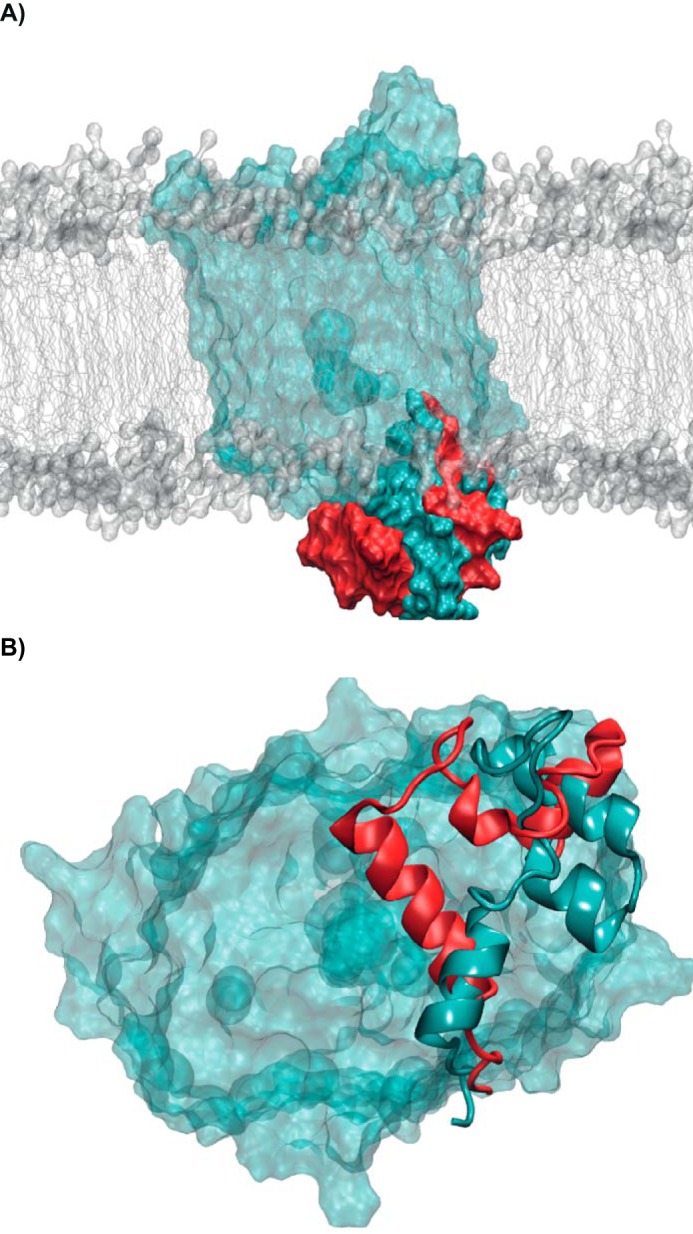
Movement of the IC loop of TMD 6 and 7 in the WT (cyan) and p.Q167E (red) systems. A, side view with the protein in surface representation (the IC loops of the two systems are shown in opaque colors and the rest of the protein in transparent cyan) and the membrane in surface and stick representation (gray). B, bottom view with the protein in surface representation and the IC loop as a schematic. Conformations represent the most populated cluster of the last 150 ns of the two molecular dynamics simulations.
Finally, we investigated all 12 variants that displayed reduced fructose uptake between 30% and 80% (depicted in blue in Figs. 3 and 6): These variants are located in TMD 5 and 7–11, in the extracellular loops between TMD 1 and 2, between TMD 9 and 10, and in the IC loop between TMD 10 and 11 (note that p.I174V was resimulated within this new frame). It is interesting to note that the three-dimensional distribution of these residues is asymmetric with respect to the central cavity; they are all located on the same side of the transporter (Fig. 6, A and B). This observation raised our curiosity about the residues that drastically reduce fructose transport. Although these amino acids are located closer to the central cavity, embracing TMD 5, 7, 8, and 11 and loops between TMD 1 and 2 and 10 and 11, they are still asymmetrically distributed, involving only one side of the protein (Fig. 6B, depicted in red). The analysis of the trajectories of the 12 “mild phenotype” variants revealed that none of the mutants exert an equally strong effect on the IC loop of TMD 6 and 7 as p.Q167E. However, it is possible to detect conformational changes in several helices (e.g. shifts, bends (i.e. IC part of TMD 1 or 5, helix involved in the binding of fructose), and changes in the orientation), most probably driven by the mutated residue, which is able in this way to affect the physiological dynamics of the protein. Interestingly, even far-positioned mutations are able to affect the channel geometry in an allosteric fashion, as depicted in Fig. 6C for helix 5. A more thorough and numerical analysis was performed for the last 50 ns of all 12 simulations by calculating the RMSD of the backbone of different regions (helices and loops) of the proteins (Table S1). Compared with the WT, all variants indeed show higher RMSD values in specific regions of the protein. These regions are not necessarily in structural or sequential proximity of the mutation, indicating partially strong allosteric effects. Comprehensively, the largest movements could be observed in the TMD connecting loop regions, especially those between TMD 4 and 5, 6 and 7, and 10 and 11, which showed remarkably higher RMSD values for the variants than for the WT independent of the location of the mutated residue. In addition, several variants along the different TMDs are characterized by higher RMSD values (thus, conformational changes). Fig. S8A shows the involved loops, and in Fig. S8B, the conformational changes in the three loops between TMD 4 and 5, 6 and 7, and 10 and 11 are illustrated by the superimposed representative structures of all 12 variants.
Figure 6.

Localization of the analyzed variants in the GLUT5 protein. A, side view of the protein (cyan ribbons) and the 12 mutated amino acids that intermediately reduced fructose uptake as blue spheres, p.Gln-167 as red spheres, and p.Ile-174 as magenta spheres; the membrane is shown as gray spheres and sticks. B, top view showing all identified residues. Residues intermediately reducing fructose uptake between 30–80% are shown in blue and residues with an uptake reduction below <30% in red, respectively. The blue and red dashed lines highlight their asymmetric distribution around the pore. C, side view of the WT transporter (transparent gray and cyan ribbons) and TMD 5 (red) and part of TMD 4 (orange) of the p.T368R variant (after superimposing both proteins). The mutated residue is shown as yellow spheres.
Discussion
By exchanging fragments and individual amino acid residues between GLUT5 and GLUT7, we identified several amino acid positions in the sequence that are essential for function or that contribute to fructose transport. These amino acids are found in GLUT5 in the first extracellular loop, the fifth, seventh, eighth, ninth, and tenth TMD, and the regions between the ninth and tenth TMD and tenth and 11th TMD. An illustration of the topology of these amino acids is given in Fig. 3. The amino acid exchanges that reduced fructose transport below 30% of the wildtype are labeled in red, whereas those that reduced fructose uptake from 30% to 80% are marked in blue. For fragments 13 and 18, shown in yellow, their influence on fructose transport is unclear; fructose uptake was reduced in both chimeras but normal in the subsequently generated subfragments. We cannot exclude that the reduced uptake of fructose is caused by unspecific inactivation of the transporter because of incorrect protein folding. To test this, we generated GLUT7–GLUT5 chimeras comprising the GLUT7 sequence at the N terminus and the GLUT5 sequence from amino acid 220. This chimera did not transport fructose. After the introduction of four amino acids derived from the GLUT5 sequence in the N-terminal part (p.T47S, p.V174L, p.V176I, and p.V180I), however, this chimera transported fructose. Unfortunately, other GLUT7 chimeras containing variants found in the C-terminal part of GLUT5 did not appropriately translocate to the plasma membrane.
Previous studies with GLUT5–GLUT3 chimeras identified two regions as important for fructose transport: the region from the N terminus to the first intracellular loop and the region from the third extracellular loop to the 11th TMD (8). Another approach using chimeras between rabbit Glut1 and rat Glut5 revealed evidence that a region from the N terminus to the sixth TMD and the intracellular C terminus (10) is important for transport. Our data do not match these observations. We also found important amino acid residues between the seventh and 11th TMD, whereas the C terminus region appeared to be not relevant for function. These contradictory findings may originate from the different sizes of exchanged fragments or the different species and, thus, sequences that served as backbone. However, studies using GLUT2–GLUT3 chimeras emphasize the importance of the region between the seventh and eighth TMD for fructose transport (7), and we identified seven amino acid residues in this region that are essential for GLUT5 fructose transport.
In 2015, the crystal structures of rat (open outward-facing) and bovine (open inward-facing, on which our models are built) Glut5 were described (6). Amino acids p.Ile-169 (p.I170 in human GLUT5), p.Ile-173 (174), p.Gln-166 (167), p.Gln-287 (288), p.Gln-288 (289), p.Asn-324 (325), and p.Trp-419 (420) are located in the central cavity and are conserved between rat Glut5 and human GLUT1. The residues p.Tyr-31 (32), p.His-386 (387), p.Ala-395 (396), p.His-418 (419), and p.Ser-391 (392) also face the central cavity but are different in GLUT1. These amino acids are located in the first, fifth, eighth, tenth, and 11th TMD and in the loops between the sixth and seventh and between the tenth and 11th TMD. The mutants p.Y31F/p.H386F, p.Y31F/p.H418Q, p.H418Q, p.S391A, p.H386F, p.H386A, p.Q287A, p.Q166E, and p.Y31F showed markedly reduced binding of fructose (<40% of the wildtype), measured with tryptophan fluorescence quenching, whereas mutants p.Q288A, p.I173A, p.Q166A, p.I169A, and p.Y31A demonstrated a mild reduction of fructose binding (40–90% of the wildtype) (6).
Moreover, glucose transport activity by mutant p.Q166E was proposed because glucose binding by this mutant was enhanced (6). The three amino acids p.Ile-169, p.Ile-173, and p.Gln-166, located in the fifth TMD, were also identified to be important for fructose transport by our analysis (corresponding to p.Ile-170, p.Ile-174, and p.Gln-167 in human GLUT5). However, we demonstrate no glucose uptake by variant p.Q167E. This might be explained by the differences in the measurements. Nomura et al. (6) measured only the binding of glucose to the transporter using tryptophan fluorescence quenching, whereas we measured the actual transport of glucose. We observed, in our molecular dynamics simulations, that the p.Q167E mutation leads to a radical change in the position of the IC loop between the sixth and seventh TMD, moving the loop toward the central (median) part of the transporter, from where the ligand is most likely exiting the protein to reach the cytoplasm (Fig. 5). We hypothesize that, in this case, the mutation triggers the IC loop to act as a “gate” or “lid” that blocks fructose release and thereby its transport. Thus, it might be possible that the p.Q167E variant results in better glucose binding but absent glucose transport by precluding the exit of the ligand.
We did not analyze the other amino acid variants with reduced fructose binding reported by Nomura et al. (6) because GLUT5 and GLUT7 are identical at these positions. The amino acids we identified as important for fructose transport in the fifth, seventh, eighth, tenth, and 11th TMD and in the first extracellular and last intracellular loop are potentially also involved in fructose binding because these regions are dedicated to form the pore or are in close proximity to it. The two amino acids p.Gln-167 (p.Ala-206 in GLUT9) and p.Val-293 (p.Leu-332 in GLUT9) we identified as important in our analyses were already described to line the pore in a homology-based model of the human urate transporter GLUT9 (11).
To gain a detailed understanding of the effect of these mutations on protein dynamics, we performed computational studies on several systems. For this, we built the human GLUT5 model by homology modeling using the inward-facing open conformation of the bovine crystal structure (PDB code 4YB9) as a template and then conducted molecular dynamics simulations of the wildtype protein and of several variants. Analysis of the obtained MD trajectories revealed that all 12 mutations that resulted in a reduction of fructose transport between 30% and 80% (marked in blue in Fig. 6) led to conformational changes in different regions of the protein (especially in loops 4–5, 6–7, and 10–11) with respect to the WT. We were able to observe different bends or shifts of specific loops or helices (for example TMD 5, involved in fructose binding). Remarkably, these effects were also observed in protein regions far from the mutated residue, as in the case of the p.T368R mutant, demonstrating an allosteric propagation of structural changes through the protein. A deeper and preferably quantitative analysis of the thermodynamic properties of these systems would be beneficial in the future to uncover the exact mechanism underlying these mutations.
In summary, we identified residues in GLUT5 that are critical for its function as a fructose transporter and demonstrate a role of selected residues within the protein structure for the dynamics via molecular simulations. Of special interest is the change in the orientation of the large intracellular loop caused by exchange of p.Q167E.
Experimental procedures
Molecular cloning
For all cloning procedures, we used the vector pMXs with human GLUT5–GFP or GLUT7–GFP (GLUT7, NM_207420.2; GLUT5, NM_003039.2) inserted as described elsewhere (9). In the first round, we divided GLUT5 into 26 fragments covering the complete protein sequence and constructed GLUT5–GLUT7–GFP chimeras by overlap extension PCR. Each GLUT5 chimera contained one fragment with the corresponding amino acids of GLUT7 based on sequence alignment. Selected fragments that showed altered fructose transport were further subdivided into smaller fragments or broken down to the amino acid level. Primer sequences are shown in Table S2. As flanking primers, we used for all chimeras 5′-TTAGTTCTCGAGCTTTTGGAGTACGTCGTCTTTAGG-3′ and 5′-AGCTAGTTAATTAAGGATCTTCCCCAGCATGCCTGC-3′, which contain the vector sequence with cleavage sites for XhoI (F) and PacI (R). Overlap extension PCR was also applied for construction of GLUT7–GLUT5–GFP chimeras. One primer pair was not sufficient because GLUT7 had to be changed at multiple sites. Therefore, the product from one overlap extension PCR was used as a new template for the next PCR. The same flanking primer as for the GLUT5–GLUT7–GFP chimeras was used. Mutagenesis primers are listed in Table S3. All primers were purchased from TIB MOLBIOL (Berlin, Germany). After cloning, all vectors were monitored by DNA sequencing. For X. laevis oocyte experiments, the p.Q167E variant and the G5GFP wildtype were subcloned in the pGEM-HE vector for cRNA synthesis with the mMESSAGE mMACHINE® T7 transcription kit (Ambion, Life Technologies).
Cell culture
NIH-3T3 mouse fibroblasts were cultured in Dulbecco's modified Eagle's medium (4.5 g/liter glucose) with 10% fetal bovine serum and 1% penicillin/streptomycin (10,000 units/ml penicillin and 10 mg/ml streptomycin). Additionally, 1 μg/ml puromycin and 10 μg/ml blasticidin were added for culturing of Platinum E cells.
Retroviral transduction
Platinum E cells were transfected with 5 μg of pMXs vector with the sequence of interest. One day before transfection, Platinum E cells were split at a ratio of 1:3. Six-well plates were coated with 5 μg/cm2 collagen the same day. Three to five hours after seeding of 106 cells/well in medium without puromycin and blasticidin, we transfected cells using the ProFection® mammalian transfection system (Promega). The virus-containing supernatant was collected and filtered through a 0.45-μm cellulose acetate syringe filter (Sartorius) ∼16 h after transfection. Fresh medium was added to the cells. For infection of NIH-3T3 cells, we applied the filtered supernatant from day 2 after transfection. Cells were seeded into 6-well plates at a density of 60,000 cells/well and infected with the virus-containing supernatant in presence of 2 μg/ml Polybrene® the next day (20–30% confluence). Successfully infected cells were selected with 10 μg/ml blasticidin 1 day after infection and cultured for further experiments.
Radiotracer flux assay with NIH-3T3 cells
NIH-3T3 cells were seeded in 24-well plates and grown to confluence. The uptake solution contained [14C]d-glucose (2 μCi/ml) or [14C]d-fructose (5 μCi/ml) (American Radiolabeled Chemicals, ARC-0122D, ARC-0116A) and the corresponding non-radiolabeled sugars (final concentration, 1 mm) diluted in uptake buffer (140 mm NaCl, 20 mm HEPES, 1.7 mm KCl, 1.5 mm KH2PO4, 0.9 mm CaCl2, and 0.8 mm MgSO4 (pH 7.4)). Cells were washed three times with 400 μl of uptake buffer and incubated with 200 μl of uptake solution for 1 min. After three washing steps with 400 μl of ice-cold uptake buffer, cells were lysed in 200 μl of 0.1 n NaOH. The cell lysate was transferred to a scintillation vial, shaken for at least 30 min, and mixed with 3 ml Rotiszint® (Carl Roth). To normalize the influx against the protein concentration, the influx per microgram of protein was calculated by using one additional well per cell line for protein measurement by Bradford assay. For this purpose, cells were washed once with 400 μl of PBS and lysed completely in 200 μl of 0.1 n NaOH using a sonicator.
Protein extraction from NIH-3T3 cells
Cells were seeded in 6-well plates (3 wells per cell line) and were grown to confluence. Cells were scraped off in 1 ml of ice-cold PBS after washing and centrifuged for 2 min at 600 × g at 4 °C. The cells were lysed in 90 μl of radioimmune precipitation assay lysis buffer (150 mm NaCl, 10 mm Tris-HCl, 5 mm EDTA, 1% Triton-X-100, and 1% protease inhibitor mixture (pH 7.4)) by drawing up and down with a 24-gauge syringe. The supernatant was collected after centrifugation for 3 min at 400 × g at 4 °C. The pellet was extracted again using 45 μl of radioimmune precipitation assay lysis buffer. The supernatant was combined with that of the first extraction (total protein).
Chimera overexpression in X. laevis oocytes
Oocytes were removed surgically from anesthetized frogs, washed in ORII solution (96 mm NaCl, 2 mm KCl, 1 mm MgCl2, 5 mm HEPES, 3 mm Tris, 6 mm pyruvate, and 0.01% gentamicin (pH 7.4)) and placed in ORII solution containing 2 mg/ml collagenase for 90 min. Oocytes were washed seven times each in ORII solution and Barth solution (96 mm NaCl, 2 mm KCl, 1 mm MgCl2, 2 mm CaCl2, 5 mm HEPES, and 3 mm Tris (pH 7.4)). Mature oocytes (stage V and VI) were stored in Barth solution with 6 mm pyruvate and 0.01% gentamicin at 17 °C. The following day, oocytes were injected with 12.9 ng of cRNA using an auto-nanoliter injector (Nanoject IITM, Drummond Scientific). Subsequent experiments were performed 4 days after injection.
Radiotracer influx assay with X. laevis oocytes
To measure fructose transport into oocytes with the radiotracer influx assay, we used Barth solution without pyruvate and gentamicin. Groups of 10 oocytes were incubated with 200 μl of Barth solution containing [14C]d-fructose (5 μCi/ml, American Radiolabeled Chemicals, ARC-0116A) and non-radiolabeled fructose for 10 min in a final fructose concentration of 1 mm. Oocytes were washed four times with ice-cold Barth solution. Single oocytes were solved in 100 μl of 10% SDS at 50 °C while shaking. The solution was mixed with 3 ml Rotiszint® (Carl Roth). Radioactivity was determined with the Tri-Carb 2810 TR scintillation counter (PerkinElmer Life Sciences).
Radiotracer efflux assay with X. laevis oocytes
Fructose transport from the oocytes into the surrounding medium (Barth solution) was measured with a radiotracer efflux assay. For this, oocytes 4 days after injection with cRNA were injected with 18.4 nl of fructose solution (final fructose concentration, 250 mm; 25 μCi/ml in Barth solution). Groups of 10 oocytes were incubated for 0, 15, 30, 45, or 60 min and washed twice with ice-cold Barth solution. Single oocytes were treated as described above.
Protein extraction and paraffin embedding of X. laevis oocytes
After homogenization of 30 oocytes with 200 μl of lysis buffer (20 mm HEPES, 10 mm KCl, 1.5 mm MgCl2, 1 mm DTT, and 25 mm phenylmethylsulfonyl fluoride) using a homogenizer (Polytron® 1600 E, Kinematica), samples were centrifuged at 4 °C and 20,000 × g for 1 min. The supernatant was purified in two other centrifugation steps for 2 min. For fluorescence pictures, five oocytes were fixed in 4% paraformaldehyde, dehydrated with 70%, 80%, 96%, and 100% ethanol and 100% xylol, and embedded in paraffin. Paraffin blocks were cut into 6-μm slices using a HM 355S microtome (Thermo Fisher Scientific). Slices were placed on microscope slides and incubated in 100% xylol and 100%, 96%, and 80% ethanol for removal of paraffin and rehydration. Afterward, the slices were covered with Roti®-Mount FluorCare (Carl Roth).
Western blotting
Extracts (5 μg for NIH-3T3 cells, 10 μg for oocytes) were separated on a 10% polyacrylamide gel and transferred to nitrocellulose membranes. Membranes were blocked for 1 h in PBS with 5% BSA and incubated with GFP-specific (Rockland Immunochemicals, 600-401-215, 1:25,000 dilution) and actin-specific (Santa Cruz Biotechnology, sc-1615, 1:800) antibodies overnight at 4 °C. Fluorescent dye-labeled secondary antibodies (anti-rabbit IRDye® 680RD and anti-goat IRDye® 800RD, LI-COR Biosciences, diluted 1:10,000 in phosphate-buffered saline with Tween 20) were used for detection with the Odyssey® infrared imager (LI-COR Biosciences).
Fluorescence microscopy
GFP fluorescence was visualized with 480-nm excitation and 505-nm emission wavelength at 22 °C using the Leica Microsystems DMI 4000 B microscope, DFC490 camera, and LAS V3.8.0 software (Leica Camera AG).
Statistical analysis
The Software SPSS Statistics 23 (IBM) was used for statistical analysis. Only p < 0.01 is shown.
Molecular simulations
The model of human GLUT5 was built with the MODELLER program (12, 13) using as template the inward-facing open conformation of the bovine crystal structure (PDB code 4YB9 (6), 89.6% of sequence similarity). We performed the sequence alignment with the HH-Pred program (14) and the evaluation of the 200 models with the QMEAN server (15). The chosen model was then embedded in a pure, pre-equilibrated 1-palmitoyl-2-oleylphosphatidylcholine lipid model membrane (kindly provided by T. A. Martinek (16)) using the gmembed tool of GROMACS (17), and the protein was oriented following the OPM database model (18). Subsequently, the system was neutralized and solvated with TIP3P water molecules (92,772 total atoms; box size, 94.1 × 92.7 × 105.5 Å3). Simulations were carried out with the GROMACS4 (19) package using the Amber03 (20) force field for the protein and the GAFF force field (21) together with the parameters supplied by T. A. Martinek (16) for the membrane.
The system was neutralized and minimized before the equilibration was performed, which consisted of three stages: heating up of the system for more than 1 ns with the protein backbone completely fixed and the side chains left free to move; 5 ns of simulation (with backbone restraints) in an NPγT ensemble with a surface tension equal to 600.0 bar/nm (16); and 40 ns of simulation, keeping the backbone restrained and the membrane area constant. Finally, three 200-ns-long MD simulations were performed on three different systems: WT, p.I174V (magenta residue shown in Fig. 6A), and p.Q167E (red residue shown in Fig. 6A). For the two variants, the final conformation from the third step was mutated, minimized, and equilibrated for a further 20 ns of restrained MD before simulating it freely.
Additionally, 100 ns of MD simulations were performed for each of the following variants: p.S41T, p.L168V, p.I170V, p.I174V, p.V293I, p.A323V, p.C331T, p.A362V, p.A364L, p.T368R, p.A388S, and p.L398V (note that p.I174V was indeed resimulated within this new frame). All variants are based on the conformation representing the biggest cluster of the last 50 ns of the WT MD, mutating one by one all blue residues as depicted in Fig. 6.
All simulations were performed using periodic boundary conditions at 310 K and the Nosé–Hoover thermostat (22) and Parrinello–Rahman barostat (23) with a semi-isotropic pressure coupling type and a time step of 2 fs. Position restraints of atoms were fixed with a force constant (K) equal to 1000 kJ mol−1 nm−2. This protocol has already been shown to be successful (24, 25).
Author contributions
K. E., H. D., I. A., and H. W. conceptualization; K. E., M. E., I. B., and S. S. formal analysis; K. E., H. D., I. A., and H. W. supervision; K. E., H. D., and H. W. funding acquisition; K. E., M. E., I. B., S. S., T. R., and H. D. investigation; K. E., M. E., I. B., H. D., and I. A. methodology; K. E., M. E., I. B., S. S., H. D., and H. W. writing-original draft; K. E. and H. W. project administration; I. A. writing-review and editing.
Supplementary Material
Acknowledgments
We thank Chris Cheeseman for the pGEM-HE GLUT7 plasmid. We also thank Daniela Kolmeder for preparation of GLUT5 cDNA cloned from Caco-2 cells, Martin Klingenspor for supplying the pMXs vector, and Helene Prunkl for assistance with oocyte isolation and cRNA injection.
This work was supported by Deutsche Forschungsgemeinschaft Grants GRK 1482 (to H. W.) and SFB1035/A10 (to I. A.). The authors declare that they have no conflicts of interest with the contents of this article.
This article contains supplemental Figs. S1–S8 and Tables S1–S3.
- GLUT
- glucose transporter
- MD
- molecular dynamics
- RMSD
- root mean square deviation
- IC
- intracellular
- cRNA
- complementary RNA.
References
- 1. Mueckler M., and Thorens B. (2013) The SLC2 (GLUT) family of membrane transporters. Mol. Aspects Med. 34, 121–138 10.1016/j.mam.2012.07.001 [DOI] [PMC free article] [PubMed] [Google Scholar]
- 2. Burant C. F., Takeda J., Brot-Laroche E., Bell G. I., and Davidson N. O. (1992) Fructose transporter in human spermatozoa and small intestine is GLUT5. J. Biol. Chem. 267, 14523–14526 [PubMed] [Google Scholar]
- 3. Patel C., Douard V., Yu S., Gao N., and Ferraris R. P. (2015) Transport, metabolism, and endosomal trafficking-dependent regulation of intestinal fructose absorption. FASEB J. 29, 4046–4058 10.1096/fj.15-272195 [DOI] [PMC free article] [PubMed] [Google Scholar]
- 4. Cheeseman C. I. (1993) GLUT2 is the transporter for fructose across the rat intestinal basolateral membrane. Gastroenterology 105, 1050–1056 10.1016/0016-5085(93)90948-C [DOI] [PubMed] [Google Scholar]
- 5. Wilder-Smith C. H., Li X., Ho S. S., Leong S. M., Wong R. K., Koay E. S., and Ferraris R. P. (2014) Fructose transporters GLUT5 and GLUT2 expression in adult patients with fructose intolerance. United European Gastroenterol. J. 2, 14–21 10.1177/2050640613505279 [DOI] [PMC free article] [PubMed] [Google Scholar]
- 6. Nomura N., Verdon G., Kang H. J., Shimamura T., Nomura Y., Sonoda Y., Hussien S. A., Qureshi A. A., Coincon M., Sato Y., Abe H., Nakada-Nakura Y., Hino T., Arakawa T., Kusano-Arai O., et al. (2015) Structure and mechanism of the mammalian fructose transporter GLUT5. Nature 526, 397–401 10.1038/nature14909 [DOI] [PMC free article] [PubMed] [Google Scholar]
- 7. Wu L., Fritz J. D., and Powers A. C. (1998) Different functional domains of GLUT2 glucose transporter are required for glucose affinity and substrate specificity. Endocrinology 139, 4205–4212 10.1210/endo.139.10.6245 [DOI] [PubMed] [Google Scholar]
- 8. Buchs A. E., Sasson S., Joost H. G., and Cerasi E. (1998) Characterization of GLUT5 domains responsible for fructose transport. Endocrinology 139, 827–831 10.1210/endo.139.3.5780 [DOI] [PubMed] [Google Scholar]
- 9. Ebert K., Ludwig M., Geillinger K. E., Schoberth G., Essenwanger J., Stolz J., Daniel H., and Witt H. (2017) Reassessment of GLUT7 and GLUT9 as putative fructose and glucose transporters. J. Membr. Biol. 250, 171–182 [DOI] [PubMed] [Google Scholar]
- 10. Inukai K., Katagiri H., Takata K., Asano T., Anai M., Ishihara H., Nakazaki M., Kikuchi M., Yazaki Y., and Oka Y. (1995) Characterization of rat GLUT5 and functional analysis of chimeric proteins of GLUT1 glucose transporter and GLUT5 fructose transporter. Endocrinology 136, 4850–4857 10.1210/endo.136.11.7588216 [DOI] [PubMed] [Google Scholar]
- 11. Clémençon B., Lüscher B. P., Fine M., Baumann M. U., Surbek D. V., Bonny O., and Hediger M. A. (2014) Expression, purification, and structural insights for the human uric acid transporter, GLUT9, using the Xenopus laevis oocytes system. PLoS ONE 9, e108852 10.1371/journal.pone.0108852 [DOI] [PMC free article] [PubMed] [Google Scholar]
- 12. Sali A, and Blundell T. L. (1993) Comparative protein modelling by satisfaction of spatial restraints. J. Mol. Biol. 234, 779–815 10.1006/jmbi.1993.1626 [DOI] [PubMed] [Google Scholar]
- 13. Martí-Renom M. A., Stuart A. C., Fiser A., Sánchez R., Melo F., and Sali A. (2000) Comparative protein structure modeling of genes and genomes. Annu. Rev. Biophys. Biomol. Struct. 29, 291–325 10.1146/annurev.biophys.29.1.291 [DOI] [PubMed] [Google Scholar]
- 14. Söding J., Biegert A., and Lupas A. N. (2005) The HHpred interactive server for protein homology detection and structure prediction. Nucleic Acids Res. 33, W244–W248 [DOI] [PMC free article] [PubMed] [Google Scholar]
- 15. Benkert P., Künzli M., and Schwede T. (2009) QMEAN server for protein model quality estimation. Nucleic Acids Res. 37, W510–W514 [DOI] [PMC free article] [PubMed] [Google Scholar]
- 16. Jójárt B., and Martinek T. A. (2007) Performance of the general amber force field in modeling aqueous POPC membrane bilayers. J. Comput. Chem. 28, 2051–2058 10.1002/jcc.20748 [DOI] [PubMed] [Google Scholar]
- 17. Wolf M. G., Hoefling M., Aponte-Santamaría C., Grubmüller H., and Groenhof G. (2010) gmembed: efficient insertion of a membrane protein into an equilibrated lipid bilayer with minimal perturbation. J. Comput. Chem. 31, 2169–2174 10.1002/jcc.21507 [DOI] [PubMed] [Google Scholar]
- 18. Lomize M. A., Lomize A. L., Pogozheva I. D., and Mosberg H. I. (2006) Opm: orientations of proteins in membranes database. Bioinformatics 22, 623–625 [DOI] [PubMed] [Google Scholar]
- 19. Hess B., Kutzner C., van der Spoel D., and Lindahl E. (2008) Gromacs 4: algorithms for highly efficient, load-balanced, and scalable molecular simulation. J. Chem. Theory Comput. 4, 435–447 10.1021/ct700301q [DOI] [PubMed] [Google Scholar]
- 20. Duan Y., Wu C., Chowdhury S., Lee M. C., Xiong G., Zhang W., Yang R., Cieplak P., Luo R., Lee T., Caldwell J., Wang J., and Kollman P. (2003) A point-charge force field for molecular mechanics simulations of proteins based on condensed-phase quantum mechanical calculations. J. Comput. Chem. 24, 1999–2012 10.1002/jcc.10349 [DOI] [PubMed] [Google Scholar]
- 21. Wang J., Wolf R., Caldwell J. W., Kollman P. A., and Case D. A. (2004) Development and testing of a general amber force field. J. Comput. Chem. 25, 1157–1174 10.1002/jcc.20035 [DOI] [PubMed] [Google Scholar]
- 22. Evans D. J., and Holian B. L. (1985) The Nose-Hoover thermostat. J. Chem. Phys. 83, 4069–4074 10.1063/1.449071 [DOI] [Google Scholar]
- 23. Nosé S., and Klein M. L. (1983) Constant pressure molecular dynamics for molecular systems. Mol. Physics 50, 1055–1076 10.1080/00268978300102851 [DOI] [Google Scholar]
- 24. Bisha I., Rodriguez A., Laio A., and Magistrato A. (2014) Metadynamics simulations reveal a Na+ independent exiting path of galactose for the inward-facing conformation of vSGLT. PLOS Comput. Biol. 10, e1004017 10.1371/journal.pcbi.1004017 [DOI] [PMC free article] [PubMed] [Google Scholar]
- 25. Napolitano L. M., Bisha I., De March M., Marchesi A., Arcangeletti M., Demitri N., Mazzolini M., Rodriguez A., Magistrato A., Onesti S., Laio A., and Torre V. (2015) A structural, functional, and computational analysis suggests pore flexibility as the base for the poor selectivity of CNG channels. Proc. Natl. Acad. Sci. U.S.A. 112, E3619–E3628 10.1073/pnas.1503334112 [DOI] [PMC free article] [PubMed] [Google Scholar]
Associated Data
This section collects any data citations, data availability statements, or supplementary materials included in this article.