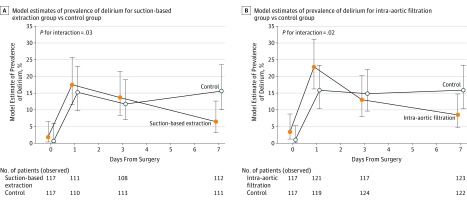
Figure 3. Prevalence of Delirium Over Time.
Delirium was measured by Confusion Assessment Method assessment at baseline and at days 1, 3, and 7. The probability of delirium over time was modeled using generalized estimating equations. The interaction term between days from surgery and randomization group was statistically significant (P < .05), indicating that the incidence of delirium over time was significantly different between the treatment groups and the control group.

