Abstract
Tumors are often comprised of microenvironments (TMEs) with a high proportion of cells and molecules that regulate immunity. Peritoneal cavity (PerC) cell culture reproduces key features of TMEs as lymphocyte proliferation is suppressed by PerC macrophages (Mϕs). We monitored the expression of T cell stimulatory (Class II MHC, B7) and inhibitory (PD-L1) molecules by PerC APCs before and after culture and report here that IFNγ-driven PD-L1 expression increased markedly on PerC Mϕs after TCR ligation, even more so than seen with direct APC activation by LPS. Considering the high APC composition of and pronounced PD-L1 expression by PerC cells, it was surprising that blocking PD-1/PD-L1 interaction by mAb neutralization or genetic ablation did not relieve suppression. This result parallels TME challenges observed in the clinic and validates the need for further study of this culture model to inform strategies to promote anti-tumor immunity.
Keywords: Macrophage, PD-L1, Suppression, T cell
1. Introduction
Homeostasis in the immune system is reflected in the strict control of the initial activation and duration of a response ensuring that inflammation is acute. Body-wide, innate housekeeping functions, e.g., apoptotic corpse clearance by phagocytes, operate in a non-inflammatory manner [1]. Inflammatory responses arise in organized lymphoid tissues that have evolved a particular architecture and cellular composition that permits activation and concomitant regulation [2]. Essential cellular and molecular braking systems, e.g., regulatory surface receptor (CTLA-4 or PD-L1) expression and antagonistic cytokine (IL-4, IL-10, IFNγ) production, arise concurrent with the commitment to activate and temper immunity to ensure organism homeostasis. This orderliness evolved to address external (“nonself”) transient infectious challenges, not to address cancer; an internal, enduring challenge that reflects lifespan extension with coincident mutation accrual (“altered self”). Cancer involves persistent, homeostatic immune-regulatory mechanisms that become counter-productive, cloaking the tumor from immune detection. By eliminating overtly dangerous cells in the early phases of disease, the immune system also contributes to tumor evolution by creating conditions that foster the emergence of immune-resistant variants [3]. Epithelial tissue-derived tumors often harbor microenvironments (TMEs) with an aberrant cellular composition (high Mϕ:T cell ratios) and constitutive expression of anti-inflammatory molecules (PD-1/PD-L1, IL-10) [4–6]. High Mϕ composition and PD-L1 expression have become prognostic criteria for staging cancer [7–9]. Such tumors may also have a “simmering” inflammatory signature with effector CD8 T cell infiltration and IFNγ production [9]. These tumor types have been treated successfully with novel immune-modulatory drugs; initially checkpoint inhibitors negating CTLA-4 ligation, then PD-1 or PD-L1 blockade, and most recently combinations of these drugs (10–13). However, we are at an early stage with these T cell-focused medicines as they impact a small fraction of a growing patient population [14]. Further understanding of the TME and identification of additional drug targets will be essential to build upon this early success.
We model the TME by studying Mϕ-rich peritoneal cavity (PerC) cells in vitro and have reported on how Mϕs suppress PerC B and T cell proliferation following B/TCR ligation [15–18]. IFNγ is essential for suppression of PerC T cells and is a key driver of inhibitory PD-L1 expression [17–19]. We investigated PD-L1 expression in the PerC/TME model system and found rapid and marked upregulation of this molecule on Mϕs. TCR ligation triggered the greatest increase in PD-L1, even more so than by direct APC activation via TLR-4 ligation. However, we were surprised to find that PD-1/PD-L1 blockade fails to reverse suppression. Thus, as observed in the clinic, high PD-L1 expression is not always the reason for failed immunity [14]. These results validate further study of this culture model to advance understanding of how to liberate immunity restrained by persistent immune regulating, homeostatic mechanisms.
2. Materials and Methods
2.1 Mice
Two-to-four month old male and female mice, bred and maintained at Rider University, were handled in accord with NIH, Animal Welfare Act, and Rider University IACUC guidelines. Breeding pairs of C57BL/6J, IFNγR−/− (B6.129S7Ifngr/J), and iNOS−/− (B6.129P2-Nos2tm1Lau/J) mice were obtained from the Jackson Laboratory, Bar Harbor, ME. PD-L1−/− mice initially came from the laboratory of Dr. Arlene Sharpe, Harvard Medical School, Cambridge, MA.
2.2 Preparation of cell suspensions, cell culture, and cytokine ELISA
Spleen (SP) cell suspensions were obtained by gentle disruption of the organ between the frosted ends of sterile glass slides. Red blood cells were removed from SP cell preparations by hypertonic lysis followed by washing with Hanks Balanced Salt Solution (HBSS) (Life Technologies, Grand Island, NY). Peritoneal cavity (PerC) cells were obtained by flushing the peritoneum with 10 mls of warm (37 °C) HBSS supplemented with 2–3% fetal bovine serum (FBS) (Hyclone, Logan, UT). Viable cell counts were determined by Trypan blue exclusion. Various dilutions (1.0 – 4.0 × 10⁶/ml) of cells, in RPMI 1640 culture media (Life Technologies) supplemented with 10% FBS containing < 0.3 EU (< 0.06 ng) /ml of endotoxin (Invitrogen), 0.1 mM nonessential amino acids, 100 U/ml penicillin, 100 μg/ml streptomycin, 50 μg/ml gentamicin, 2 mM L-glutamine, 2 × 10⁻⁵ M 2-ME, and 10 mM HEPES, were plated in 96-well “V”- or flat-bottom microtiter plates (Corning Costar, Fisher Scientific, Pittsburgh, PA) and then incubated in a humidified atmosphere of 5% CO2 at 37 °C for 48 hrs. Most experiments plated cells at 3 x 10⁶/ml in a V-bottom plate unless otherwise specified. Endotoxin testing (Pierce LAL Chromogenic Endotoxin Quantitation Kit) was done per manufacturer’s instructions. For anti-CD3 stimulation soluble anti-CD3 mAb (clone 145-2C11; < 0.001 ng/μg endotoxin) (eBioscience, San Diego, CA) was added at 1.0 μg/ml. LPS from E. coli, serotype R515 (Enzo Life Sciences, Farmingdale, NY or Sigma) was added at 5 μg/ml. To inhibit arginine catabolism, the inducible nitric oxide synthase (iNOS) inhibitor NG-monomethyl-L-arginine (1-MA; CalBiochem) was added. Neutralizing anti-mouse mAb for IFNγ (clone XMG1.2; < 0.001 ng/μg endotoxin), IL-10 (clone JES5-16E3; < 0.001 ng/μg endotoxin), GM-CSF (clone MP1-22E9; < 0.001 ng/μg endotoxin), IFNAR1 (clone MAR1-5A3; < 0.001 ng/μg endotoxin), PD-1 (clone J43; < 0.001 ng/μg endotoxin), and PD-L1 (clone MIH5; < 0.001 ng/μg endotoxin), were added at 7.5 μg/ml (all from eBioscience). All neutralizing mAbs were added at culture initiation. Optimal concentrations of all reagents were determined in titration experiments. After 44 hours, 1 μCi of [3H] thymidine (Moravek Inc., Brea, CA) was added to each well. The plates were frozen 4 hours after labeling, and then thawed for harvesting onto filter paper mats using a semi-automated cell harvester (Skatron Instruments, Richmond, VA). Radioactivity was measured by liquid scintillation spectrometry. For each experiment 5 wells were established for each test group. IFNγ production in tissue culture supernatants was measured by sandwich cytokine ELISA as specified by the manufacturer (Thermo Fisher). Each experiment was repeated 3–5 times.
2.3 Immunofluorescence staining and flow cytometric analyses
Ex vivo or cultured PerC and SP cell suspensions were first blocked with a “blocktail” of rat anti-mouse CD16/32 MAb (Fc Block, eBioscience) and 2% normal rat serum (Jackson ImmunoResearch, West Grove, PA). Cell suspensions were then stained using titered amounts of FITC-, Cy-Chrome-, or PE-labeled rat anti-mouse IgM, CD11b, CD45R/B220, CD5 and/or F4/80 mAbs (Thermo Fisher, Eugene, OR). Isotype- and fluorochrome-matched, nonspecific mAb controls were employed to establish analysis gates. For carboxyfluorescein succinimidyl ester (CFSE) cell proliferation assays cells were labeled with CellTrace CFSE Cell Proliferation Kit as described by the manufacturer (Thermo Fisher) prior to culture. The percentage of B lymphocytes or myeloid cells co-expressing sets of these markers were determined via multiparameter flow cytometric analyses on a FACSCalibur™ flow cytometer (Becton Dickinson Immunocytometry Systems, San Jose, CA) by FSC/SSC gating of the lymphoid or myeloid population using CellQuest software.
2.4 Statistical Analyses, Stimulation Index (SI), and Mean Fluorescent Intensity (MFI) index
Lymphocyte proliferative responses are presented as the average CPM (counts per minute) ± SEM (standard error of the mean). Data sets were compared using the Student’s t-test with p-values below 0.05 considered statistically significant: * = p < 0.05, ** = p < 0.005, *** = p < 0.0005 relative to control. The stimulation index (SI) is defined as the average CPM for the treatment (e.g., anti-CD3) divided by the average CPM for the appropriate control response (complete media {CM} alone). The Mean Fluorescence Intensity (MFI) index is defined as the average MFI for the treatment group (cultured, αCD3 stimulated, etc.) divided by the average MFI for the appropriate control (e.g., cultured / ex vivo, αCD3 stimulated / cultured, αCD3 + 1- MA treated / αCD3 stimulated, etc.).
3. Results
3.1 Peritoneal cavity T cells do not proliferate in response to TCR ligation
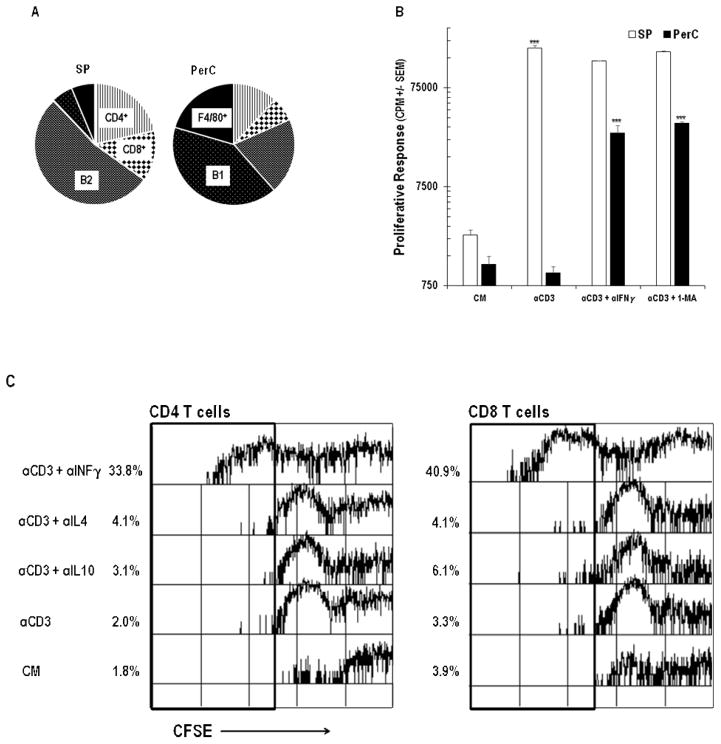
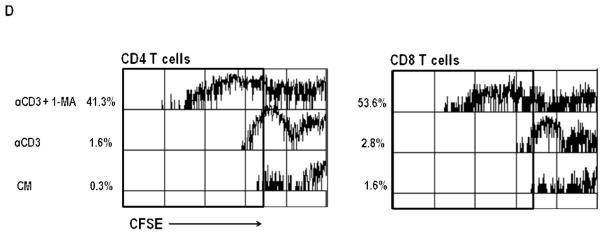
PerC cell culture provides a simple, in vitro model of the Mϕ-rich tumor microenvironment (TME) wherein lymphocyte expansion is tempered by mechanisms that vary depending upon cell culture density, form of lymphocyte activation, and mouse strain [16–18]. Unlike spleen (SP) cells, which have low macrophage composition and respond to antigen receptor (TCR/anti-CD3) ligation, C57BL/6J PerC cells failed to incorporate tritiated thymidine unless IFNγ was neutralized or iNOS was inhibited by 1-MA (Figure 1A, B). Assessing proliferation by CFSE dye dilution revealed robust recovery of CD4 and CD8 T proliferative responses with these treatments; neutralization of IL-4 or IL-10 had no effect (Figures 1C, D). Considering the vital role of CD8 T cells in anti-tumor immunity it was significant to note the marked expansion of this population. This observation occurred despite the low representation of this subset in the PerC, particularly in a cellular mixture with a greater proportion of Mϕs (Mϕ:T ratio for SP = 0.18, for PerC = 1.11; Figure 1A). These results fostered interest in further defining the immune regulatory features of APC-T cell interaction in the PerC cell culture model.
Figure 1.
Panel A Cellular composition of spleen (SP) and peritoneal cavity cells (PerC). Mϕs were defined as CD11bhiF4/80+ cells; PerC B1 cells = CD45R+CD11bmed cells; SP B1 = CD45R+CD5lo; B2 = CD45R+. Data are averages from 8–10 analyses of 8–16 wk old C57BL/6J mice. Panel B: PerC T cells fail to proliferate in response to TCR ligation unless IFNγ is neutralized or iNOS is inhibited by 1-MA. Asterisks above histograms indicate significant differences in the experimental and control conditions for each cell source. Panels C & D: PerC CD4 and CD8 T cells respond to TCR ligation if IFNγ is neutralized (Panel C) or iNOS is inhibited by 1-MA (Panel D).
3.2 IFNγ triggers increased PD-L1 expression on PerC Mϕs
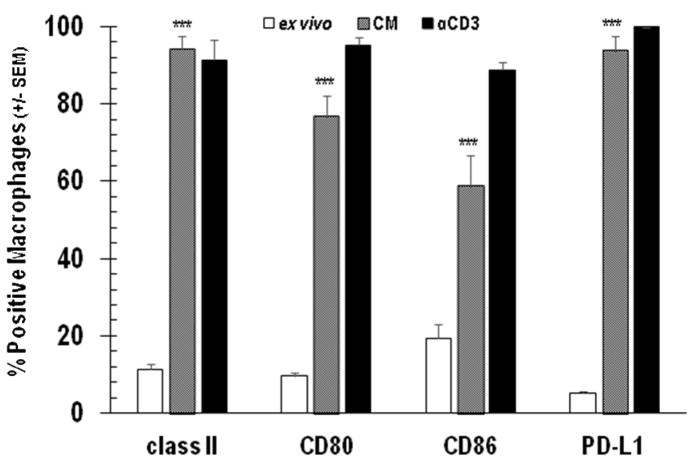
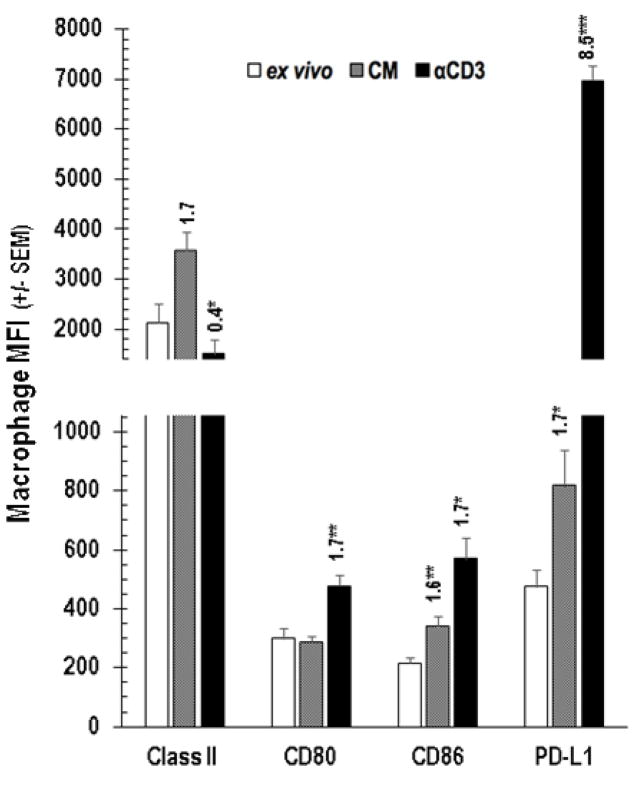
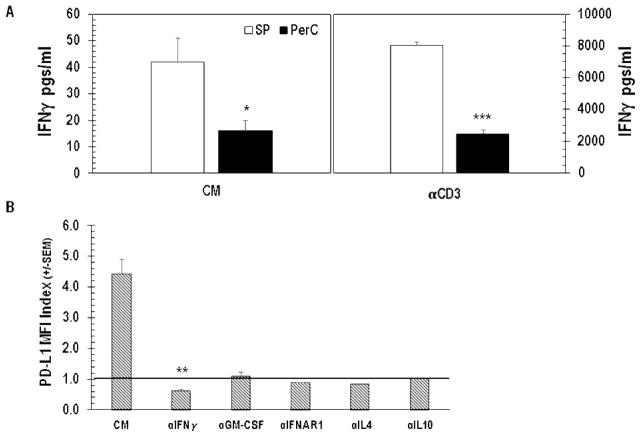
Cognate T cell-APC interaction via TCR-MHC and CD28-CD80/86 engagement is essential for cellular immunity [20]. However, atypical APC-T cell ratios found in tumors and PerC cell culture are known to alter T cell biology [16,17, 21]. For example, where CD28 ligation costimulates T cells and augments IFNγ production in standard lymphocyte (SP cells or purified T cells) cultures, in PerC cell culture CD28 ligation increased suppression [17]. IFNγ induces greater expression of both T cell stimulatory (Class II MHC, CD80/86) and inhibitory (PD-L1) ligands; therefore, we monitored these molecules on Mϕs before (ex vivo) and after culture, without (CM) or with T cell stimulation (αCD3) via flow cytometry [22]. Less than 20% of ex vivo, CD11b+ F4/80+ PerC Mϕs expressed detectable levels of Class II MHC, CD80/86, or PD-L1 (Figure 2). After 48 hrs of culture without stimulation (CM) significantly (p < .005) more Mϕs expressed each of these molecules, with Class II and PD-L1 being found on the majority of cells (> 93%); TCR ligation led to essentially all Mϕs expressing these molecules (Figure 2). With the exception of CD80 and Class II, the expression level of all ligands increased after 48 hrs in culture even without stimulation (Figure 3). Following TCR ligation, B7 family member expression increased even more with PD-L1 being the greatest (> 8-fold, p < .0005; Figure 3). However, Class II levels were lower. IFNγ, detectable in unstimulated cultures (Figure 4A, CM), was responsible for increased PD-L1 expression as neutralization of this cytokine and not others associated with PD-L1 regulation, reduced expression (Figure 4B). Although stimulated SP cells had the greatest IFNγ production, suppression was only observed in Mϕ-dense PerC cell cultures (Figures 4A, 1B).
Figure 2.
PerC Mϕ expression of cognate T cell ligands. PerC cells were analyzed ex vivo or after 48 hrs with (αCD3) or without stimulation (CM). Data depict the averages of 5–8 experiments +/− SEM.
Figure 3.
PerC Mϕ expression level of cognate T cell ligands. Cells were analyzed ex vivo or after 48 hrs with (αCD3) or without (CM) stimulation. The number above each histogram is the MFI index, which is the experimental MFI divided by the appropriate control MFI (CM MFI / ex vivo MFI, αCD3 MFI / CM MFI). Histograms depict averages +/− SEM of 5–8 experiments.
Figure 4.
IFNγ drives PD-L1 expression. Panel A: Unstimulated (CM) and stimulated (αCD3) SP or PerC cell cultures were screened for IFNγ production by ELISA. Results depict averages from 6 experiments. Panel B: PerC cells cultured without (CM) or with neutralizing mAbs to the cytokines listed were analyzed for PD-L1 expression after 48 hrs. Data from 3–5 experiments.
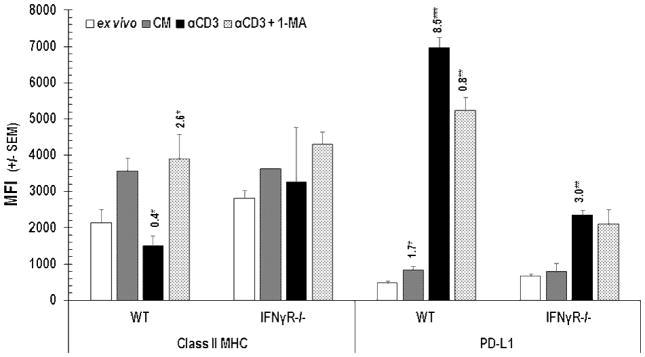
Concerned that antibody neutralization might fail to capture all IFNγ, we assessed PD-L1 expression on cells from mice lacking the receptor for this cytokine. Validation of a key role for IFNγ in driving PD-L1 expression was provided by the observation that IFNγR−/− PerC Mϕs had less PD-L1 than wild type cells (Figure 5). Class II MHC expression did not change significantly on IFNγR−/− PerC Mϕs. The increased expression of PD-L1 and reduced Class II MHC expression by Mϕs is consistent with clinical biomarker studies that suggest Mϕ-rich tumors are candidates for T cell checkpoint immunotherapy [5,8,9,23].
Figure 5.
Class II MHC and PD-L1 expression by PerC Mϕs. Cells were analyzed ex vivo or after 48 hrs in unstimulated (CM) or stimulated (αCD3) cultures +/− the iNOS inhibitor 1-MA. MFI indices above histograms as described in Figure 4. Data represent the average +/− SEM of 3 or more experiments.
3.3 PerC B cell PD-L1 expression increases with TCR and TLR-4 ligation
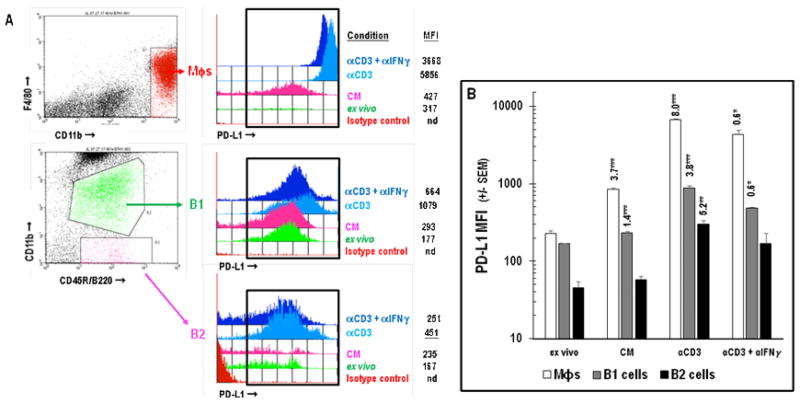
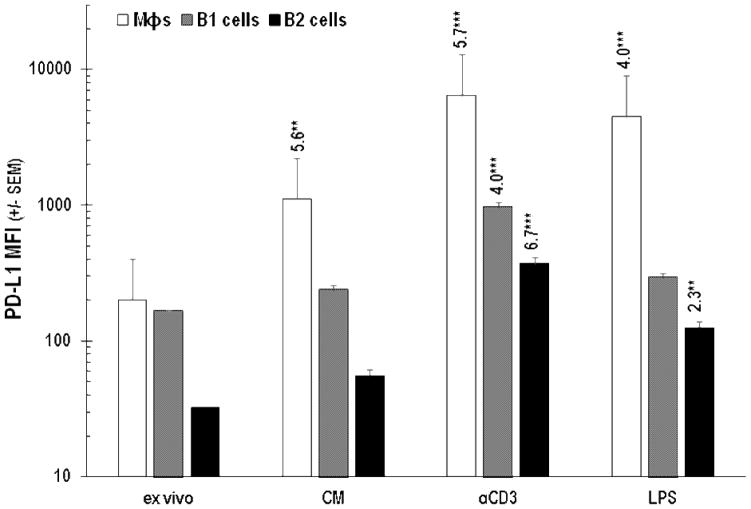
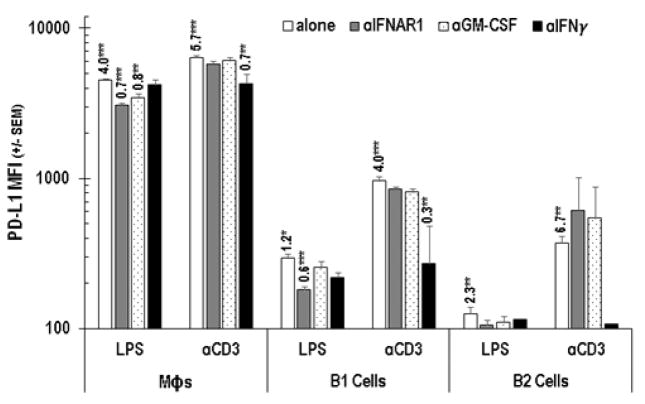
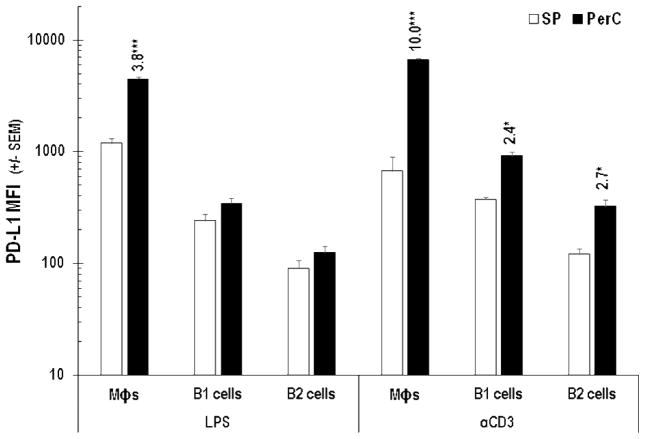
In addition to being enriched for Mϕs, PerC cell preparations include a significant percentage of immune regulatory, IL-10 producing, B220+CD11b+ B1 B cells (Figures 1A, 6; [24]). Although all B cells express Class II MHC, CD80, and CD86, B1 cells, consistent with their “activated” phenotype, express greater levels of these molecules than B220+CD11b− B2 B cells [25]. B1 cells express more PD-L1 than B2 cells and represent the largest fraction of PerC cells that constitutively express this molecule in vivo (Figures 1A, 6; [26]). Cultures of unstimulated PerC cells revealed a modest (< 2-fold) increase in PD-L1 expression by B1 and B2 cells that increased, due to IFNγ production, following TCR ligation (Figure 6B). This response was greater than that observed following direct activation of B cells or Mϕs via TLR-4 ligation; however, Type I interferons and GM-CSF drove the LPS response in these cells (Figures 7, 8). It is interesting to note that although SP cell culture produced more IFNγ (Figure 4A), PD-L1 expression by SP Mϕs, B1 and B2 cells never reached the levels seen for the comparable PerC cells (Figure 9). Based on these results, we hypothesized that the higher APC:T cell ratio of PerC cells relative to SP cells (4.6, vs 2.2; Figure 1A) and their greater PD-L1 expression could be key factors in the restraint of PerC T cell proliferation.
Figure 6.
A: Gating strategy used for analysis of PD-L1 expression by Mϕs, B1, or B2 cells. MFI = Mean Fluorescence Intensity. Panel B: PD-L1 expression by PerC Mϕs, B1, or B2 cells. Cells were analyzed ex vivo or after 48 hrs in unstimulated (CM) or stimulated (αCD3 +/− αIFNγ) cultures. Data in Panel B represent averages of 5–8 experiments. nd = not detected.
Figure 7.
PD-L1 expression by Mϕs, B1, and B2 cells following PerC cell stimulation by TLR-4 or TCR ligation. Cells were analyzed ex vivo and after 48 hrs in unstimulated (CM) or stimulated (αCD3 or LPS) culture. Data represent averages of 3–5 experiments.
Figure 8.
Cytokines responsible for increased PD-L1 expression. PerC cells were analyzed ex vivo and after 48 hrs in culture with (αCD3 or LPS) or without (CM) stimulation. Data representative of 3 experiments.
Figure 9.
PD-L1 expression by LPS- or αCD3-treated SP or PerC cells. Cells were analyzed after 48 hrs of culture. Numbers above histograms equal average PerC MFI/average SP MFI. Data representative of 3 experiments.
3.4 PD-L1 neutralization or knockout does not reverse PerC T cell suppression
To assess the role of PD-L1 in PerC T cell suppression, a neutralizing anti-PD-L1 mAb was added at culture initiation. This did not liberate T cell proliferation but, when added to cultures including 1-MA, reduced the recovery normally seen with iNOS inhibition (Figure 10A). PD-L1 blockade had no effect upon IFNγR−/− PerC cells suggesting that IFNγ was responsible for the reduced impact of 1-MA treatment (Figure 10A). Similar results were observed with mAb neutralization of PD-1 or addition of a PD-1 Fc fusion protein (data not shown). Speculating that mAb neutralization might be insufficient to counter the high level of PD-L1 expression found in culture, PerC cells from PD-L1−/− mice were studied. These cells exhibited the same T cell suppression profile as wild type PerC cells, with suppression broken by IFNγ neutralization or iNOS inhibition (Figure 10B). These data show that, regardless of high level PD-L1 expression by a large fraction of the cells comprising PerC cell culture, T cell suppression in this context is independent of PD-1/PD-L1 interaction.
Figure 10.
PD-L1 neutralization does not release T cell suppression. C57BL/6J (WT), PD-L1−/−, or IFNγR−/− PerC cells were analyzed ex vivo and after 48 hrs of culture with (αCD3) or without (CM) stimulation. Data are averages +/− SEM of 3–5 experiments.
4. Discussion
Using an in vitro model of the TME we report that T cell proliferation remains constrained despite blockade of the immune inhibitory PD-1/PD-L1 interaction. PerC cell culture led to a marked increase in IFNγ-driven PD-L1 expression by Mϕs, particularly following TCR ligation. Although more IFNγ was produced in SP cell culture, PD-L1 expression did not reach the level seen for PerC APCs and SP T cell proliferation was not suppressed. Direct activation of Mϕs and B cells by LPS also increased PD-L1 expression but less so following TCR ligation. The high APC:T cell ratio inherent to PerC cell culture promotes increased PD-L1 expression, a clinical biomarker characteristic of the immune suppressive conditions found within TMEs [14]. That PD-L1 blockade fails to rescue PerC T cell proliferation suggests the utility of this model to explore other options for patients not responding to this form of immunotherapy.
A key question raised by the observations reported herein is why PerC Mϕs exhibit such a marked increase in PD-L1 expression. Tissue “resident” Mϕs, such as those found in the marginal zone of the spleen, have particular gene expression patterns that reflect their location, function, and history [27]. The less marked change in PD-L1 expression by cultured SP Mϕs may result from their prior history of antigen exposure serving in their role of blood surveillance. Likewise, spleen and PerC B1 cells, subsets with a history of antigen exposure reflected in their basal levels of PD-L1 ex vivo, had less of a response to IFNγ or LPS [26]. In contrast, PerC Mϕs as “free-ranging” cells not associated with organized lymphoid tissue, conduct routine housekeeping functions and likely have less experience with external antigens [27]. Unlike SP Mϕs, the majority of PerC Mϕs express low levels of Class II MHC, B7, or PD-L1 in situ. Our study focused upon unstimulated C57BL/6J PerC Mϕs, i.e., these cells were not exposed to thioglycollate in vivo as reported in a prior study of Mϕ PD-L1 expression [28]. Other leucocytes in PerC preparations, including B2 cells and CD4 T cells, exhibited significant PD-L1 expression following activation. However, no cell type, expressed as much PD-L1 as that observed for PerC Mϕs following T cell activation. In light of recent studies, it is important to note that Mϕ PD-1 expression never reached the levels seen for PD-L1 (not shown, 29).
The distribution and ratios of cells within organized lymphoid tissue contrasts the cellular disorder characteristic of TMEs. “Hot” tumors are infiltrated by activated (effector/memory) T cells that have increased opportunity for interaction with Mϕs and other anti-inflammatory cells due to their increased proportional representation [21]. PerC lavage retrieves not only a high proportion of Mϕs, but also CD4+ PD-1+CD44hi IFNγ-producing T cells and anti-inflammatory PD-L1+ B1 cells [16,30]. In culture, these cells aggregate to reproduce key features of the TME. We have shown how the shape of the tissue culture well (“V”, “U”, or flat bottom) and cell concentration alter normal lymphocyte biology [16–18]. Essentially, conditions that increase IFNγ production, e.g., costimulation by CD28 ligation, increase T cell suppression by increasing iNOS production [17]. PD-1 blockade is particularly interesting in this regard as T cell costimulation is enhanced, increasing IFNγ production and iNOS expression ([31], Figure 10A). This “double-edged sword” aspect of IFNγ in anti-tumor immunity, i.e. promoting CD8 T cell differentiation but also inducing enzymes that lead to T cell suppression, has been described in several models [32,33]. Thus, even with high PD-L1 expression in the tumor bed, checkpoint inhibition may not be optimal for promoting cell-mediated immunity in every case [14].
We investigated BCR ligation of PerC cells and also found increased Mϕ PD-L1 expression (not shown). Cytokine analysis suggested that Type I interferon and GM-CSF drove PD-L1 expression following B cell activation. Since this profile aligned with that seen with LPS activation, we tested the αBCR (goat F(ab′)2 anti-mouse IgM) reagent on PerC cells from B cell-deficient (μMT) mice and attained results identical to wild type mice. Limulus amebocyte lysate (LAL) testing revealed significant (2 EU or 0.2 ng/μg of antibody) LPS contamination in the commercial αBCR reagent. Titering LPS, we found PerC Mϕs very sensitive to exposure as 0.1 ng (1 EU) of LPS doubled the PD-L1 MFI. Endotoxin levels in the FBS used for tissue culture and all mAb reagents used in our experiments were well below this 1 EU threshold. These observations illustrate how care must be exercised in reagent selection for studies of PD-L1 expression [34].
The results described herein suggest that PerC cell culture can reproduce essential elements of the aberrant immune regulation found within Mϕ-rich TMEs. High inhibitory PD-L1 expression by a disproportionate cohort of Mϕs and B cells would indicate that T cell proliferation should be liberated by inhibiting PD-1 ligation. However, this was not the case as mAb blockade enhanced IFNγ production and increased suppression. This contradiction parallels clinical observations where PD-L1 level may correlate with tumor burden and prognosis but not treatment outcome [14]. The PerC cell culture model may serve in defining the role of other costimulatory (ICOS/ICOSL, 41BB/41BBL, etc.) or coinhibitory (LAG3/MHCII, Tim3/GAL9, etc.) receptor ligand combinations, sterile inflammation receptors (CD36, TLRs, etc.) and cytokines (TH1, TH2, TH17, etc.) to the atypical immunity found within Mϕ-dense environments. With innovations in understanding strain-dependent variation in Mϕ activation, the human relevance of murine TME models will continue to advance and inform strategies to restore anti-tumor immunity and to optimize cancer vaccine efficacy [35–38].
Highlights.
Peritoneal cavity (PerC) cell culture models macrophage (Mϕ)-rich tumor microenvironments (TMEs)
PerC T cell proliferation is suppressed by Mϕs
IFNγ-driven PD-L1 expression increased markedly on PerC Mϕs
Blocking PD-1/PD-L1 interaction does not relieve suppression
Acknowledgments
This research was supported by the NIH AREA program (R15 AI 060356-01, R15 CA 136901-01). We are grateful to: Gabriella Composto, Kornelija Valiuskyte, and Amy Werda for piloting the PD-L1−/− experiments; Antonia Conti, Barri Deptula and Jeffrey Maslanka for their assistance with mouse husbandry; Dr. Daniel Barber for facilitating the acquisition, and Dr. Arlene Sharpe the provision, of PD-L1−/− mice.
Abbreviations
- APC
antigen presenting cell
- CM
complete media control
- iNOS
inducible nitric oxide synthase
- Mϕ
macrophage
- MZ
marginal zone
- PerC
peritoneal cavity
- SP
spleen
- 1-MA
NG-monomethyl-L-arginine
- TCR
T cell receptor
- TME
tumor microenvironment
Footnotes
Publisher's Disclaimer: This is a PDF file of an unedited manuscript that has been accepted for publication. As a service to our customers we are providing this early version of the manuscript. The manuscript will undergo copyediting, typesetting, and review of the resulting proof before it is published in its final citable form. Please note that during the production process errors may be discovered which could affect the content, and all legal disclaimers that apply to the journal pertain.
References
- 1.Han C, Juncadella I, Kinchen J, Buckley M, Klibanov A, Dryden K, Onengut-Gumuscu S, Erdbrugger U, Turner S, Shim Y, Tung K, Ravichandran K. Macrophages redirect phagocytosis by non-professional phagocytes and influence inflammation. Nature. 2016;539:570–574. doi: 10.1038/nature20141. [DOI] [PMC free article] [PubMed] [Google Scholar]
- 2.Mueller S, Ahmed R. Lymphoid stroma in the initiation and control of immune responses. Immunol Rev. 2008;224:284–294. doi: 10.1111/j.1600-065X.2008.00657.x. [DOI] [PubMed] [Google Scholar]
- 3.Mittal D, Gubin M, Schreiber R, Smyth M. New insights into cancer immunoediting and its three component phases-elimination, equilibrium, and escape. Curr Opin Immunol. 2014;27:16–25. doi: 10.1016/j.coi.2014.01.004. [DOI] [PMC free article] [PubMed] [Google Scholar]
- 4.Kelly P, Davison R, Bliss E, McGee J. Macrophages in human breast disease: a quantitative immunohistochemical study. Br J Cancer. 1988;57:174–177. doi: 10.1038/bjc.1988.36. [DOI] [PMC free article] [PubMed] [Google Scholar]
- 5.Topalian S, Taube J, Anders R, Pardoll D. Mechanism-driven biomarkers to guide immune checkpoint blockpoint in cancer therapy. Nat Rev Cancer. 2016;16:275–287. doi: 10.1038/nrc.2016.36. [DOI] [PMC free article] [PubMed] [Google Scholar]
- 6.Sato T, Terai M, Tamura Y, Alexeev V, Mastrangelo M, Selvan S. Interleukin 10 in the tumor microenvironment: a target for anticancer immunotherapy. Immunol Res. 2011;51:170–182. doi: 10.1007/s12026-011-8262-6. [DOI] [PubMed] [Google Scholar]
- 7.Chaput N, Svrcek M, Auperin A, Locher C, Drusch F, Malka D, Taieb J, Goere D, Ducreux M, Boige V. Tumour-infiltration CD68+ and CD57+ cells predict patient outcome in stage II-III colorectal cancer. Br J Cancer. 2013;109:1013–1022. doi: 10.1038/bjc.2013.362. [DOI] [PMC free article] [PubMed] [Google Scholar]
- 8.Luo Z, Wang Q, Lau WB, Lau B, Xu L, Zhao L, Yang H, Feng M, Xuan Y, Yang Y, Lei L, Wang C, Yi T, Zhao X, Wei Y, Zhou S. Tumor microenvironment: the culprit for ovarian cancer metastasis? Cancer Lett. 2016;377:174–182. doi: 10.1016/j.canlet.2016.04.038. [DOI] [PubMed] [Google Scholar]
- 9.Mlecnik B, Bindea G, Angell H, Maby P, Angelova M, Tougeron D, Church S, Lafontaine L, Fischer M, Fredriksen T, Sasso M, Bilocq A, Kirilovsky A, Obenauf A, Hamieh M, Berger A, Bruneval P, Tuech J, Sabourin J, LePessot F, Mauillon J, Rafii A, Laurent-Puig P, Speicher M, Trajanoski Z, Michel P, Sesboue R, Frebourg T, Pages F, Valge-Archer V, Latouche J, Galon J. Integrative analysis of colorectal cancer show immunoscore is a stronger predictor of patient survival than microsatellite instability. Immunity. 2016;44:698–711. doi: 10.1016/j.immuni.2016.02.025. [DOI] [PubMed] [Google Scholar]
- 10.Hodi F, O’Day S, McDermott D, Weber R, Sosman J, Haanen J, Gonzalez R, Robert C, Schadendorf D, Hassel J, Akerley W, van den Eertwegh A, Lutzky J, Lorigan P, Vaubel J, Linette G, Hogg D, Ottensmeier C, Lebbe C, Peschel C, Quirt I, Clark J, Wolchok J, Weber J, Tian J, Yellin M, Nichol G, Hoos A, Urba W. Improved survival with ipilimumab in patients with metastatic melanoma. N Engl J Med. 2010;363:711–723. doi: 10.1056/NEJMoa1003466. [DOI] [PMC free article] [PubMed] [Google Scholar]
- 11.Brahmer J, Tykodi S, Chow L, Hwu W, Topalian S, Hwu P, Drake C, Camacho L, Kauh J, Odunsi K, Pitot H, Hamid O, Bhatia S, Martins R, Eaton K, Chen S, Salay T, Alaparthy S, Grosso J, Korman A, Parker S, Agrawal S, Goldberg S, Pardoll D, Gupta A, Wigginton J. Safety and activity of anti-PD-L1 antibody in patients with advanced cancer. N Engl J Med. 2012;366:2455–2465. doi: 10.1056/NEJMoa1200694. [DOI] [PMC free article] [PubMed] [Google Scholar]
- 12.Topalian S, Hodi F, Brahmer J, Gettinger S, Smith D, McDermott D, Powderly J, Carvajal R, Sosman J, Atkins M, Leming P, Spigel D, Antonia S, Horn L, Drake C, Pardoll D, Chen L, Sharfman W, Anders R, Taube J, McMiller T, Xu H, Korman A, Jure-Kunkel M, Agrawal S, McDonald D, Kollia G, Gupta A, Wigginton J, Sznol M. Safety, activity, and immune correlates of anti-PD-1 antibody in cancer. N Engl J Med. 2012;366:2443–2454. doi: 10.1056/NEJMoa1200690. [DOI] [PMC free article] [PubMed] [Google Scholar]
- 13.Wolchok J, Kluger H, Callahan M, Postow M, Rizvi N, Lesokhin A, Segal N, Ariyan C, Gordon R, Reed K, Burke M, Caldwell A, Kronenberg S, Agunwanba B, Zhang X, Lowy I, Inzunza H, Feely W, Horak C, Hong Q, Korman A, Wigginton J, Gupta A, Sznol M. Nivolumab plus ipilimumab in advanced melanoma. N Engl J Med. 2013;369:122–133. doi: 10.1056/NEJMoa1302369. [DOI] [PMC free article] [PubMed] [Google Scholar]
- 14.O’Donnell J, Long G, Scolyer R, Teng M, Smyth M. Resistance to PD1/PDL1 checkpoint inhibition. Cancer Treat Rev. 2017;52:71–81. doi: 10.1016/j.ctrv.2016.11.007. [DOI] [PubMed] [Google Scholar]
- 15.Matlack R, Yeh K, Rosini L, Gonzalez D, Taylor J, Silberman D, Pennello A, Riggs J. Peritoneal macrophages suppress T-cell activation by amino acid catabolism. Immunology. 2006;117:386–395. doi: 10.1111/j.1365-2567.2005.02312.x. [DOI] [PMC free article] [PubMed] [Google Scholar]
- 16.Composto G, Gonzalez D, Bucknum A, Silberman D, Taylor J, Kozlowski M, Bloomfield T, Bartlett T, Riggs J. Peritoneal T lymphocyte regulation by macrophages. Immunobiology. 2011;216:256–264. doi: 10.1016/j.imbio.2010.04.002. [DOI] [PMC free article] [PubMed] [Google Scholar]
- 17.Silberman D, Bucknum A, Bartlett T, Composto G, Kozlowski M, Walker A, Werda A, Cua J, Sharpe A, Somerville J, Riggs J. CD28 ligation increases macrophage suppression of T-cell proliferation. Cell Mol Immunol. 2012;9:341–349. doi: 10.1038/cmi.2012.13. [DOI] [PMC free article] [PubMed] [Google Scholar]
- 18.Goldman N, Valiuskyte K, Londregan J, Swider A, Somerville J, Riggs J. Macrophage regulation of B cell proliferation. Cell Immunol. 2017;314:54–62. doi: 10.1016/j.cellimm.2017.02.002. [DOI] [PMC free article] [PubMed] [Google Scholar]
- 19.Zou W, Chen L. Inhibitory B7-family molecules in the tumour microenvironment. Nat Rev Immunol. 2008;8:467–477. doi: 10.1038/nri2326. [DOI] [PubMed] [Google Scholar]
- 20.June C, Ledbetter J, Gillespie M, Lindsten T, Thompson C. T-cell proliferation involving the CD28 pathway is associated with cyclosporine-resistant interleukin 2 gene expression. Mol Cell Biol. 1987;7:4472–4481. doi: 10.1128/mcb.7.12.4472. [DOI] [PMC free article] [PubMed] [Google Scholar]
- 21.Gajewski T, Schreiber H, Fu YX. Innate and adaptive immune cells in the tumor microenvironment. Nat Immunol. 2013;14:1014–1022. doi: 10.1038/ni.2703. [DOI] [PMC free article] [PubMed] [Google Scholar]
- 22.O’Garra A, Murphy K. From IL-10 to IL-12: how pathogens and their products stimulate APCs to induce T(H)1 development. Nat Immunol. 2009;10:929–932. doi: 10.1038/ni0909-929. [DOI] [PubMed] [Google Scholar]
- 23.Wang B, Li Q, Qin L, Zhao S, Wang J, Chen X. Transition of tumor-associated macrophages from MHC class IIhi to MHC class IIlow mediates tumor progression in mice. BMC Immunol. 2011;12:43. doi: 10.1186/1471-2172-12-43. [DOI] [PMC free article] [PubMed] [Google Scholar]
- 24.Baumgarth N. The double life of a B-1 cell: self-reactivity selects for protective effector functions. Nat Rev Immunol. 2011;11:34–46. doi: 10.1038/nri2901. [DOI] [PubMed] [Google Scholar]
- 25.Popi A, Longo-Maugeri l, Mariano M. An overview of B-1 cells as antigen-presenting cells. Front Immunol. 2016;7:138. doi: 10.3389/fimmu.2016.00138. [DOI] [PMC free article] [PubMed] [Google Scholar]
- 26.Khan A, Hams E, Floudas A, Sparwasser T, Weaver C, Fallon P. PD-L1hi B cells are critical regulators of humoral immunity. Nat Commun. 2015;6:5997. doi: 10.1038/ncomms6997. [DOI] [PubMed] [Google Scholar]
- 27.Davies L, Jenkins S, Allen J, Taylor P. Tissue-resident macrophages. Nat Immunol. 2014;14:986–995. doi: 10.1038/ni.2705. [DOI] [PMC free article] [PubMed] [Google Scholar]
- 28.Yamazaki T, Akiba H, Iwai H, Matsuda H, Aoki M, Tanno Y, Shin T, Tsuchiya H, Pardoll DM, Okumura K, Azuma M, Yagita H. Expression of programmed death 1 ligands by murine T cells and APC. J Immunol. 2002;169:5538–5545. doi: 10.4049/jimmunol.169.10.5538. [DOI] [PubMed] [Google Scholar]
- 29.Gordon S, Maute R, Dulken B, Hutter G, George B, McCracken M, Gupta R, Tsai J, Sinha R, Corey D, Ring A, Connolly A, Weissman I. Nature. 2017;545:495–499. doi: 10.1038/nature22396. [DOI] [PMC free article] [PubMed] [Google Scholar]
- 30.Moon H, Park C, Lee JG, Shin SH, Lee JH, Kho I, Kang KJ, Cha HS, Kim TJ. Early development in the peritoneal cavity of CD49dhigh Th1 memory phenotype CD4+ T cells with enhanced B cell helper activity. J Immunol. 2015;195:564–575. doi: 10.4049/jimmunol.1401661. [DOI] [PubMed] [Google Scholar]
- 31.Yamazaki T, Akiba H, Koyanagi A, Azuma M, Yagita H, Okumura K. Blockade of B7-H1 on macrophages suppresses CD4+ T cell proliferation by augmenting IFN-γ-induced nitric oxide production. J Immunol. 2005;175:1586–1592. doi: 10.4049/jimmunol.175.3.1586. [DOI] [PubMed] [Google Scholar]
- 32.Berner V, Liu H, Zhou Q, Alderson K, Sun K, Weiss J, Back T, Longo D, Blazar B, Wiltrout RH, Welniak L, Redelman D, Murphy W. IFN-γ mediates CD4+ T-cell loss and impairs secondary antitumor responses after successful initial immunotherapy. Nature Med. 2007;13:354–360. doi: 10.1038/nm1554. [DOI] [PubMed] [Google Scholar]
- 33.Currie A, Prosser A, McDonnell A, Cleaver A, Robinson B, Freeman G, van der Most R. Dual control of antitumor CD8 T cells through the programmed death-1/programmed death-ligand 1 pathway and immunosuppressive CD4 T cells: regulation and counter-regulation. J Immunol. 2009;183:7898–7908. doi: 10.4049/jimmunol.0901060. [DOI] [PubMed] [Google Scholar]
- 34.Schwarz H, Schmittner M, Duschl A, Horeis-Hoeck J. Residual endotoxin contaminations in recombinant proteins are sufficient to activate human CD1c+ dendritic cells. PLoS One. 2014;9:e113840. doi: 10.1371/journal.pone.0113840. [DOI] [PMC free article] [PubMed] [Google Scholar]
- 35.Buscher K, Ehinger E, Gupta P, Pramod A, Wolf D, Tweet G, Pan C, Mills C, Lusis A, Ley K. Natural variation of macrophage activation as disease-relevant phenotype predictive of inflammation and cancer survival. Nat Commun. 2017 Jul 24;8:16041. doi: 10.1038/ncomms16041. [DOI] [PMC free article] [PubMed] [Google Scholar]
- 36.Mahoney K, Rennert P, Freeman G. Combination cancer immunotherapy and new immunomodulatory targets. Nat Rev Drug Discov. 2015;14:561–584. doi: 10.1038/nrd4591. [DOI] [PubMed] [Google Scholar]
- 37.Smyth M, Ngiow S, Ribas A, Teng M. Combination cancer immunotherapies tailored to the tumour microenvironment. Nat Rev Clin Oncol. 2016;13:143–158. doi: 10.1038/nrclinonc.2015.209. [DOI] [PubMed] [Google Scholar]
- 38.Tran E, Robbins P, Rosenberg S. ‘Final common pathway’ of human cancer immunotherapy: targeting random somatic mutations. Nat Immunol. 2017;18:255–262. doi: 10.1038/ni.3682. [DOI] [PMC free article] [PubMed] [Google Scholar]


