

Abstract
As the health care industry shifts into the digital age, patients are increasingly being provided with access to electronic personal health records (PHRs) that are tethered to their provider-maintained electronic health records. This unprecedented access to personal health information can enable patients to more effectively manage their health, but little is actually known about patients’ ability to successfully use a PHR to perform health management tasks or the individual factors that influence task performance. This study evaluated the ability of 56 middle-aged adults (40–59 years) and 51 older adults (60–85 years) to use a simulated PHR to perform 15 common health management tasks encompassing medication management, review/interpretation of lab/test results, and health maintenance activities. Results indicated that participants in both age groups experienced significant difficulties in using the PHR to complete routine health management tasks. Data also showed that older adults, particularly those with lower numeracy and technology experience, encountered greater problems using the system. Furthermore, data revealed that the cognitive abilities predicting one’s task performance varied according to the complexity of the task. Results from this study identify important factors to consider in the design of PHRs so that they meet the needs of middle-aged and older adults. As deployment of PHRs is on the rise, knowledge of the individual factors that impact effective PHR use is critical to preventing an increase in health care disparities between those who are able to use a PHR and those who are not.
Keywords: personal health records, age, numeracy ability, cognitive ability, health management
Patients are increasingly using electronic personal health records (PHRs) to manage their health. PHRs are generally tethered to electronic health records (EHRs) and contain updated information about an individual’s health and health care in a secure and confidential environment that the individual can access online through a log-in process (Tang, Ash, Bates, Overhage, & Sands, 2006; Wynia & Dunn, 2010). PHRs may contain a variety of tools to help the individual understand and manage the information contained in their health record. For example, using a PHR that is tethered to their EHR, patients can retrieve information about their medical conditions, medications, and lab test results; manage their medical appointments; e-mail providers; request prescription refills; and obtain a vast amount of health-related information. PHRs are intended to give patients the benefit of greater access to a wide range of credible health information, data, and knowledge that they can use to improve their health and manage their health conditions (Tang et al., 2006).
Although adoption by the public has been slow, national surveys indicate that interest in PHRs is increasing. In a recent survey, 10% of Americans reported using electronic PHRs, a notable rise from just 3% reporting PHR use in a 2008 survey (Markle Foundation, 2011). In another national survey study (Undem, 2010), 40% of respondents who did not currently use a PHR expressed interest in using one. It has also been noted that PHR use is expected to increase as more physicians implement EHRs that interface with patient PHRs (Tenforde, Jain, & Hickner, 2011).
Patients who have used PHRs have reported positive effects such as knowing more about their health care, being able to ask their doctors new questions, and taking steps to improve their health (Undem, 2010). Studies have also indicated that use of a PHR can lead to decreased health care utilization and/or improved chronic disease control through better care coordination, access to care, communication, and patient empowerment (Green et al., 2008; Ralston et al., 2009; Simon et al., 2011). PHRs may be particularly useful tools for older patients because of the increased occurrence of chronic conditions and need for medical care in older populations. Adults reaching age 65 have an average life expectancy of an additional 18.8 years, during which time most will have at least one chronic condition and many will have multiple conditions (Administration on Aging, 2011). Due in part to the increased occurrence of chronic conditions, older persons average more office visits with doctors than do middle-aged adults. In 2007, those ages 65 and over averaged 7.1 office visits, whereas persons aged 45 to 65 averaged 3.7 office visits during that year (Administration on Aging, 2011).
Although the potential benefits of PHR use are beginning to be realized, little is known about individual factors that may impact a person’s ability to use a PHR to perform common health management tasks. Understanding factors that impact the ability of a patient, especially an older patient, to perform PHR-based health tasks is critical to the development of PHRs that are useful to and usable by health consumers.
Factors That May Impact PHR Task Performance
Given that PHRs are Web-based, use of a PHR to perform health management tasks requires the user to have computer and Internet skills. Thus, simply accessing a PHR can be challenging for consumer groups with limited Internet skills, such as many older adults. Although older adults are using the Internet at an increasing rate, there is still a digital divide: Only 53% of adults age 65 + go online, as compared with 77% of those between the ages of 50 and 64, 91% of those between the ages of 30 and 49, and 97% of those between the ages of 18 and 29 (Zickuhr & Madden, 2012). Therefore, it is likely that many older adults, especially those in the older cohorts, may have difficulties accessing and using PHRs because of limited computer and Internet experience. In fact, Kim et al. (2009) found that limited computer skills and computer anxiety were barriers to PHR use among a sample of low-income older adults. However, it is important to note that older adults who do use the Internet are able to access and use online health information (Fox, 2011).
Using a PHR could be particularly challenging for many older adults because of the wide range of cognitive abilities that may be required for performance of health management tasks. Although the requisite cognitive abilities to use a PHR have not yet been clearly defined, a cognitive task analysis of typical PHR tasks and findings in the literature linking cognitive abilities to performance of “e-health” tasks (e.g., Czaja et al., 2013; Sharit, Hernandez, Czaja, & Pirolli, 2008) can be used to hypothesize which cognitive abilities would likely impact PHR task performance. For example, locating and interpreting the results of a cholesterol panel ostensibly require patients to have adequate verbal ability to understand the language used, executive functioning to plan a strategy for retrieving the information from the PHR, selective attention to find the link to the cholesterol test results among all the other test results, working memory to hold on to the necessary information as the search for test results is performed, sufficient processing speed to support working memory, and spatial ability to navigate the PHR. Consequently, age-related changes in fluid cognitive abilities, such as working memory, processing speed, reasoning, and executive functioning, may affect older patients’ ability to perform such PHR tasks. Declines in these fluid abilities are well documented in the cognitive aging literature (e.g., Schaie & Willis, 2002) and have been shown to be important factors in the adoption and learning of new technologies (e.g., Czaja et al., 2006; Hanson, 2010) and in the performance of technology-based tasks (e.g., Charness, Kelley, Bosman, & Mottram, 2001; Czaja, Sharit, Ownby, Roth, & Nair, 2001; Sharit, Czaja, Nair, & Lee, 2003).
Health literacy skills, defined as the “degree to which individuals have the capacity to obtain, process, and understand basic health information and services needed to make appropriate health decisions” (Ratzan & Parker, 2000, p. ix), are also required for successful use of a PHR. Many studies have indicated that low health literacy limits the ability of an individual to understand information critical to managing his or her health (for a review, see Berkman, Sheridan, Donahue, Halpern, & Crotty, 2011). PHRs contain a considerable amount of health information, and those with low health literacy may experience difficulties in understanding how to navigate their PHR and, perhaps more important, understanding the health information provided. Sarkar et al. (2010) found that patients with low health literacy were less likely than patients with higher health literacy to view laboratory results, send e-mails to providers, request medication refills, and make medical appointments using a patient portal tethered to their EHR.
The numeracy component of health literacy may be especially critical to successful use of a PHR. Health numeracy has been gaining attention in recent years, as the importance of one’s numeracy skills in evaluating medical information and making medical decisions has become more widely recognized. Although a number of definitions exist (Reyna, Nelson, Han, & Dieckmann, 2009), health numeracy has recently been defined as “the ability to understand and apply information conveyed with numbers, tables and graphs, probabilities, and statistics to effectively communicate with health care providers, take care of one’s health, and participate in medical decisions” (Schapira et al., 2012, p. 2). Given that much of the information communicated to a patient through a PHR is numeric and provided in tables and graphs, health numeracy is needed to successfully use a PHR to manage one’s health and make medical decisions. This is especially true to the extent that PHR use reduces the frequency of face-to-face patient–provider discussions about test results and other quantitative information; thus, PHR use may eliminate the possible benefit of physician commentary about the patient’s test results and leave the patient to interpret the numbers and graphs.
Golbeck, Ahlers-Schmidt, Paschal, and Dismuke (2005) propose that health numeracy may be operationalized into four functional categories: (1) basic health numeracy, which involves making sense of quantitative data that requires no manipulation of numbers; (2) computational health numeracy, which involves the ability to use simple manipulations of numbers; (3) analytical health numeracy, which involves higher level concepts such as inference and estimation; and (4) statistical health numeracy, which involves the ability to compare information presented on different scales and to analyze health information involving life expectancy and risk. Using a PHR to carry out health-related tasks requires the patient to use all of these categories of health numeracy skills. For example, finding the date and time of an upcoming medical appointment requires basic health numeracy, determining whether test results are in the proper range relies on computational health numeracy, resolving how to manage a missed medication dosage requires analytical health numeracy, and interpreting probabilistic information displayed in graphs in the PHR necessitates statistical numeracy.
Given the range of numeracy skills required to perform health management tasks using a PHR, those with low health numeracy could encounter problems understanding and using the health data in their PHR. Health literacy and numeracy are closely linked, and individuals who typically exhibit low health literacy usually have poor health numeracy. Many studies have shown that older adults tend to have lower levels of health literacy than younger individuals (e.g., Baker, Gazmararian, Sudano, & Patterson, 2000; Kutner, Greenberg, Jin, & Paulsen, 2006; Williams et al., 1995); thus, older patients may be at a greater risk for experiencing difficulty using the information in their PHR because of the extensive numeracy requirements. However, to date, there has been only limited exploration of the role of health numeracy in PHR use, especially among older adults.
Study Objectives
The current study was conducted to examine the ability of middle-aged and older adults to use a PHR to perform common health management tasks and to investigate the impact of individual factors, such as Internet experience, cognitive abilities, health numeracy, and age, on task performance. A simulated PHR that was modeled after a widely used PHR system was populated with information for a fictitious patient. The performance of middle-aged and older adults was investigated using this PHR for three common health management functions: health maintenance activities, lab/test results activities, and medication management activities. This study expands on our previous study (Taha, Sharit, & Czaja, 2012), which examined the impact of Internet experience and numeracy skills on the performance of PHR-based health management tasks in a sample of older adults (60 to 85 years old). Specifically, in this study, we examined the role of cognitive abilities and expanded the age range of our study population.
The conceptual model that guided our study is shown in Figure 1. This model was developed by Morrow et al. (2006) in a study that investigated the relationships between demographic variables, sensory and cognitive abilities, and health literacy among a sample of middle-aged and older adults with chronic heart failure. In the current study, our focus was on the numeracy component of health literacy. We also examined the impact of demographic variables, cognitive abilities, and health numeracy on the performance of health management tasks.
Figure 1.
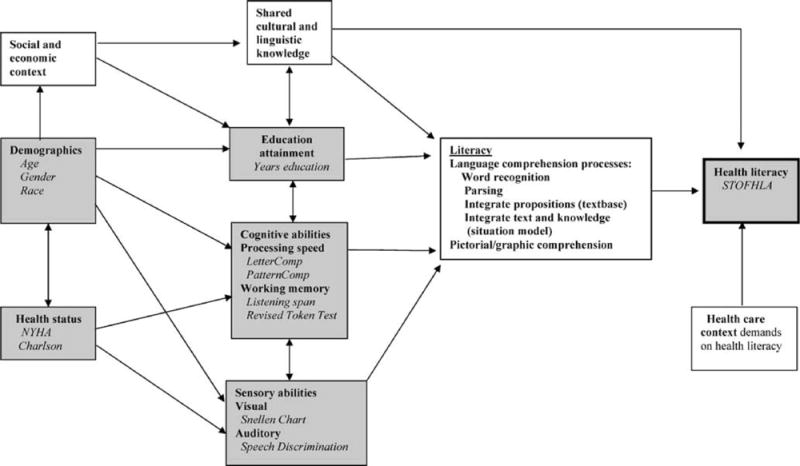
Conceptual model showing the health-related literacy framework (Morrow et al., 2006) that guided this research. NYHA = New York Health Association; Charlson = Charlson Comorbidity Index; STOFHLA = Short Test of Functional Health Literacy in Adults.
Method
Participants
Participants were recruited from the Miami area through placement of fliers in community organizations and senior centers and by word of mouth. Interested individuals contacted the study investigator by telephone, who provided an overview of the study and administered a telephone prescreening (e.g., age, primary language). Participants who were eligible and interested were scheduled for participation. All participants were required to be English-speaking and noncognitively impaired as measured by a score greater than 26 on the Mini Mental Status Examination (Folstein, Folstein, & McHugh, 1975), adjusted for age and education using the correction established by Mungas, Marshall, Weldon, Haan, and Reed (1996). Participants were not required to have any prior experience with computers, the Internet, or electronic PHRs, although 89% of participants did report prior computer experience and 79% reported prior Internet experience. Study participants included 107 adults ranging in age from 40 to 85 years (M = 58.87 years, SD = 11.89). Participants were divided into two groups: 56 middle-aged adults (40 to 59 years) and 51 older adults (60 to 85 years). Table 1 displays the demographic profile of the participants in the study. The sample was ethnically and educationally diverse, had fairly low incomes, and the majority reported to be in good to excellent health. Participants were compensated $65 and provided with free parking. The study was approved by the University of Miami’s Institutional Review Board and participants provided written informed consent.
Table 1.
Participants’ Characteristics
| Characteristic | Middle-aged (40–59 years) |
Older (60–85 years) |
Total sample (40–85 years) |
|---|---|---|---|
| Number | 56 | 51 | 107 |
| Mean (SD) age (years) | 49.36 (5.36) | 69.33 (7.45) | 58.87 (11.89) |
| Gender, % | |||
| Male | 51.8 | 39.2 | 45.8 |
| Female | 48.2 | 60.8 | 54.2 |
| Ethnicity, %** | |||
| Hispanic | 16.1 | 31.4 | 23.4 |
| Non-Hispanic White | 12.5 | 39.2 | 25.2 |
| Non-Hispanic Black | 67.9 | 29.4 | 49.5 |
| Non-Hispanic other | 3.6 | 0.0 | 1.9 |
| Education, %** | |||
| High school or less | 50.0 | 21.6 | 36.4 |
| Some college | 33.9 | 47.1 | 40.2 |
| College graduate/postgraduate | 16.1 | 31.4 | 23.4 |
| Yearly household income, %* | |||
| Less than $20,000 | 80.4 | 54.9 | 68.2 |
| $20,000 to $49,999 | 12.5 | 21.6 | 16.8 |
| $50,000 or more | 7.1 | 23.5 | 15.0 |
| General health, %* | |||
| Poor | 3.6 | 0.0 | 1.9 |
| Fair | 26.8 | 11.8 | 19.6 |
| Good | 44.6 | 49.0 | 46.7 |
| Very good | 19.6 | 29.4 | 24.3 |
| Excellent | 5.4 | 9.8 | 7.5 |
| Length of time using the Internet, % | |||
| Less than 6 months | 10.7 | 11.8 | 11.2 |
| Between 6 months and 1 year | 7.1 | 5.9 | 6.5 |
| More than 1 year, but less than 5 years | 25.0 | 9.8 | 17.8 |
| 5 years or more | 37.5 | 51.0 | 43.9 |
| Hours/week using the Internet, % | |||
| Less than 1 hr | 23.2 | 17.6 | 20.6 |
| Between 1 hr and 5 hr | 26.8 | 23.5 | 25.2 |
| More than 5 h, but less than 10 h | 10.7 | 13.7 | 12.1 |
| 10 h or more | 19.6 | 23.5 | 21.5 |
Note. Non-Hispanic other excluded from chi-square analysis; general health tested as two groups: fair/poor and good/very good/excellent; Length of time using the Internet and hours/week using the Internet excluded from chi-square analysis.
p < .05.
p < .01.
Measures
Demographics and technology experience
Demographic data such as gender, age, ethnicity, education, and income were collected using a background questionnaire (Czaja et al., 2006a). This questionnaire also gathered information on participants’ perceptions of their health, their medical conditions, and medications taken. It also assessed the degree to which participants’ agreed with 15 statements concerning their attitudes toward computers (Czaja et al., 2006a; Jay & Willis, 1992).
A technology experience questionnaire assessed use of common technologies such as ATMs, cell phones, and computers (Czaja et al., 2006b). Those who reported having experience with computers responded to questions concerning the extent of their typical computer use. Those who reported having Internet experience responded to questions concerning their frequency and duration of Internet use (see Table 1), as well as where they use the Internet and what types of activities they perform on the Internet. To create a variable that captured the participants’ overall Internet experience, the responses to the duration question (coded 1 to 4) were multiplied by the responses to the intensity question (coded 1 to 4), resulting in scores ranging from 1 to 16 for those participants who had Internet experience (participants with no prior Internet experience received a score of zero).
Background health knowledge and literacy
The Heart Disease Fact Questionnaire (HDFQ; Wagner, Lacey, Chyun, & Abbott, 2005) was used as a measure of participants’ background health knowledge. The HDFQ is a 25-item true–false questionnaire designed to assess respondents’ knowledge of major risk factors for the development of coronary heart disease. Approximately half of the questions address diabetes-related coronary heart disease risk factors (e.g., “A person who has diabetes can reduce their risk of developing heart disease if they keep their blood pressure under control”). This test was used as a proxy for health knowledge in this study, as many of the tasks participants were asked to perform using the PHR related to heart disease and diabetes.
Participants’ health literacy was measured using the Test of Functional Health Literacy in Adults (TOFHLA; Parker, Baker, Williams, & Nurss, 1995). The TOFHLA comprises a 50-item reading comprehension test and a 17-item numeracy component that consists of hospital forms and prescription bottles. TOFHLA scores range from 0 to 100, which are categorized as inadequate (0–59), marginal (60–74), and adequate (75–100).
Numeracy
Objective numeracy was measured using the scale developed by Lipkus, Samsa, and Rimer (2001). This widely used numeracy measure consists of 11 questions: three general numeracy questions similar to those used by Schwartz, Woloshin, Black, and Welch (1997) and eight additional questions that focus on numeracy in a health context. The general questions assess one’s ability to convert a percentage to a proportion, convert a proportion to a percentage, and determine how many times out of 1,000 rolls a fair die would come up an even number. The eight additional questions assess similar mathematical operations, but are phrased in the context of health risks. Correct answers are given 1 point, resulting in scores that range from 0 to 11.
Participants’ subjective numeracy was measured using the Subjective Numeracy Scale developed by Fagerlin et al. (2007). This measure evaluates one’s perceived ability to perform various mathematical tasks and preference for the use of numerical versus prose information. The Subjective Numeracy Scale consists of eight items: four questions that assess respondents’ beliefs about their skill in performing various mathematical operations and four questions that assess respondents’ preferences for presentation of numerical information. Participants answer each question on a 6-point Likert-type scale. Possible scores on the Subjective Numeracy Scale range from 8 to 48, with a higher score indicating greater perceived numeric abilities and a stronger preference for numerical information (e.g., preferring “there will be a 20% chance of rain today” to “there is a small chance of rain today”).
Component cognitive abilities
Participants were also administered a battery of cognitive tests. The tests contained in the battery were specifically selected on the basis of their ability to measure the component cognitive abilities that we hypothesized would impact performance of health management tasks using a PHR. The battery was administered to participants in two parts: a group format and an individual format (Czaja et al., 2006a). The measures administered in the group format included Cube Comparison (Ekstrom, French, Harman, & Dermen, 1976), Letter Sets (Ekstrom et al., 1976), Number Comparison (Ekstrom et al., 1976), Paper Folding (Ekstrom et al., 1976), and the Shipley Institute of Living Scale (Shipley, 1986). Measures administered in the individual format included Animal Fluency (Rosen, 1980), Digit–Symbol Substitution (Wechsler, 1981), Stroop Color and Word (computerized version; McCabe, Robertson, & Smith, 2005), and Trail Making Forms A and B (Reitan, 1958).
PHR Simulation
The PHR simulation was modeled on the design of Epic’s MyChart. MyChart is a tethered PHR that allows patients to link to portions of their clinician-controlled EHR to perform various health management activities such as reviewing test results, renewing prescriptions, e-mailing their health care providers, making appointments, and linking to relevant health information from sources such as Medline Plus. A thorough analysis of MyChart was completed to ensure that the simulation captured the relevant features of the system. Our simulated PHR was populated with the health information of a fictitious patient who had common health conditions such as diabetes, high blood pressure, high cholesterol, and heart disease. The home page of our simulated PHR is shown in Figure 2; a more detailed description of the features of the simulation can be found in Taha et al. (2012).
Figure 2.
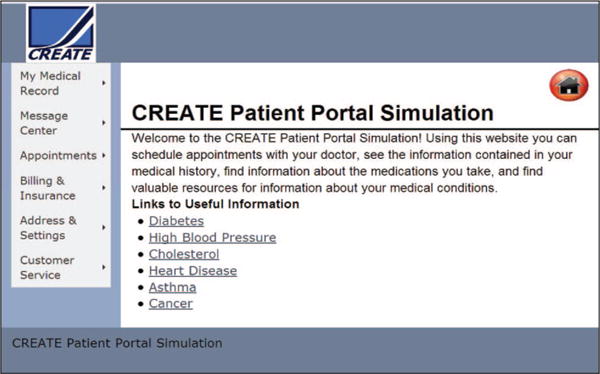
Home page of personal health record simulation.
Tasks
Fifteen realistic tasks were developed to assess the participants’ performance on health management tasks across three typical core functions of PHRs: health maintenance activities (e.g., locating an upcoming appointment date and time or using a link to a Website to read information about a condition), lab/test results activities (e.g., interpreting data from a cholesterol panel or complete blood count test), and medication management activities (e.g., following prescription dose schedules). The tasks were designed to span the spectrum of health numeracy ability proposed by Golbeck et al. (2005) and also to vary in level of complexity.
To classify task difficulty, we asked four independent raters who were blind to the objectives of the study to evaluate each of the 15 tasks by assigning the value of 5 to the task/tasks that they determined to be the most complex and assigning the value of 1 to the easiest task/tasks. The rest of the tasks were ranked in relation to these endpoints. The computation of Cronbach’s alpha revealed a high interrater reliability (α = .84) among the raters. The four ratings given to each task were averaged to get an overall rating of the difficulty of that task, resulting in weights ranging from 1.25 to 4.50. These weights were used to investigate participants’ task performance in two ways. First, an overall performance score was computed for each participant by multiplying the points the participant received on a task by the weight given to the task and then summing over all of the 15 tasks. Participants’ performance on each of the tasks was scored by the study investigators, who used a consensus approach to determine the correctness of participants’ responses. When making these determinations, investigators did not have access to any participant-identifying information. Answers that were left blank or incorrect were given a score of 0 points, partially correct answers were given 1 point, and completely correct answers were given 2 points. The overall performance score could range from 0 to 80.5.
Weights were also used to divide the tasks into two categories: seven “simple” tasks (tasks given weights from 1.25 to 2.25) and eight “complex” tasks (tasks given weights from 2.50 to 4.50). Participants’ performance scores were then computed for both task sets. The maximum performance scores that could be obtained for the simple and complex task sets were determined by summing the number of possible points in each category. Weights were used to categorize the tasks as either simple or complex only; weights were not used to adjust the individual task scores within the simple or complex task sets. Thus, the maximum scores for the simple and complex task sets were 14 and 16, respectively.
A cognitive task analysis was performed on each task to establish the elemental steps necessary to complete the task. Each elemental step was then analyzed to determine the cognitive skills needed to perform the step. Cognitive task analysis is used in both laboratory and real-world settings (Jonassen, Tessmer, & Hannum, 1999) to discover the underlying knowledge, skills, and structures of task performance by characterizing the reasoning skills and information processing of individuals as they perform tasks (Crandall, Klein, & Hoffman, 2006). A detailed summary of the underlying cognitive skills revealed by this analysis to be required for performance of each of the 15 tasks is presented in the Appendix.
Procedure
Participation in the study took place over 2 days. On the first day, following informed consent, participants were asked to complete the background questionnaire, the technology experience questionnaire, and the HDFQ. They were then administered the subjective numeracy and objective numeracy tests, followed by the group testing components of the cognitive battery. They were provided with breaks as needed.
On the second day, study participation occurred on an individual basis. Initially, each participant completed a vision test, the Mini Mental Status Examination, the individual testing components of the cognitive battery, and the TOFHLA. Only those who met the vision requirement (20/40 near and far, corrected or uncorrected) and cognitive screening criteria (Mini Mental Status Examination score > 26) proceeded with the remainder of the protocol.
Irrespective of their prior computer experience, all participants received a tutorial on basic computer skills (such as using a mouse and scrolling). They were then given a brief training session on how to use the PHR that included a description of each function in the menu on the home page (see Figure 2, left side of the screen capture) and an explanation of the type of information that could be obtained by selecting each of the menu options. For example, participants were taught that choosing the “Appointments” option from the menu would allow them to schedule, cancel, or view future and past appointments. The training also included a demonstration of how to use the links to other Websites containing relevant health information (e.g., the Website of the American Diabetes Association). The study investigator performed three sample problems with each participant at the conclusion of the training to ensure that he or she understood the information provided in the training. Participants were then given a packet that contained the 15 tasks, with space provided below each question for them to record their answers. They were allowed up to 2 hr to complete the 15 tasks.
Analyses
All analyses were conducted with IBM SPSS Statistics Version 19. First, we summarized participants’ scores on the measures (HDFQ, TOFHLA, subjective and objective numeracy, cognitive battery) using descriptive statistics and tested for significant differences between middle-aged and older participants’ scores using t tests. We also summarized Internet experience and tested for age group differences. Following those analyses, participants’ overall performance on the PHR tasks and their performance on the simple and complex task sets were summarized; t tests were again used to test for any significant differences between age groups.
Next, three hierarchical regression models were constructed for predicting the effects of education, Internet experience, cognitive abilities, objective numeracy scores, and age on task performance. We were first interested in determining the impact of these factors on overall performance of health management tasks. Therefore, the dependent measure in our first regression model was the overall performance score obtained for performance of the 15 tasks. As a secondary analysis, we examined the impact of these factors on simple/complex task performance using separate regression models for predicting performance of each task set. Thus, simple task performance score was the dependent measure in our second regression model, and complex task performance score was the dependent measure in the third model. We chose to construct separate models for simple and complex task performance to help identify any potential differences in the underlying component cognitive abilities that affect performance of health management tasks as task complexity increases.
In each of the models, the predictor variables were entered in the following order: education, Internet experience, cognitive abilities, objective numeracy, and age. Education was entered first as a control variable as there were significant differences in education between the two age groups, χ2(2, N = 107) = 9.74, p < .01. Internet experience was entered next because ability in using a Web-based PHR requires fundamental skills in using the computer and the Internet. Cognitive abilities were then entered because it was hypothesized that cognitive variables would have a significant impact on one’s ability to complete health tasks using a PHR beyond education and Internet skills. Numeracy ability was then added as a predictor to test the hypothesis that, given the numeric nature of health management tasks, numeracy would be an important factor in task performance over and beyond the influence of cognitive abilities. Finally, age was entered into the model to determine whether age influenced task performance after controlling for the other variables. In each of the models, an alpha level of .05 was used.
As we had hypothesized that a number of component cognitive abilities could likely impact PHR task performance, we administered a relatively extensive battery of cognitive measures. To select the most relevant of the measured cognitive abilities for inclusion in the regression models, we initially performed a correlation analysis. The analysis revealed that the following measures were the most highly correlated with overall performance and performance on simple and complex tasks: Trails B (executive function), Shipley Institute of Living Scale (verbal ability), and Letter Sets Test (reasoning; see Table 2). A natural log transformation of Trails B (time score) was performed to normalize the results before inclusion in the models.
Table 2.
Correlations Between Independent Variables and Performance Outcome Scores
| Performance score
|
|||
|---|---|---|---|
| Variable | Overall | Simple tasks | Complex tasks |
| Education | .257** | .289** | .233* |
| Internet experience | .532** | .470** | .522** |
| Objective numeracy | .656** | .572** | .646** |
| Letter Sets | .648** | .558** | .630** |
| Shipley Institute of Living Scale | .510** | .521** | .467** |
| Trail B (log of time) | −.589** | −.531** | −.566** |
| Age | −.276** | −.163 | −.295** |
p < .05.
p < .01.
Results
Measures
Participants’ performance on measures of background health knowledge (HDFQ), functional health literacy (TOFHLA), and subjective and objective numeracy are summarized in Table 3. As indicated in the table, there was a significant difference between middle-aged and older participants in scores on the HDFQ, t(104.58) = −2.96, p < .01. Older participants had higher scores on the HDFQ, signifying that they had more background health knowledge than the middle-aged participants. However, background health knowledge was not found to be significantly correlated with overall task performance or performance on simple or complex tasks; thus, this variable was not used in the regression analyses.
Table 3.
Summary of Scores
| Middle-aged (n = 56) |
Older (n = 51) |
Total sample (N = 107) |
||||
|---|---|---|---|---|---|---|
| Test | M | SD | M | SD | M | SD |
| HDFQ** | 18.20 | 3.92 | 20.27 | 3.34 | 19.19 | 3.78 |
| TOFHLA* | 90.29 | 8.54 | 86.08 | 10.72 | 88.28 | 9.82 |
| Subjective numeracy | 30.09 | 7.75 | 32.76 | 9.20 | 31.36 | 8.54 |
| Objective numeracy | 5.20 | 2.81 | 5.29 | 2.69 | 5.24 | 2.74 |
| Overall performance* | 42.41 | 19.32 | 34.78 | 20.41 | 38.78 | 20.12 |
| Simple tasks | 7.61 | 3.85 | 5.90 | 4.01 | 6.79 | 4.00 |
| Complex tasks* | 9.45 | 3.68 | 8.67 | 4.41 | 9.07 | 4.04 |
Note. HDFQ = Heart Disease Fact Questionnaire; TOFHLA = Test of Functional Health Literacy in Adults.
p < .05.
p < .01.
Most participants performed very well on the TOFHLA (see Table 3), indicating an overall high level of health literacy in the sample. Ninety-five participants (52 middle-aged and 43 older adults) had scores in the adequate range (75–100). Of the remaining participants, 11 (four middle-aged and seven older adults) had scores in the marginal range, and one participant in the older group had a score in the inadequate range (0–59). Although the overwhelming majority of participants were determined to have adequate health literacy, a significant difference was found between age groups, t(105) = 2.26, p = .03, with middle-aged adults scoring higher on the TOFHLA than older adults. A separate analysis of the 17-item numeracy section indicated no significant difference between age groups, t(105) = 1.04, p = .30, on this subscale. Scores ranged from 9 to 17 (M = 14.80) in the middle-aged group, and scores in the older age group ranged from 7 to 17 (M = 14.39).
No significant differences were found in either subjective or objective numeracy between age groups (see Table 3). For the entire sample, the correlation between subjective and objective numeracy was r(105) = .43 (p < .001); the correlation between subjective and objective numeracy was r(54) = .48 (p < .001) among middle-aged participants and r(49) = .40 (p < .01) among the older participants. Most participants subjectively rated their numeracy skills as quite high (M = 31.36, on a scale from 0 to 36), but the majority performed poorly on the objective numeracy measure. More than half of the participants (54%) correctly answered five or fewer of the 11 objective numeracy questions. On the three general numeracy items, less than 25% of participants could determine a simple probability, less than half could convert a percentage to a proportion, and less than 10% could convert a proportion to a percentage. Overall, 45% of participants answered no general numeracy questions correctly, 36% answered one item, 14% correctly answered two items, and only 5% correctly answered all three items. In general, participants performed much better on the eight health-context numeracy items. Six of the eight health-context items were correctly answered by at least 50% of participants.
The middle-aged participants scored higher than the older participants on all component cognitive ability measures except for the Shipley Institute of Living Scale (verbal ability), on which older adults scored higher than the middle-aged adults (see Table 4). These results are consistent with the cognitive aging literature that documents age-related declines in fluid abilities such as speed of processing, working memory, and executive functioning, whereas crystallized abilities such as vocabulary remain relatively intact (Schaie & Willis, 2002).
Table 4.
Summary of Participants’ Scores on Cognitive Measures
| Middle-aged (n = 56)
|
Older (n = 51)
|
|||||
|---|---|---|---|---|---|---|
| Test | M | SD | M | SD | t | df |
| Paper Folding (spatial ability) | 6.07 | 3.55 | 4.76 | 2.63 | 2.18* | 100.89 |
| Cube Comparison (spatial ability) | 18.11 | 4.85 | 13.9 | 4.34 | 4.71** | 105 |
| Letter Sets (reasoning) | 13.18 | 5.37 | 11.2 | 4.97 | 1.98 | 105 |
| Shipley Institute of Living Scale (verbal ability) | 26.73 | 6.92 | 29.9 | 5.11 | −2.67** | 105 |
| Number Comparison (processing speed) | 40.73 | 11.17 | 39.59 | 8.68 | 0.59 | 102.54 |
| Trails B (log of time; executive function) | 1.85 | 0.14 | 1.99 | 0.15 | −4.80** | 105 |
| Digit–Symbol Substitution (processing speed) | 63.38 | 15.26 | 52.25 | 13.25 | 4.01** | 105 |
| Stroop Color and Word (working memory) | 61.11 | 2.83 | 56 | 14.93 | 2.40* | 53.27 |
| Animal Fluency (verbal fluency) | 19.3 | 3.97 | 17.27 | 4.61 | 2.45* | 105 |
Note. Levine’s Test for equality of variance indicated that equal variances could not be assumed in Paper Folding Test, Number Comparison Test, and Stroop Color and Word Test, so adjustments were made to the degrees of freedom using the Welch–Satterthwaite method.
p < .05.
p < .01.
There was no significant difference in overall Internet experience between age groups, t(105) = −0.57, p = .58. Twenty-two participants (11 middle-aged and 11 older adults) reported having no experience with the Internet. The remaining participants had varying levels of experience (see Table 1).
PHR Task Performance
Middle-aged participants had overall performance scores ranging from 3.25 to 80.5, and older adults had scores ranging from 0 to 75.5. The results for the overall performance score (see Table 3) indicated that there was a significant difference between the two age groups, t(105) = 1.99, p = .05, with the middle-aged group performing significantly better than the older group.
Participants’ performance scores for the set of simple tasks and the set of complex tasks were also examined to determine any age group differences. There was no significant difference in performance of the simple tasks between the two age groups. Closer examination of performance on each of the simple tasks indicated that one task appeared to be particularly difficult for the majority of participants. Only 39% of participants (43% middle-aged and 35% older adults) were able to correctly complete a simple task that required finding the date and time of an upcoming appointment. Among participants who wrote down the correct date of the appointment, 23% of middle-aged participants and 26% of older participants failed to write down the time of the appointment. Performance on other simple tasks was generally good; more than 50% of participants were able to correctly complete all of the other simple tasks. The highest performance among simple tasks was seen on a task that required participants to use the PHR to locate the dosage instructions of a particular medication; 82% of participants completed this task correctly.
Although neither group performed particularly well on the complex tasks, the middle-aged participants performed significantly better than the older participants, t(105) = 2.24, p = .03. Approximately one quarter or less of the participants in either age group could correctly complete complex tasks that involved following directions to create a plate of food according to recommendations of the American Diabetes Association, compute the amount of insulin to take according to an insulin dose schedule, interpret risk information given in high blood pressure risk graphs, and determine blood components that were out of standard range on a complete blood count test result. In fact, not one participant in the older age group was able to provide a completely correct response to a task that required using information displayed in a graph (available from the Internet) to determine a patient’s risk of heart failure compared with normal risk.
Performance Models
The hierarchical regression models indicated some differences in the variables predicting overall task performance and those predicting performance on the sets of simple and complex tasks (see Table 5). In the model predicting overall performance, education, Internet experience, cognitive abilities, numeracy, and age were all significant. Specifically, education accounted for approximately 6% of the variance, Internet experience accounted for an additional 23%, and cognitive abilities accounted for an additional 30%. After accounting for education, Internet experience, and cognitive variables, the addition of objective numeracy accounted for an additional 4%, and age accounted for an additional 3% of the variance beyond objective numeracy. An examination of the cognitive abilities impacting overall performance indicated that verbal ability was the most influential (β = .20), followed by reasoning (β = .19) and then executive functioning (β = −.12).
Table 5.
Hierarchical Regression Models for Task Performance
| Model | R2 | Adj. R2 | ΔR2 | ΔF | df | p |
|---|---|---|---|---|---|---|
| Overall performance | ||||||
| 1a | .058 | .040 | .058 | 3.184 | 2, 104 | .046 |
| 2b | .290 | .270 | .233 | 33.761 | 1, 103 | .000 |
| 3c | .585 | .561 | .295 | 23.734 | 3, 100 | .000 |
| 4d | .621 | .594 | .036 | 9.323 | 1, 99 | .003 |
| 5e | .651 | .623 | .030 | 8.495 | 1, 98 | .004 |
| Simple tasks | ||||||
| 1a | .086 | .068 | .086 | 4.867 | 2, 104 | .010 |
| 2b | .246 | .224 | .160 | 21.869 | 1, 103 | .000 |
| 3c | .495 | .465 | .249 | 16.447 | 3, 100 | .000 |
| 4d | .508 | .473 | .013 | 2.606 | 1, 99 | .110 |
| 5e | .515 | .475 | .007 | 1.415 | 1, 98 | .237 |
| Complex tasks | ||||||
| 1a | .041 | .023 | .041 | 2.243 | 2, 104 | .111 |
| 2b | .274 | .253 | .233 | 33.045 | 1, 103 | .000 |
| 3c | .544 | .516 | .269 | 19.668 | 3, 100 | .000 |
| 4d | .590 | .561 | .047 | 11.312 | 1, 99 | .001 |
| 5e | .627 | .597 | .037 | 9.644 | 1, 98 | .002 |
Note. Education was entered as a dummy-coded variable, with “high school or less” as reference category; Internet experience was entered as a variable ranging from 0 to 16 (as explained in the text); age was entered as a continuous variable.
Education.
Education, Internet experience.
Education, Internet experience, Trails B, Shipley, Letter Sets.
Education, Internet experience, Trails B, Shipley, Letter Sets, objective numeracy.
Education, Internet experience, Trails B, Shipley, Letter Sets, objective numeracy, age.
In the model predicting performance of the simple tasks, numeracy and age were not found to be significant. Education accounted for 9% of the variance in performance of simple tasks, and Internet experience accounted for an additional 16% of the variance. The addition of the cognitive ability measures accounted for an additional 25% of the variance in performance. Examination of the cognitive variables indicated that executive functioning was the most influential cognitive ability (β = −.30) in predicting performance on simple tasks, followed closely by verbal ability (β = .28). Reasoning was not a significant predictor of performance on simple tasks.
In the model predicting performance of the complex tasks, Internet experience, cognitive abilities, objective numeracy, and age were all significant predictors of performance, whereas education was not significant. Specifically, Internet experience accounted for 23% of the variance and cognitive abilities accounted for an additional 27% of the variance. After accounting for both Internet experience and cognitive abilities, the addition of objective numeracy accounted for an additional 5% of variance, and age accounted for an additional 4% of the variance beyond objective numeracy. In this model, reasoning was the most influential cognitive ability (β = .19), followed closely by verbal ability (β = .16) and then executive functioning (β = −.09).
Discussion
This study examined the ability of middle-aged and older adults to use a simulated PHR to perform common health management tasks. We also examined individual characteristics that impacted task performance. Currently, little is known about consumers’ ability to use PHRs to engage in health management activities or about factors that contribute to user difficulties, especially among older patients. These are critical issues given the increased deployment of these systems coupled with the increase in the population of older adults, especially those in the oldest cohorts, who typically need more health care services. To develop PHRs that are usable and useful to patients, we must understand the factors that impact successful use of these systems among diverse samples of health consumers. Therefore, findings from this study regarding the difficulties experienced among both middle-aged and older adults have significant implications for the design of PHR aids and training strategies.
Overall, our findings are consistent with recent findings of Segall and colleagues (2011) who examined the usability of a PHR system among a small sample of adults (N = 20) with cardiovascular disease. Although all of the participants in that study expressed interest in using a PHR and found it useful, they had difficulty navigating the system and made errors in performing health management tasks. Similarly, we found that most of our participants—regardless of age group—experienced considerable difficulty in using the PHR to perform simple and complex tasks. Our data indicated that participants in both age groups encountered problems in using the PHR to perform routine health management tasks, and we also found significantly lower levels of overall task performance among the older participants compared with the middle-aged participants. Although it is likely that older patients also experience more difficulty relative to younger patients when performing health tasks on paper, it is expected that older adults will soon have to perform these tasks electronically. Therefore, it is important to evaluate task performance in the PHR environment, as PHRs will become standard tools for self-care in the future.
In terms of specific individual characteristics that influenced overall performance, our results showed that education, Internet experience, cognitive abilities, numeracy, and age were important predictors of performance. Participants who were older and less educated, had lower cognitive abilities and numeracy ability, and had limited Internet experience performed less well. These findings suggest that many consumers would have difficulty using these systems, especially those who are generally considered vulnerable with respect to health care disparities. Unless these issues are addressed, there is a risk for an increase in health care disparities between patients who are able to use their PHR and those who cannot.
In terms of cognitive abilities important to overall performance, we found that verbal ability had the strongest impact on performance, followed by reasoning and executive functioning. Interestingly, in our sample, older participants had significantly higher verbal ability than middle-aged participants, yet they obtained significantly lower overall performance scores. A possible explanation for these results is that the middle-aged participants were able to compensate for lower verbal abilities with higher fluid abilities. On average, the middle-aged adults had significantly higher fluid abilities than the older adults. As shown in the cognitive tasks analyses (see the Appendix), using a PHR places demands on fluid abilities such as attention and working memory. This is especially true for the more complex tasks such as interpreting graphical health information or lab/test results. These tasks required a broader range of fluid abilities than the simple tasks. More specifically, the complex tasks required more navigation through the PHR and more filtering of information than the simple tasks. This would place greater demands on visuospatial skills, executive functioning, and attentional capacity. Thus, middle-aged adults may have been able to perform better than older adults despite having lower verbal ability because their fluid abilities were more intact.
The regression models for the simple and complex task performance provided some additional insights into the impact of cognitive abilities on task performance. We found that the cognitive abilities predicting task performance varied according to task complexity. For the simple tasks, executive functioning was the most influential cognitive predictor of performance, followed by verbal ability. Reasoning was not found to significantly impact performance on simple tasks. In contrast, reasoning was found to be the most influential cognitive ability predicting complex task performance. Verbal ability and executive functioning were also significant cognitive ability predictors of performance on the complex tasks. These results are consistent with findings that reasoning ability was not a significant predictor of simple Internet-based health information-seeking tasks, whereas it was the most important cognitive ability predictor for more complex search tasks (Sharit et al., 2008). This finding suggests that to the extent that age-related declines in reasoning ability or in cognitive abilities that support reasoning (such as working memory and visuospatial ability) are evident, older adults will be at a disadvantage for performing more complex health management tasks using a PHR. This result also suggests that older adults with little or no decline in reasoning ability may be able to perform as well as younger adults on complex health-related tasks. In fact, studies have shown that older adults with high reasoning abilities are able to perform as well as younger adults on Internet-based health information-seeking tasks (Czaja, Sharit, Hernandez, Nair, & Loewenstein, 2010; Sharit et al., 2008).
Another striking difference between the models for predicting simple and complex task performance involved the role of Internet experience. This factor accounted for 16% of the variance in simple task performance and accounted for 23% of the variance in complex task performance. This finding underscores the importance of computer and Internet skills to PHR use. Clearly, people with no or limited Internet skills will be at a disadvantage when attempting to use these systems. This result could have significant implications for older adults, as this cohort often has limited Internet skills.
The importance of numeracy to the performance of health management tasks was also evident in this study. Numeracy was a significant predictor of performance even after accounting for Internet experience and cognitive abilities. Regardless of Internet experience and cognitive abilities, middle-aged and older adults with low numeracy skills are at risk for encountering problems using PHRs to complete health management tasks, especially more complex tasks such as determining how to manage a missed medication dose, interpreting test results, and understanding graphical health information.
We also found some interesting relationships between literacy and numeracy skills. Given that numeracy is usually conceptualized as a component of literacy, it would be logical to assume that numeracy skill would be lower in adults with lower health literacy skills. However, this assumption was not supported by the results of this study; although middle-aged participants exhibited significantly higher functional health literacy than older participants, they did not have significantly higher numeracy ability than older participants. Furthermore, although the overwhelming majority (89%) of both middle-aged and older participants had TOFHLA scores in the adequate range, 54% were unable to correctly answer the majority of the objective numeracy questions. This discrepancy between health literacy and numeracy implies that when patients use their PHRs to view numeric health information, many may encounter problems understanding the information even if they are considered to have “adequate” health literacy. These results underscore the importance of evaluating numeracy ability separately from health literacy.
The correlation between subjective and objective numeracy scores provides another interesting insight into the numeracy skills of this sample. Although the correlation between subjective and objective numeracy scores in the sample was significant (r = .43, p < .001), it was much smaller than the correlations (r = .63–.68) reported by Fagerlin et al. (2007). Most of the participants in this study tended to overestimate their numeracy ability, which implies that both middle-aged and older adults may believe that they can comprehend and use the numeric information provided in their PHR correctly when, in fact, they may not.
Some limitations of this study should be noted. One limitation was the sample size, which was limited to 107 participants. However, the sample was diverse in terms of gender, ethnicity, education, and Internet experience. Another limitation may have resulted from having participants use a health record that was fictitious. It was necessary to have all participants access the same health record to create a standard set of tasks on which to evaluate performance, but participants may not have performed as well as they would have if their own health records had been used because they may not have related to the given scenarios (M. M. Price, Pak, Muller, & Stronge, 2012). To attempt to minimize this limitation, we populated the fictitious record with information and health conditions that are common among middle-aged and older men and women. Finally, it is important to point out that participants had limited exposure to the PHR, as the task performance assessments were limited to one occasion. It is likely that users will become more efficient in the performance of common tasks with more experience using a PHR. On the other hand, if patients experience difficulties during initial use of their PHR, they may become frustrated and abandon adoption.
Importantly, the results from this study have identified a number of possible areas for further research. First, the findings indicated that the cognitive abilities impacting task performance vary according to the complexity of the task. Future studies could focus on implementing and evaluating aids within the PHR that are specifically designed to support the cognitive functions associated with a particular task. For example, results indicated that reasoning skill had a strong impact on performance of complex tasks. Thus, PHRs could provide aids to assist users when performing a complex task that requires reasoning, such as understanding risk information displayed in a graph. Also, as verbal ability strongly predicted overall performance of common health management tasks, simplifying the language used in a PHR could make performance of both simple and complex tasks easier for patients.
Future studies could also focus on determining the types of interface aids that could assist users with limited numeracy skills. This might involve, for example, highlighting health status indicators that are out of range, incorporating “more information” buttons, or using multimedia (e.g., audio and visual) formats to display health information. The fact that numeracy was found to significantly impact performance even after accounting for education, Internet experience, and cognitive abilities highlights the need to understand optimal methods for formatting numerical information contained in PHRs.
In addition to investigating the patient’s use of his or her PHR, future research could investigate how patient–companion dyads jointly use the patient’s PHR. As indicated by Wolff, Clayman, Rabins, Cook, and Roter (2012), many older patients have a family member or friend who accompanies them to physician visits and assists in facilitating provider–patient communication (Wolff & Roter, 2011), making treatment decisions (Morton, Tong, Howard, Snelling, & Webster, 2010; E. L. Price, Bereknyei, Kuby, Levinson, & Braddock, 2012), and adhering to treatment regimens (DiMatteo, 2004). Although PHRs may reduce face-to-face physician–patient interactions and, thus, the opportunity for supportive communication, an area worth investigating is the joint patient–companion use of the PHR as a means of compensating for this potential loss of information.
In conclusion, results from this study have provided valuable insights into the individual factors that impact the ability of middle-aged and older adults to perform common health management tasks using a PHR. This information is critically important to the development of PHRs that are usable by adult health consumers. For PHRs to realize their potential in transforming health care, they must be tailored to meet the needs and abilities of diverse user groups. Findings from this study indicate some important factors to consider in the design of PHRs to meet the needs of middle-aged and older adults. As deployment of PHRs is on the rise, knowledge of the individual factors that impact effective PHR use is critical to preventing an increase in health care disparities between those who are able to use a PHR and those who are not.
Acknowledgments
This research was supported by Agency for Healthcare Research and Quality Dissertation Grant R36HS018239 to Jessica Taha. The content is solely the responsibility of the authors and does not necessarily represent the official views of the Agency for Healthcare Research and Quality. This project was also supported by CREATE Grant 3 P01 AG017211. We thank Chin Chin Lee and Sankaran Nair whose advice and assistance contributed to this project.
Appendix: Task Summary Information
| Task | EMR Core function | Type of numeracy | Elemental tasks | Cognitive skills | Difficulty rating | Category |
|---|---|---|---|---|---|---|
| 1. Find date and time of upcoming appointment | Health maintenance | Basic: identify numbers and make sense of quantitative data requiring no manipulation of numbers | Locate “Appointments” link, locate “Future Appointments” link, click on “Appointment Details,” read appointment slip, find date and time, write both down on answer sheet | Verbal ability needed to comprehend the question, executive function needed for planning a solution, selective attention needed to find link, working memory needed to hold onto the information while searching for the appropriate links, processing speed needed to support working memory, spatial ability to navigate personal health record (PHR) | 1.25 | Simple |
| 2. Follow instructions to “Create Your Plate” | Health maintenance | Computational: count, quantify, compute, and otherwise use simple manipulation of numbers, quantities, items, or visual elements | Locate link to “Create Your Plate,” follow the sequence of steps, understand the direction to “put a line down the middle, then on one side cut it again so that you have three sections,” label the two small and one large sections properly | Verbal ability needed to comprehend the question, executive function needed for planning a solution, sequential reasoning needed to follow steps, spatial reasoning needed to divide plate properly, working memory needed to hold onto the information while creating plate, processing speed needed to support working memory, spatial ability to navigate PHR | 3.25 | Complex |
| 3. Determine glucose level after lunch from information in a table | Lab/test results | Basic: identify numbers and make sense of quantitative data requiring no manipulation of numbers | Locate link to glucose monitoring weekly summary, view table and locate the “average” row and “after lunch” column, write down number that is at the intersection of this row and column | Verbal ability needed to comprehend the question, executive function needed for planning a solution, selective attention needed to find the correct link, working memory needed to hold onto information while finding correct link, processing speed needed to support working memory, focused attention needed to find correct cell in the table, spatial ability to navigate PHR | 2.00 | Simple |
| 4. Determine the target range of glucose levels after meals from information in a table | Lab/test results | Basic: identify numbers and make sense of quantitative data requiring no manipulation of numbers | Stay in glucose monitoring weekly summary, locate link to “view table of target glucose levels,” click on link, find the target for after meals from the table, write down response | Verbal ability needed to comprehend the question, executive function needed for planning a solution, selective attention needed to find correct link, working memory needed to hold onto information while searching for link, processing speed needed to support working memory, focused attention needed to find target glucose after meals, spatial ability to navigate PHR | 1.50 | Simple |
| 5. Determine whether glucose level is in proper range | Lab/test results | Computational: count, quantify, compute, and otherwise use simple manipulation of numbers, quantities, items, or visual elements | Compare the average level they had after lunch (answer to previous question) with what is given in the table, write down response | Verbal ability needed to comprehend the question, executive function needed for planning a solution, focused attention and reasoning needed to compare the numbers, working memory needed to hold onto information while making the comparison, processing speed needed to support working memory, spatial ability to navigate PHR | 1.50 | Simple |
| 6. Locate the times/day for Metformin dose | Medication management | Basic: identify numbers and make sense of quantitative data requiring no manipulation of numbers | Locate link to medications, locate correct medication from list, read directions, write down response | Verbal ability needed to comprehend the question, executive function needed for planning a solution, selective attention needed to find correct link, working memory needed to hold onto information while searching for link, processing speed needed to support working memory, focused attention needed to find correct medication from list, spatial ability to navigate PHR | 1.25 | Simple |
| 7. Determine how to manage missed Metformin dose | Medication management | Analytical: involves higher level concepts such as inference, estimation, proportions, percentages, frequencies, and equivalent situations; often requires information to be pulled from multiple sources and in multiple formats | Click on patient information link for Metformin, scan through document to find section on “Missed Dose,” read the information and determine whether Pat should take it now or wait for next regularly scheduled dose, write down answer | Verbal ability needed to comprehend the question, executive function needed for planning a solution, reasoning needed to determine where the link to that type of information might be, selective attention needed to find correct link, working memory needed to hold onto information while searching through document, processing speed needed to support working memory, spatial reasoning needed to determine how close next dose is relative to last dose, spatial ability to navigate PHR | 4.25 | Complex |
| 8. Determine insulin dose from insulin dose schedule | Medication management | Analytical: involves higher level concepts such as inference, estimation, proportions, percentages, frequencies, and equivalent situations; often requires information to be pulled from multiple sources and in multiple formats | Locate link to insulin dose schedule, look at table to determine what amount of insulin is needed for that level of blood sugar at breakfast time, add to this amount the appropriate amount of insulin units for eating 40 g of carbohydrates | Verbal ability needed to comprehend the question, executive function needed for planning a solution, selective attention needed to find correct link, working memory needed to hold onto information while looking for the test results, processing speed needed to support working memory, quantitative reasoning needed to determine which mathematical operations to use, spatial ability to navigate PHR | 4.50 | Complex |
| 9. Read cholesterol panel | Lab/test results | Basic: identify numbers and make sense of quantitative data requiring no manipulation of numbers | Locate the link to “Test Results,” locate cholesterol panel results in list of test results, write down the components and the value for each component | Verbal ability needed to comprehend the question, executive function needed for planning a solution, selective attention needed to find correct link, working memory needed to hold onto information while looking for the test results, processing speed needed to support working memory, spatial ability to navigate PHR | 2.50 | Complex |
| 10. Interpret high blood pressure Graph 1 | Health maintenance | Statistical: involves an understanding of basic biostatistics involving probability statements, skills to compare information presented on different scales (probability, proportion, and percentage), the ability to critically analyze health information such as life expectancy and risk, and an understanding of statistical concepts such as randomization and a “blind” study | Locate the link to “High Blood Pressure Health Risk Calculator,” view graph, locate the bar that represents risk of heart failure, comprehend that “2.1× ” means “2.1 times greater than normal risk,” write down response | Verbal ability needed to comprehend the question, executive function needed for planning a solution, selective attention needed to find correct link, working memory needed to hold onto information while searching for the risk of heart failure, processing speed needed to support working memory, focused attention needed to pick out correct information from graph, statistical (domain-specific) knowledge needed to understand the information presented in the graph, spatial ability to navigate PHR | 3.75 | Complex |
| 11. Interpret high blood pressure Graph 2 | Health maintenance | Statistical: involves an understanding of basic biostatistics involving probability statements, skills to compare information presented on different scales (probability, proportion, and percentage), the ability to critically analyze health information such as life expectancy and risk, and an understanding of statistical concepts such as randomization and a “blind” study | Stay in the same link, view second graph located in link, locate the bar that represents the risk of heart failure and the bar that represents the risk of heart failure after lifestyle changes, comprehend that “1.0×” means that the risk has been reduced to the same level that is considered “normal risk,” write down response | Verbal ability needed to comprehend the question, executive function needed for planning a solution, visual scanning and focused attention needed to stay in the same link and look for further information, working memory needed to hold onto information while interpreting the information presented in the second graph, processing speed needed to support working memory, focused attention needed to find relevant information in the graph, reasoning needed to interpret information presented in the graph, spatial ability to navigate PHR | 3.00 | Complex |
| 12. Determine whether complete blood count (CBC) components are in standard range (yes/no question) | Lab/test results | Computational: count, quantify, compute, and otherwise use simple manipulation of numbers, quantities, items, or visual elements | Locate the link to “Test Results,” find CBC results from list, click on the most recent test date, look at the value in the column “Your Value” for each component and compare it with the values in the column “Standard Range,” determine whether the “Your Value” number is within the range given, write down response | Verbal ability needed to comprehend the question, executive function needed for planning a solution, selective attention needed to locate correct link to information, focused attention and working memory needed to compare component values with standard ranges, reasoning needed to make comparisons, processing speed needed to support working memory, spatial ability to navigate PHR | 2.25 | Simple |
| 13. Determine which CBC components are not in standard range | Lab/test results | Computational: count, quantify, compute, and otherwise use simple manipulation of numbers, quantities, items, or visual elements | Write down only those components that are outside of the standard range | Verbal ability needed to comprehend the question, executive function needed for planning a solution, focused attention and reasoning needed to compare the numbers, working memory needed to hold onto information while making the comparison, processing speed needed to support working memory, spatial ability to navigate PHR | 3.50 | Complex |
| 14. Determine whether lymphocytes are increasing/decreasing from a graph | Lab/test results | Analytical: involves higher level concepts such as inference, estimation, proportions, percentages, frequencies, and equivalent situations; often requires information to be pulled from multiple sources and in multiple formats | Stay in the link to blood test results, locate and click on the link to view graph, locate the line that represents “Lymphocytes,” look at the y-axis of the graph and determine whether the value has been increasing or decreasing, write down response | Verbal ability needed to comprehend the question, executive function needed for planning a solution, visual scanning and focused attention needed to stay in the same link and look for further information, selective attention needed to locate the link to graph, reasoning needed to understand the information presented in the graph, spatial ability to navigate PHR | 2.25 | Simple |
| 15. Determine whether monocytes are in standard range during a specified time period | Lab/test results | Analytical: involves higher level concepts such as inference, estimation, proportions, percentages, frequencies, and equivalent situations; often requires information to be pulled from multiple sources and in multiple formats | Stay in the link to the line graph of blood components, convert the dates to the correct numerical dates given on the x-axis of graph, return to previous page to look at the value of the component “Monocytes” during that time, compare range in graph with value of standard range given in the table | Verbal ability needed to comprehend the question, executive function needed for planning a solution, visual scanning and focused attention needed to stay in the same link and look for further information, number fluency needed to convert the dates, focused attention needed to compare graph component with values from table, reasoning needed to determine whether number is within the standard range, spatial ability to navigate PHR | 3.50 | Complex |
Contributor Information
Jessica Taha, Center on Aging, University of Miami Miller School of Medicine.
Sara J. Czaja, Department of Psychiatry and Behavioral Sciences, University of Miami Miller School of Medicine
Joseph Sharit, Department of Industrial Engineering, University of Miami.
Daniel G. Morrow, Department of Educational Psychology, University of Illinois at Urbana–Champaign
References
- Administration on Aging. A profile of older Americans: 2011. 2011 Retrieved from http://www.aoa.gov/AoARoot/Aging_Statistics/Profile/index.aspx.
- Baker DW, Gazmararian JA, Sudano J, Patterson M. The association between age and health literacy among elderly persons. The Journals of Gerontology, Series B: Psychological Sciences and Social Sciences. 2000;55:S368–S374. doi: 10.1093/geronb/55.6.S368. [DOI] [PubMed] [Google Scholar]
- Berkman ND, Sheridan SL, Donahue KE, Halpern DJ, Crotty K. Low health literacy and health outcomes: An updated systematic review. Annals of Internal Medicine. 2011;155:97–107. doi: 10.7326/0003-4819-155-2-201107190-00005. [DOI] [PubMed] [Google Scholar]
- Charness N, Kelley CL, Bosman EA, Mottram M. Word-processing training and retraining: Effects of adult age, experience, and interface. Psychology and Aging. 2001;16:110–127. doi: 10.1037/0882-7974.16.1.110. [DOI] [PubMed] [Google Scholar]
- Crandall B, Klein GA, Hoffman RR. Working minds: A practitioner’s guide to cognitive task analysis. Cambridge, MA: MIT Press; 2006. [Google Scholar]
- Czaja SJ, Charness N, Dijkstra K, Fisk AD, Rogers WA, Sharit J. Background questionnaire. Miami, FL: University of Miami; 2006a. (Tech Rep. No. CREATE-2006-02). [Google Scholar]
- Czaja SJ, Charness N, Dijkstra K, Fisk AD, Rogers WA, Sharit J. Computer and technology experience questionnaire. Miami, FL: University of Miami; 2006b. (Tech. Rep. No. CREATE-2006-03). [Google Scholar]
- Czaja SJ, Charness N, Fisk AD, Hertzog C, Nair SN, Rogers WA, Sharit J. Factors predicting the use of technology: Findings from the Center for Research and Education on Aging and Technology Enhancement (CREATE) Psychology and Aging. 2006;21:333–352. doi: 10.1037/0882-7974.21.2.333. [DOI] [PMC free article] [PubMed] [Google Scholar]
- Czaja SJ, Sharit J, Hernandez MA, Nair SN, Loewenstein D. Variability among older adults in Internet health information-seeking performance. Gerontechnology. 2010;9:46–55. doi: 10.4017/gt.2010.09.01.004.00. [DOI] [Google Scholar]
- Czaja SJ, Sharit J, Lee CC, Nair SN, Hernandez MA, Arana N, Fu SH. Factors influencing use of an e-health Website in a community sample of older adults. Journal of the American Medical Informatics Association. 2013;20:277–284. doi: 10.1136/amiajnl-2012-000876. [DOI] [PMC free article] [PubMed] [Google Scholar]
- Czaja SJ, Sharit J, Ownby R, Roth D, Nair S. Examining age differences in performance of a complex information search and retrieval task. Psychology and Aging. 2001;16:564–579. doi: 10.1037/0882-7974.16.4.564. [DOI] [PubMed] [Google Scholar]
- DiMatteo M. Social support and patient adherence to medical treatment: A meta-analysis. Health Psychology. 2004;23:207–218. doi: 10.1037/0278-6133.23.2.207. [DOI] [PubMed] [Google Scholar]
- Ekstrom RB, French JW, Harman HH, Dermen D. Manual for kit of factor-referenced cognitive tests. Princeton, NJ: Educational Testing Service; 1976. [Google Scholar]
- Fagerlin A, Zikmund-Fisher BJ, Ubel PA, Jankovic A, Derry HA, Smith DM. Measuring numeracy without a math test: Development of the Subjective Numeracy Scale. Medical Decision Making. 2007;27:672–680. doi: 10.1177/0272989X07304449. [DOI] [PubMed] [Google Scholar]
- Folstein MF, Folstein SE, McHugh PR. “Mini-mental state”. A practical method for grading the cognitive state of patients for the clinician. Journal of Psychiatric Research. 1975;12:189–198. doi: 10.1016/0022-3956(75)90026-6. [DOI] [PubMed] [Google Scholar]
- Fox S. Healthtopics. 2011 Retrieved from http://pewinternet.org/Reports/2011/HealthTopics.aspx.
- Golbeck AL, Ahlers-Schmidt CR, Paschal AM, Dismuke SE. A definition and operational framework for health numeracy. American Journal of Preventive Medicine. 2005;29:375–376. doi: 10.1016/j.amepre.2005.06.012. [DOI] [PubMed] [Google Scholar]
- Green BB, Cook AJ, Ralston JD, Fishman PA, Catz SL, Carlson J, Thompson RS. Effectiveness of home blood pressure monitoring, Web communication, and pharmacist care on hypertension control: A randomized controlled trial. Journal of the American Medical Association. 2008;299:2857–2867. doi: 10.1001/jama.299.24.2857. [DOI] [PMC free article] [PubMed] [Google Scholar]
- Hanson VL. Influencing technology adoption by older adults. Interacting with Computers. 2010;22:502–509. doi: 10.1016/j.intcom.2010.09.00. [DOI] [Google Scholar]
- Jay GM, Willis SL. Influence of direct computer experience on older adults’ attitudes toward computers. Journal of Gerontology. 1992;47:P250–P257. doi: 10.1093/geronj/47.4.P250. [DOI] [PubMed] [Google Scholar]
- Jonassen D, Tessmer M, Hannum WH. Task analysis methods for instructional design. Mahwah, NJ: Erlbaum; 1999. [Google Scholar]
- Kim E, Stolyar A, Lober WB, Herbaugh AL, Shinstrom SE, Zierler BK, Kim Y. Challenges to using an electronic personal health record by a low-income elderly population. Journal of Medical Internet Research. 2009;11:e44. doi: 10.2196/jmir.1256. [DOI] [PMC free article] [PubMed] [Google Scholar]
- Kutner M, Greenberg E, Jin Y, Paulsen C. The health literacy of America’s adults: Results from the 2003 National Assessment of Adult Literacy. Washington, DC: U.S. Government Printing Office; 2006. (NCES Report No. 2006-483). [Google Scholar]
- Lipkus IM, Samsa G, Rimer BK. General performance on a numeracy scale among highly educated samples. Medical Decision Making. 2001;21:37–44. doi: 10.1177/0272989X0102100105. [DOI] [PubMed] [Google Scholar]
- Markle Foundation. PHR adoption on the rise. 2011 Retrieved from http://www.markle.org/publications/1440-phr-adoption-rise.
- McCabe DP, Robertson CL, Smith AD. Age differences in Stroop interference in working memory. Journal of Clinical and Experimental Neuropsychology. 2005;27:633–644. doi: 10.1080/13803390490919218. [DOI] [PubMed] [Google Scholar]
- Morrow D, Clark D, Tu W, Wu J, Weiner M, Steinley D, Murray MD. Correlates of health literacy in patients with chronic heart failure. The Gerontologist. 2006;46:669–676. doi: 10.1093/geront/46.5.669. [DOI] [PubMed] [Google Scholar]
- Morton RL, Tong A, Howard K, Snelling P, Webster AC. The views of patients and carers in treatment decision making for chronic kidney disease: Systematic review and thematic synthesis of qualitative studies. British Medical Journal. 2010;340:c112. doi: 10.1136/bmj.c112. [DOI] [PMC free article] [PubMed] [Google Scholar]
- Mungas D, Marshall S, Weldon M, Haan M, Reed B. Age and education correction of Mini-Mental State Examination for English- and Spanish-speaking elderly. Neurology. 1996;46:700–706. doi: 10.1212/WNL.46.3.700. [DOI] [PubMed] [Google Scholar]
- Parker RM, Baker DW, Williams MV, Nurss JR. The Test of Functional Health Literacy in Adults. Journal of General Internal Medicine. 1995;10:537–541. doi: 10.1007/BF02640361. [DOI] [PubMed] [Google Scholar]
- Price EL, Bereknyei S, Kuby A, Levinson W, Braddock CH. New elements for informed decision making: A qualitative study of older adults’ views. Patient Education and Counseling. 2012;86:335–341. doi: 10.1016/j.pec.2011.06.006. [DOI] [PMC free article] [PubMed] [Google Scholar]
- Price MM, Pak R, Muller H, Stronge A. Older adults’ perceptions of usefulness of personal health information. Universal Access in the Information Society; 2012. Advance online publication. [DOI] [Google Scholar]
- Ralston JD, Hirsch IB, Hoath J, Mullen M, Cheadle A, Goldberg HI. Web-based collaborative care for Type 2 diabetes: A pilot randomized trial. Diabetes Care. 2009;32:234–239. doi: 10.2337/dc08-1220. [DOI] [PMC free article] [PubMed] [Google Scholar]
- Ratzan SC, Parker RM. Introduction. In: Selden CR, Zorn M, Ratzan SC, Parker RM, editors. National Library of Medicine Current Bibliographies in Medicine: Health literacy. Bethesda, MD: National Institutes of Health; 2000. (NLM Pub. No. CBM 2000-1). [Google Scholar]
- Reitan RM. Validity of the Trail Making Test as an indicator of organic brain damage. Perceptual and Motor Skills. 1958;8:271–276. doi: 10.2466/pms.1958.8.3.271. [DOI] [Google Scholar]
- Reyna VF, Nelson WL, Han PK, Dieckmann NF. How numeracy influences risk comprehension and medical decision making. Psychological Bulletin. 2009;135:943–973. doi: 10.1037/a0017327. [DOI] [PMC free article] [PubMed] [Google Scholar]
- Rosen WG. Verbal fluency in aging and dementia. Journal of Clinical and Experimental Neuropsychology. 1980;2:135–146. doi: 10.1080/01688638008403788. [DOI] [Google Scholar]
- Sarkar U, Karter AJ, Liu JY, Adler NE, Nguyen R, Lopez A, Schillinger D. The health literacy divide: Health literacy and the use of an Internet-based patient portal in an integrated health system—Results from the Diabetes Study of Northern California (DISTANCE) Journal of Health Communication: International Perspectives. 2010;15(Suppl 2):183–196. doi: 10.1080/10810730.2010.499988. [DOI] [PMC free article] [PubMed] [Google Scholar]
- Schaie KW, Willis SL. Adult development and aging. 5th. Upper Saddle River, NJ: Prentice Hall; 2002. [Google Scholar]
- Schapira MM, Walker CM, Cappaert KJ, Ganschow PS, Fletcher KE, McGinley EL, Jacobs EA. The Numeracy Understanding in Medicine Instrument: A measure of health numeracy developed using item response theory. Medical Decision Making. 2012 doi: 10.1177/0272989X12447239. Advance online publication. [DOI] [PMC free article] [PubMed] [Google Scholar]
- Schwartz LM, Woloshin S, Black WC, Welch HG. The role of numeracy in understanding the benefit of screening mammography. Annals of Internal Medicine. 1997;127:966–972. doi: 10.7326/0003-4819-127-11-199712010-00003. [DOI] [PubMed] [Google Scholar]
- Segall N, Saville JG, L’Engle P, Carlson B, Wright MC, Schulman K, Tcheng JE. Usability evaluation of a personal health record. AMIA Annual Symposium Proceedings. 2011;2011:1233–1242. [PMC free article] [PubMed] [Google Scholar]
- Sharit J, Czaja SJ, Nair S, Lee CC. Effects of age, speech rate and environmental support in using telephone voice menu systems. Human Factors. 2003;45:234–251. doi: 10.1518/hfes.45.2.234.27245. [DOI] [PubMed] [Google Scholar]
- Sharit J, Hernandez MA, Czaja SJ, Pirolli P. Investigating the roles of knowledge and cognitive abilities in older adult information seeking on the Web. ACM Transactions on Computer–Human Interaction. 2008;15:3. doi: 10.1145/1352782.1352785. [DOI] [PMC free article] [PubMed] [Google Scholar]
- Shipley WC. Shipley Institute of Living Scale. Los Angeles, CA: Western Psychological Services; 1986. [Google Scholar]
- Simon GE, Ralston JD, Savarino J, Pabiniak C, Wentzel C, Operskalski BH. Randomized trial of depression follow-up care by online messaging. Journal of General Internal Medicine. 2011;26:698–704. doi: 10.1007/s11606-011-1679-8. [DOI] [PMC free article] [PubMed] [Google Scholar]
- Taha J, Sharit J, Czaja SJ. The impact of numeracy ability and technology skills on older adults’ performance of health management tasks using a patient portal. Journal of Applied Gerontology. 2012 doi: 10.1177/0733464812447283. Advance online publication. [DOI] [PMC free article] [PubMed] [Google Scholar]
- Tang PC, Ash JS, Bates DW, Overhage M, Sands DZ. Personal health records: Definitions, benefits, and strategies for overcoming barriers to adoption. Journal of the American Medical Informatics Association. 2006;13:121–126. doi: 10.1197/jamia.M2025. [DOI] [PMC free article] [PubMed] [Google Scholar]
- Tenforde M, Jain A, Hickner J. The value of personal health records for chronic disease management: What do we know? Family Medicine. 2011;43:351–354. [PubMed] [Google Scholar]
- Undem T. Consumers and health information technology: A national survey. Berkeley, CA: California HealthCare Foundation; 2010. [Google Scholar]
- Wagner J, Lacey K, Chyun D, Abbott G. Development of a questionnaire to measure heart disease risk knowledge in people with diabetes: The Heart Disease Fact Questionnaire. Patient Education and Counseling. 2005;58:82–87. doi: 10.1016/j.pec.2004.07.004. [DOI] [PubMed] [Google Scholar]
- Wechsler D. Wechsler Adult Intelligence Scale. Third. San Antonio, TX: Harcourt Assessment; 1997. [Google Scholar]
- Williams MV, Parker RM, Baker DW, Parikh NS, Pitkin K, Coates WC, Nurss JR. Inadequate functional health literacy among patients at two public hospitals. Journal of the American Medical Association. 1995;274:1677–1682. doi: 10.1001/jama.1995.03530210031026. [DOI] [PubMed] [Google Scholar]
- Wolff JL, Clayman ML, Rabins P, Cook MA, Roter DL. An exploration of patient and family engagement in routine primary care visits. Health Expectations. 2012 doi: 10.1111/hex.12019. Advance online publication. [DOI] [PMC free article] [PubMed] [Google Scholar]
- Wolff JL, Roter DL. Family presence in routine medical visits: A meta-analytical review. Social Science & Medicine. 2011;72:823–831. doi: 10.1016/j.socscimed.2011.01.015. [DOI] [PMC free article] [PubMed] [Google Scholar]
- Wynia M, Dunn K. Dreams and nightmares: Practical and ethical issues for patients and physicians using personal health records. Journal of Law, Medicine & Ethics. 2010;38:64–73. doi: 10.1111/j.1748-720X.2010.00467.x. [DOI] [PubMed] [Google Scholar]
- Zickuhr K, Madden M. Older adults and Internet use. 2012 Retrieved from http://pewinternet.org/Reports/2012/Older-adults-and-internet-use.aspx.