Abstract
The Reggio group has constructed computer models of the inactive and G-protein activated states of the cannabinoid CB1 and CB2 receptors, as well, several orphan receptors that recognize a sub-set of cannabinoid compounds, including GPR55 and GPR18. These models have been used to design ligands, mutations and covalent labeling studies. The resultant second generation models have been used to design ligands with improved affinity, efficacy and sub-type selectivity. Herein, we provide a guide for the development of GPCR models using the most recent orphan receptor studied in our lab, GPR3.
GPR3 is an orphan receptor that belongs to the Class A family of G-Protein Coupled Receptors. It shares high sequence similarity with GPR6, GPR12, the lysophospholipid receptors, and the cannabinoid receptors. GPR3 is predominantly expressed in mammalian brain and oocytes and it is known as a Gαs-coupled receptor activated constitutively in cells.
GPR3 represents a possible target for the treatment of different pathological conditions such as Alzheimer’s disease, oocyte maturation or neuropathic pain. However, the lack of potent and selective GPR3 ligands is delaying the exploitation of this promising therapeutic target. In this context, we aim to develop a homology model that helps us to elucidate the structural determinants governing ligand-receptor interactions at GPR3.
In this chapter, we detail the methods and rationale behind the construction of the GPR3 active and inactive state models. These homology models will enable the rational design of novel ligands, which may serve as research tools for further understanding of the biological role of GPR3.
1. INTRODUCTION
The Reggio group has constructed computer models of the inactive and G-protein activated structures of the cannabinoid CB1 and CB2 receptors, as well, several orphan receptors that recognize a sub-set of cannabinoid compounds, including GPR55 and GPR18. These models have been used to design mutations and covalent labeling studies to test these models. The resultant second generation models have been used to design ligands with improved affinity and efficacy and sub-type selectivity. In this chapter, we provide a guide for the development of GPCR models and detail the steps that need to be taken in model development using the most recent orphan receptor under study in our lab, GPR3.
The cannabinoid receptors CB1 and CB2 have widely been confirmed as cannabinoid targets. Nevertheless, the complex pharmacology of the endocannabinoid system suggests the existence of other receptors playing important physiological roles. Because of its close phylogenetic relationship, GPR3, was presented by the IUPHAR as one of possible missing cannabinoid types (Pertwee et al., 2010). However, this categorization is still under debate due to the lack of experimental data.
GPR3 is a Class A orphan G-Protein Coupled Receptor (GPCR) that was firstly cloned in 1995 (Eggerickx et al., 1995; Song, Modi, & Bonner, 1995). This orphan receptor is broadly expressed in the central nervous system, ovaries and testes. GPR3 constitutively activates adenylate cyclase coupling to Gαs protein (Eggerickx et al., 1995). Interestingly, different researchers have demonstrated its ability to modulate amyloid-beta production suggesting that it may play a critical role in Alzheimer’s disease (Huang et al., 2015; Nelson & Sheng, 2013; Thathiah et al., 2009, 2013). In addition, GPR3 has been reported to promote neurite outgrowth (Tanaka et al., 2014; Tanaka, Ishii, Kasai, Sung, & Saeki, 2007; Tanaka, Shaikh, Chiocca, & Saeki, 2009), to regulate meiotic prophase arrest in oocyte maturation (Mehlmann et al., 2004), alter emotional behaviors (Valverde et al., 2009), to modulate early phases of cocaine reinforcement (Tourino et al., 2012), to control neuropathic pain after peripheral nerve injury (Ruiz-Medina, Ledent, & Valverde, 2011) and to be involved in age-related obesity (Godlewski et al., 2015). All these data indicate that GPR3 represents a potential therapeutic target for the treatment of a variety of physiopathological conditions.
GPR3 belongs to the same GPCR Class A subfamily than the cannabinoid, and the lysophospholipid receptors sharing many common structural features at key positions. Sequence similarities with CB1 and CB2 could indicate a possible relation of GPR3 with the endocannabinoid system. In this scenario, the development of a GPR3 homology model will give us deeper insights into its physiological function and it will enable structure-based drug design. Potent and efficacious modulators of this receptor will be crucial pharmacological tools for a better understanding of this promising therapeutic target.
The development of consistent and reliable homology models of GPCRs remains a difficult task. Despite the increasing number of released GPCR crystal structures, the low sequence identity, the complex GPCR functionality, and the high structural diversity among binding pockets make GPCR modeling a major challenge. Template-based modeling is known to be the most successful method for protein structure prediction. However, calculations to refine specific regions of the structure, taking into account all the experimental data available, are essential.
2. SEQUENCE ALIGNMENT
The generalized architecture of GPCRs consists of an extracellular N-terminus, followed by seven transmembrane α-helical domains (TMHs) connected by alternating extracellular (EC) and intracellular (IC) loops, and an intracellular C-terminus with a short helical segment (Hx8) oriented in parallel to the membrane surface (Rosenbaum, Rasmussen, & Kobilka, 2009). This overall topology is depicted in Figure 1, exemplified by a 2D helix net representation of the human GPR3 sequence. The TMHs of Class A GPCRs are arranged to form a closed bundle in the lipid bilayer. The ligand binding site in Class A GPCRs is generally within the EC half of the TMH bundle, and may extend to EC loop residues. This is referred to as the orthosteric binding site. Ligands may also bind to distinct (allosteric) binding sites of the receptor that can be within or outside of the TMH bundle and modulate the binding and signaling of orthosteric ligands.
Figure 1.
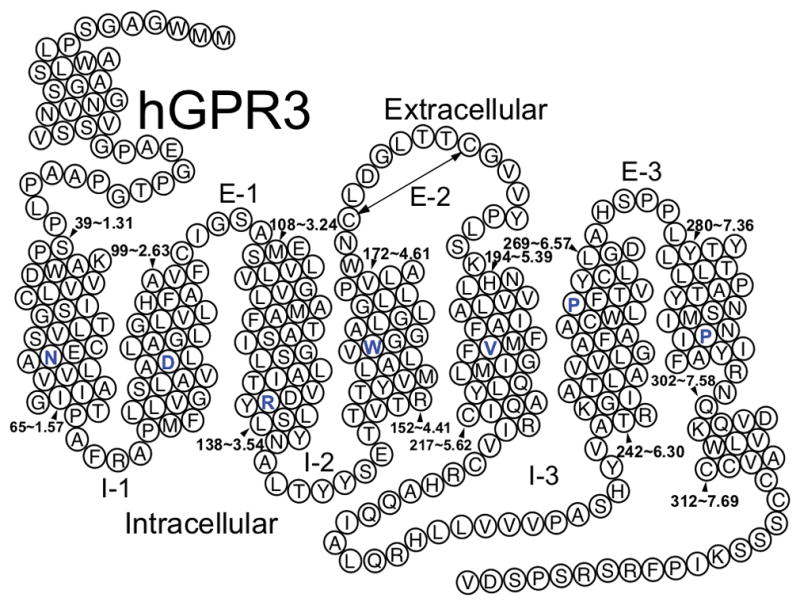
General topology of Class A GPCRs. Helix net representation of the human GPR3 sequence (the most highly conserved residue position in each TMH across Class A GPCRs is colored blue).
The first step in the construction of a particular GPCR homology model is the alignment of its sequence to that of other GPCRs with which the receptor has sequence similarities. Sequences of other GPCRs that have been crystallized can also be included in the alignment. Sequence alignments enable the identification of loop regions and regions with secondary structure such as α-helices and 310-helices, as well as common structural features or divergences at certain segments with other sequences.
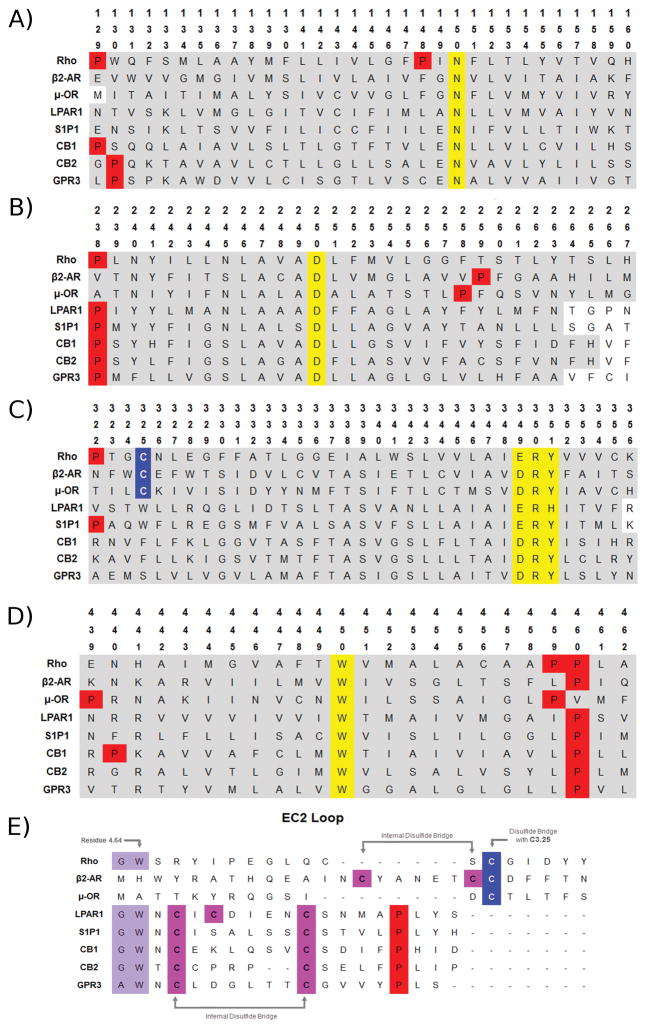
Class A GPCR sequences share a set of highly conserved residues and motifs that can be used as guides for sequence alignment. These are N1.50, D2.50, D/ERY in TMH3, W4.50, P5.50, CWXP in TMH6 and NPXXY in TMH7. These residues are highlighted in yellow in Figure 2. As is clear in Figure 1, these conserved residues and motifs are not located in the ligand binding pocket, but below it. This conservation pattern suggests the retention of similarity may be key for the “business” end of the receptor. These residues produce conformational changes that are key for coupling with effectors like G-protein and β-arrestin (Katritch et al., 2014). Because rhodopsin (Rho) was the first Class A GPCR that was crystallized (Palczewski et al., 2000) and because its sequence shows all of the highly conserved positions and motifs detailed above, Rho has been used as a template for the development of models of many other Class A GPCRs, including our early models of the cannabinoid CB1 and CB2 receptors.
Figure 2.
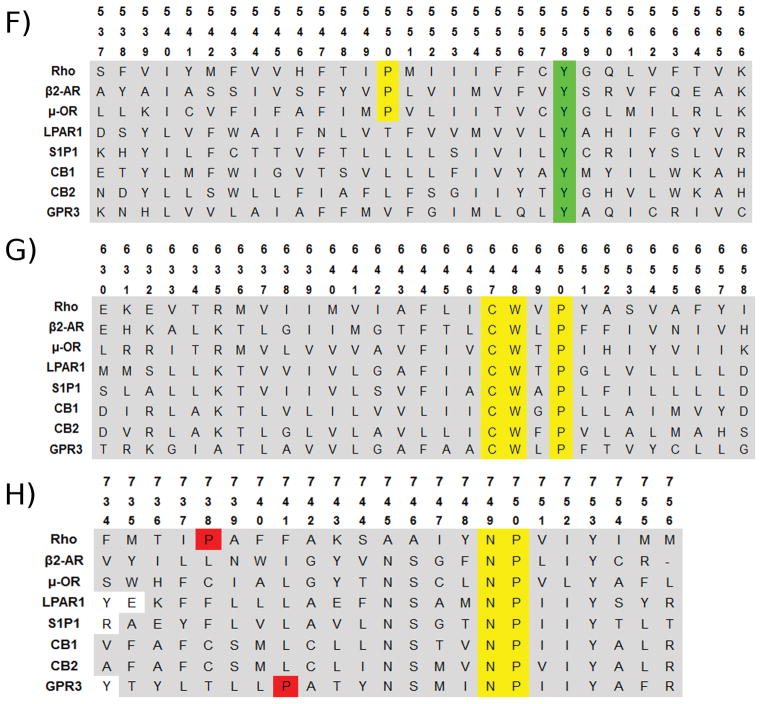
Human sequence alignments of Rho, β2-AR, μ-OR, LPAR1, S1PR1, CB1, CB2 and GPR3 receptors. A) Transmembrane helix 1 (TMH1); B) TMH2; C) TMH3; D) TMH4; E) EC2 loop; F) TMH5; G) TMH6; H) TMH7. Color code: red: prolines; yellow: highly conserved residues; pink: cysteines in an internal disulfide bridge; blue: cysteines in non-internal disulfide bridge; purple: particular motif.
Ballesteros-Weinstein Numbering System
The amino acid numbering system most widely used is the Ballesteros-Weinstein numbering system (Ballesteros & Weinstein, 1995) in which the most highly conserved residue across Class A GPCRs in each TMH is assigned a number .50. This number is preceded by the TMH number and can be followed by the absolute sequence number in parentheses. For example, the most highly conserved residue in TMH4 is W4.50. For GPR3, this residue is W4.50(161). The residue preceding this residue is V4.49(160) and the residue following it is G4.51(162). Loop residues in this system are identified by their absolute sequence numbers only.
Downloading GPCR Sequences
GPCR sequences can be downloaded from UniProt (Wasmuth & Lima, 2017) as FASTA files and aligned manually ( Ballesteros & Weinstein, 1992; Bramblett et al., 1995). However, there are several general-purpose multiple alignment programs available, the most accurate and widely used is the CLUSTAL W software (Larkin et al., 2007; Thompson, Higgins, & Gibson, 1994). This software, which is based on a position-specific scoring iterative method, calculates the best match for the selected sequences aligning them so that the identities, similarities, and differences can be seen. The website GPCRdb.org also provides sets of prealigned sequences of GPCRs (Isberg et al., 2016; Munk et al., 2016).
Cautions about Alignment Programs
Automatic programs can lead to misalignment of a transmembrane domain in a helix region for which the expected conserved residue or motif is missing or where more than one residue of the same type is positioned close to each other. It is not unusual for a receptor sequence to be missing a highly conserved residue or motif. In some cases, a very conservative substitution may appear. For example, in the GPR55 sequence, the TMH6 CWXP motif is replaced by SFLP. Given the fact that S and C are both hydrogen bonding residues and F and W are both aromatic residues, these substitutions are considered conservative and can be aligned with the CWXP motif of other GPCRs. However, there are times when substitution is not conservative. For example, the cannabinoid CB1 and CB2 receptors lack a proline at 5.50. Inspection of the TMH5 alignment in Figure 2F, shows that other receptors that have high sequence identity/similarity with CB1 and CB2, namely LPA1, S1P1 and GPR3 receptors also lack P5.50. In this case, one must identify another residue in TMH5 that is conserved in the GPR3, CB1, CB2, LPA1 and S1P1 receptor sub-set of sequences to be used in the TMH5 alignment. It is clear in Figure 2F that Y5.58 is common not only to the subset, but also to the other GPCR sequences in the alignment. So, Y5.58 has been typically used as the alignment guide for CB1, CB2 and GPR3 in TMH5. One additional point can be made about this TMH5 example. CB1 actually has three Tyr residues: Y(291), Y(293) and Y(295). Which Tyr should be aligned at 5.58? TMHs usually have positively charged residues at the end of TMHs on the IC side. These residues are thought to help anchor the receptor in the membrane by interaction with charged phospholipid head groups. This is frequently called the Positive Inside Rule. In CB1 TMH5, this residue is K(299). To decide which Tyr to use for alignment in this case, we selected the alignment that would place K(299) facing lipid head groups. The only alignment that resulted in this used Y(293) as 5.58 (Ballesteros & Weinstein, 1992; Bramblett et al., 1995).
It is also possible that a motif is missing. This is the case with GPR35 and GPR55 that lack the NPXXY motif in TMH7, but have DAICY and DVFCY instead. In this case, the retained Y in DAICY and DVFCY can be aligned with the Y of NPXXY in other Class A GPCRs.
These discrepancies in TMH5 and TMH7 alignments, that involve the lack of a proline, however, should serve as an immediate warning to the investigator, because this means that TMH5 or TMH7 is not going to have the shape/bend and possibly even the same residues facing the binding pocket as found in receptors that possess the highly conserved residue or motif. For TMH5, it is not just that TMH5 will not be bent because it lacks a proline. P5.50 causes a wide turn above it that results in a change in which residues above it actually face the binding pocket. So, one should expect a difference in where TMH5 residues EC to P5.50 face in space compared to those in a TMH5 that lacks P5.50.
Species Differences
Possible receptor sequence differences among species should be also taken into account in order to develop a reliable homology model consistent with the available experimental data. Species sequence alignments give remarkable information about striking differences at key positions. Significant species divergences have been recently reported for the cannabinoid receptors CB1 (Iyer et al., 2015), and CB2 (Zhang et al., 2015), and the related orphan receptor GPR55 (Lingerfelt et al., 2017). The last thing anyone wants to do is to develop a high affinity ligand for the rat homologue of a receptor, only to find out later that the human sequence lacks a key interaction site identified for the drug. One probably does not want to have the reverse happen either-where a drug has been designed using the human sequence and the human form of the receptor in cell based assays, only to discover that the drug has no effect in mice or rats (usual in vivo models) because one of the key interaction sites of the drug in humans is missing in rat/mouse.
GPR3 sequence alignment
Herein, the human GPR3 sequence was aligned to the human sequences of the following receptors: Rho, CB1, CB2, μ-OR (μ-opioid receptor), β2-AR (β2-adrenergic receptor), LPAR1 (lysophosphatidic acid receptor 1) and S1PR1 (sphingosine-1-phosphate receptor 1). The same highly conserved residues that have been used in the past to align CB1 (Bramblett et al., 1995; Hurst et al., 2002a; Song, Slowey, Hurst, & Reggio, 1999) and CB2 (Nebane et al., 2008; Zhang, Hurst, Barnett-Norris, Reggio, & Song, 2005) receptors to the sequence of rhodopsin were used as alignment guides for the GPR3 sequence (N1.50, D2.50, R3.50, W4.50, V5.50 and conserved motifs). As mentioned above, like the CB1, CB2, LPA1 and S1P1 receptors, GPR3 lacks the highly conserved proline at 5.50. To align the GPR3 sequence in the region of TMH5, Y5.58 was used as the alignment guide. GPR3 has a conservative substitution for the TMH3 E/DRY (DRY), the TMH6 CWXP (CWLP), and the TMH7 NPXXY (NPIIY) motifs. Alignment of representative helices or loops of human sequences of the aforementioned receptors with GPR3 are shown in Figure 2.
3. CHOOSING THE APPROPRIATE TEMPLATE FOR MODEL CONSTRUCTION
The election of an appropriate template GPCR crystal structure is a key hallmark in GPCR homology modeling. Sequence similarities and common structural features between possible templates and the target GPCR should guide the template selection. Too many papers in the literature cite the fact that a template is the “newest” crystal structure as justification for use as a template for modeling. The best template for the construction of a new receptor model should satisfy three basic features:
Identical location of helix bending residues (Pro, Ser, Thr and Gly). The first pass for this would be that the locations of prolines match your sequence. This is discussed in more detail in the next section.
The template structure recognizes ligands similar to yours. This has its biggest impact on the EC loop and N-terminus structures of the template. Many early solved structures recognized small positively charged ligands (β2-AR) or peptides (opioid receptors). These ligands would be expected to enter the ligand binding pocket by descending from the extracellular milieu and their crystal structures reveal an extracellular open space in the bundle. More recent structures have been solved for receptors that recognize lipid derived ligands, such as S1PR1 (Hanson et al., 2012) and LPAR1 (Chrencik et al., 2015). These structures have their EC regions closed to the extracellular milieu, but have a portal between helices for entry of ligands from the lipid bilayer.
The template should lack any crystal packing problems that impinge on the structure. Today, there is an increasing number of high-resolution GPCR X-ray crystal structures available, most of them of the corresponding inactive states. Despite the remarkable advances in structural determination techniques, some co-crystallization molecules and/or modified receptor constructs (such as mutations) are often needed for stabilizing these proteins (Salon, Lodowski, & Palczewski, 2011). T4-lysoyme insertions in the IC-3 loop are quite common modifications. The inclusion is larger than the loop itself and can cause changes at the IC end of the helices to which it is attached. For example, in the first β2-AR structure of the inactive state (Cherezov et al., 2007), the R3.50/D6.30 ionic lock (a hallmark interaction that stabilizes the inactive state of Class A GPCRs) was broken. In all likelihood, this was caused by an effect on the IC end of TMH6, which pulled it away from the bundle. In addition, crystal packing can deform a structure. The most common deformations affect extracellular or intracellular loop conformations. This is caused when, for example, one TMH bundle crystallizes on top of an adjacent TMH bundle. The cannabinoid CB1 receptor structure (Hua et al., 2016) is a good example of this. Here the results are that all extracellular loops and the N terminus are “flattened”. To check packing in a crystal structure, view the 3×3-unit cell on the PDB Data Bank (http://www.rcsb.org/pdb/home/home.do) entry for the receptor of choice.
In order to determine sequence similarities between GPCRs, it is also important to analyze their phylogenetic relationships. Closely related GPCRs share many common conserved and unique sequence motifs (Cvicek, Goddard, & Abrol, 2016). GPR3 is a class A orphan GPCR that belongs to the MECA cluster (Fredriksson, Lagerström, Lundin, & Schiöth, 2003; Fredriksson & Schio, 2005). As highlighted in the phylogenetic tree in Figure 3, this cluster consists of the melanocortin receptors (MCRs), the endothelial differentiation G-protein coupled receptors (EDGRs, currently known as lysophospholipid receptors: sphingosine 1-phosphate and lysophosphatidic acid receptors), the cannabinoid receptors (CNRs), the adenosin binding receptors (ADORAs), and the orphan receptors subset GPR-3, −6, and −12. As reported by Fredriksson and coworkers, GPR3 and GPR6 share the same chromosomal positions as the CNRs (CB1 and CB2), which indicates that they may share a common ancestor with the cannabinoids (Fredriksson et al., 2003).
Figure 3.
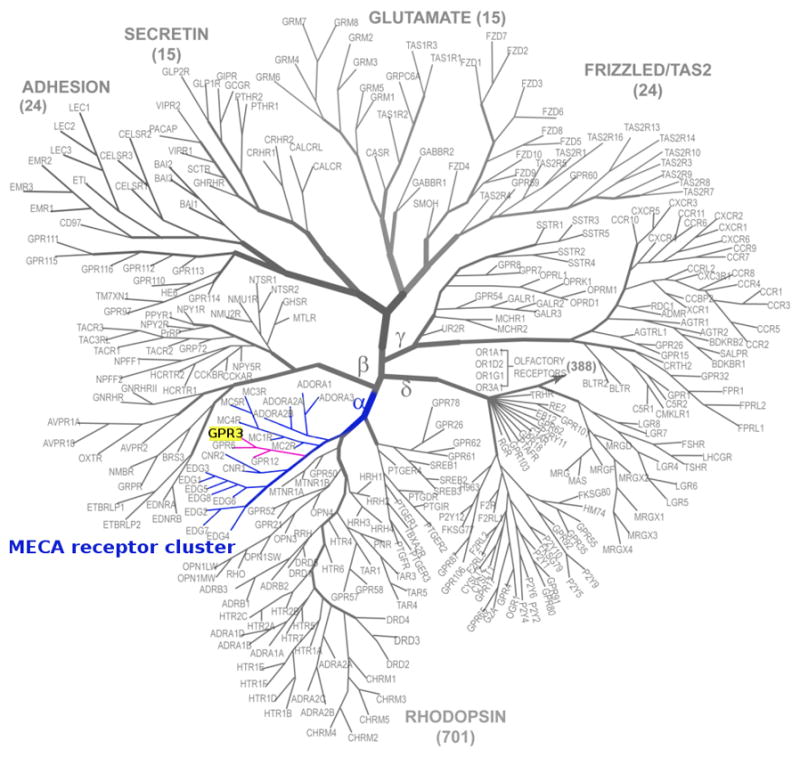
Phylogenetic tree representation of the human GPCR superfamily. The GPCR-network diagram is adapted with permission from (Katritch, Cherezov, & Stevens, 2012), Elsevier. The class A GPCR MECA receptor cluster is highlighted in blue. The orphan subset of this cluster is highlighted in pink, including our target, GPR3, highlighted in yellow.
In a deeper look into sequence similarities, we have analyzed and compared the GPR3 sequence with that of the closely related receptors GPR6, GPR12, S1PR1, LPAR1, CB1 and CB2. S1PR1 (Hanson et al., 2012), LPAR1 (Chrencik et al., 2015), and CB1 (Hua et al., 2016; Shao et al., 2016) are the only lipid-sensing receptors from this set of class A GPCRs that have been crystallized. The widely studied receptors Rho (Li, Edwards, Burghammer, Villa, & Schertler, 2004), β2-AR (Rasmussen et al., 2011), μ-OR (Manglik, Kruse, Kobilka, Thian, Jesper, et al., 2012) and the cannabinoid-related orphan receptors GPR55 (Ross, 2009) and GPR18 (Pertwee et al., 2010) were also included for comparison.
As depicted in Table 1, the GPR3-6-12 subset of orphan receptors share a very high percentage of homology among them making up a family of constitutively active Gαs-coupled GPCRs that sustain an elevated level of intracellular cAMP (Eggerickx et al., 1995). In addition, GPR3 presents 50% of sequence similarity at the transmembrane level and about 20% of sequence identity of the full sequence with the lysophospholipid receptors S1PR1 and LPAR1. A high percentage of homology is also shared between GPR3 and the cannabinoid receptors. Lower sequence similarities were found when compared with Rho, β2-AR, μ-OR, GPR55 or GPR18.
Table 1.
Comparison of GPR3 sequence with that of GPR6, GPR12, S1PR1, LPAR1, CB1, CB2, Rho, β2-AR, μ-OR, GPR55 and GPR18.
| GPR3 compared to the following Class A GPCRs |
SS | SI | SS | SI |
|---|---|---|---|---|
| TMH | TMH | Full seq. | Full seq. | |
| GPR6 | 78 | 64 | 65 | 53 |
| GPR12 | 80 | 63 | 68 | 53 |
| S1PR1*# | 50 | 28 | 39 | 20 |
| LPAR1*# | 50 | 30 | 38 | 21 |
| CB1* | 43 | 27 | 27 | 16 |
| CB2 | 44 | 27 | 33 | 19 |
| Rho* | 38 | 18 | 29 | 13 |
| β2-AR* | 36 | 19 | 28 | 15 |
| μ-OR* | 36 | 17 | 26 | 13 |
| GPR55 | 33 | 16 | 26 | 12 |
| GPR18 | 32 | 15 | 25 | 11 |
Data obtained from GPCRdb.org
% Sequence similarity (SS) and % sequence identity (SI) with GPR3 when considering the full sequence or at a transmembrane level.
Crystallized GPCRs.
Highest percentage of sequence homology among crystal structures [PDB ID codes: 3V2Y (S1PR1), 4Z35 (LPAR1)].
From this data, we can conclude that based upon sequence similarities, S1PR1 and LPAR1 crystal structures represent the most suitable templates for building a GPR3 homology model. However, sequence similarities should not be used as the sole criteria for homology modelling template selection, the presence or absence of particular structural features needs to be considered.
The identification of particular motifs or features such as helix distortions (kinks and bulges), helix extensions, disulphide bridges, secondary structure within loops, or intra-molecular interactions can serve as predictors for the presence of certain structural features observed in the crystal structures. Residues capable of kinking or bending helices such as prolines, glycines or certain serines and threonines should be identified as well (Worth, Kleinau, & Krause, 2009).
As shown by the alignments displayed in Figure 2, GPR3 shares many structural commonalities with the cannabinoids and the lysophopholipid receptors diverging from most class A GPCRs in the absence of helix kinking proline residues in TMH2 (2.58 or 2.59, Figure 2B) and TMH5 (5.50, Figure 2F). These lipid receptors are also characterized by the absence of a disulfide bridge between the EC2 loop and the conserved C3.25 at the EC end of TMH3 (seen in Rho, β2-AR, and μ-OR in Figure 2C and E). Instead, GPR3, CB1, CB2, S1PR1, and LPAR1 have an internal disulfide bridge at the EC2 loop (Figure 2E) and conserved A/GW motif at the EC end of TMH4 in addition to an aromatic residue at position 5.39 that forms an aromatic stacking interaction with W4.64 in that motif.
Therefore, GPR3, the cannabinoids and the lysophospholipid receptors S1P1 and LPA1 share specific structural features and lack distinct motifs when compared to other receptors such as Rho, μ-OR and β2-AR. Among the crystal structures available for these lipid receptors, the CB1 crystal structures [PDB ID: 5TGZ (Hua et al., 2016) and 5U09 (Shao et al., 2016)] were not considered since the recently published crystal structures display crystal packing issues that impact the upper portion of the binding pocket. In these crystals, the CB1 structures show the proximal N-terminus invading the receptor binding pocket, steering K3.28 away from binding crevice. This contradicts mutation data from multiple labs that showed that K3.28 is a key site of interaction for numerous cannabinoid ligands (Bonner, Song, & Bonner, 1996; Chin, Lucas-Lenard, Abadji, & Kendall, 1998; Hurst et al., 2002b; Lin et al., 2008; Pan, Ikeda, & Lewis, 1998).
Systematically comparing GPR3 with S1PR1 and LPAR1, we have observed that additional specific structural features are shared by GPR3 and S1PR1, but not by LPAR1. As an example of some of these structural divergences with LPAR1, in Figure 2 we can see that S1PR1 and GPR3 share the EN motif at positions 1.49 and 1.50, whereas LPAR1 has an alanine instead of an acidic residue next to the highly conserved N1.50. In addition, LPAR1 presents a disulfide bridge between a cysteine in the EC2 loop (C190) and a cysteine in the N-terminus (C24) but GPR3 and S1PR1 do not have this bridge. The physicochemical properties of residues at certain key positions such as 6.30 (a polar residue in S1PR1 and GPR3, and a hydrophobic amino acid in LPAR1) also indicate higher similarities of S1PR1 with GPR3.
As a result of this analysis, the S1PR1 crystal structure was selected as the optimal template for building a GPR3 homology model.
4. MODEL DEVELOPMENT
Once the template has been chosen the steps detailed in the next sections should be pursued for the construction of an accurate GPCR homology model.
4.1 Mutating the crystal structure template
The first step in the development of a homology model is the mutation of the amino acids in the template GPCR crystal structure to the corresponding residues in the targeted sequence.
In 2012, the X-ray crystal structure at 2.8 Å resolution of the S1P1 receptor fused to T4-lysozyme in complex with an antagonist sphingolipid mimic was published (Hanson et al., 2012). As previously mentioned GPR3 has considerable sequence similarity and shares several structural features with the S1P1 receptor. This includes the absence of helix kinking proline residues in TMH2 and TMH5, and an internal disulfide bridge in the EC2 loop. Therefore, we developed a computer model of the GPR3 inactive state based on this available X-ray crystal data.
The structure of the inactive state of the S1PR1 was downloaded from protein data bank (PDB-ID: 3V2Y) and mutated to the corresponding GPR3 human sequence using the building tools available in Maestro (Schrödinger 2016). Mutated receptors often present steric clashes and structural artifacts caused by unphysical overlap of newly positioned side-chain atoms with other side-chain and backbone atoms. Consequently, certain residues in the bundle need to undergo concerted conformational changes in their side-chain rotamers. These side-chain dihedral modifications (changes in the χ dihedrals) should take into account the common side-chain rotamers found in transmembrane proteins (Chamberlain & Bowie, 2004; Gainza, Roberts, & Donald, 2012). Deletion or insertion of residues at specific positions might be needed; these regions will require careful minimization and remodeling to ensure the correct continuity of the protein chain (further procedure details in section 4.4). When transitioning from the template to the targeted sequence, some small to large amino acid mutations in the core will require backbone perturbations to accommodate bulkier residues while retaining optimal packing in the core. These backbone modifications will be undertaken in next steps.
4.2 Appreciating the effect of sequence deviations
Once the template has been mutated to the sequence of the targeted GPCR, localized regions where the structure of these receptors may diverge should be identified. In certain segments of the GPCR alternate structural features could support similar α-helical deviations (Ballesteros, Shi, & Javitch, 2001). However, in other domains the presence or absence of specific helix deforming residues such as prolines can determine a particular helix shape. Prolines in transmembrane regions will induce a combination of bend, wobble, and face shift changes in the i to i-4 α-helical phi psi dihedral values (Visiers, Braunheim, & Weinstein, 2000). The position of the helical kinks and the kink angles can be calculated using ProKink (Visiers et al., 2000) through Simulaid (http://www.inka.-mssm.edu/~mezei/simulaid/). The proline kink angle is defined as the angle between the helical axes of the two parts of the helix divided by the proline. The program also measures the wobble angle and the face shift. The wobble angle defines the orientation of the post-proline helix, related to the pre-proline helix, while the face shift measures the distortion that causes a twisting of the helix face modifying the internal rearrangement of amino acids (Visiers et al., 2000).
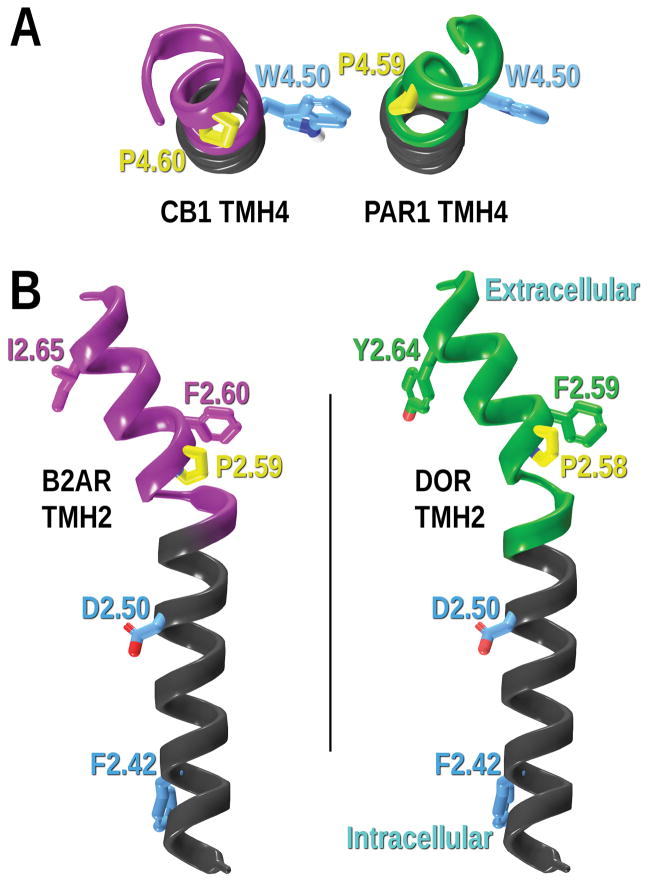
One example of the effect of a proline position shift by one residue is the comparison of TMH4 in CB1 (Shao et al., 2016) versus the PAR1 (Zhang et al., 2012) crystal structure (see Figure 4A). Here the placement of the proline at P4.60 or P4.59 clearly changes the wobble angle of the helix. The directionality of the helix past the proline in TMH4 of CB1 (Shao et al., 2016) is very different from that of the PAR1 (Zhang et al., 2012) crystal structure because of the wobble angle change induced by the shift in proline position. Another striking example of the effect of a shift of a proline position by one residue is the comparison of TMH2 between the β2-AR, and the delta Opioid Receptor (δ-OR). Crystal structures of the inactive state for both receptors are found [β2-AR (Cherezov et al., 2007), and δ-OR (Fenalti et al., 2014)]. Figure 4B shows a side by side comparison of TMH2 from each receptor. The intracellular portion of TMH2 before the proline kink, with residues F2.42 and D2.50 shown for clarity, is found in both structures to have residues facing in the same direction and located in generally the same three dimensional space. β2-AR P2.59, on the left side of Figure 4B, has a large underwound proline kink face shift, and in comparison, δ-OR P2.58, on the right side of Figure 4B, has a large overwound proline kink face shift. The bend angle and wobble angle for both helices are very similar, however, the residues found in the same three-dimensional space after the proline kink, are shifted in space. β2-AR I2.65 is found occupying the same position in space that the δ-OR Y2.64 occupies. It is notable that both sequences have a phenylalanine residue immediately after the proline, β2-AR F2.60 and δ-OR F2.59, and both clearly occupy similar space between the structures. Therefore, it is very important to choose a crystal structure template that has prolines in the same position as the targeted sequence.
Figure 4.
Proline kink induced changes in transmembrane helices. A) TMH4 of CB1 (PDB-ID: 5U09) and PAR1 (PDB-ID: 3VW7) inactive state crystal structures showing that the proline kink induced by P4.60 vs. P4.59 respectively. Here the wobble angles of TMH4 are quite different. B) TMH2 of β2-AR (PDB-ID: 2HR1) and δ-OR (PDB-ID: 4N6H) inactive state crystal structures are shown here. The proline kink induced by P2.59 vs. P2.58 results in a face shift.
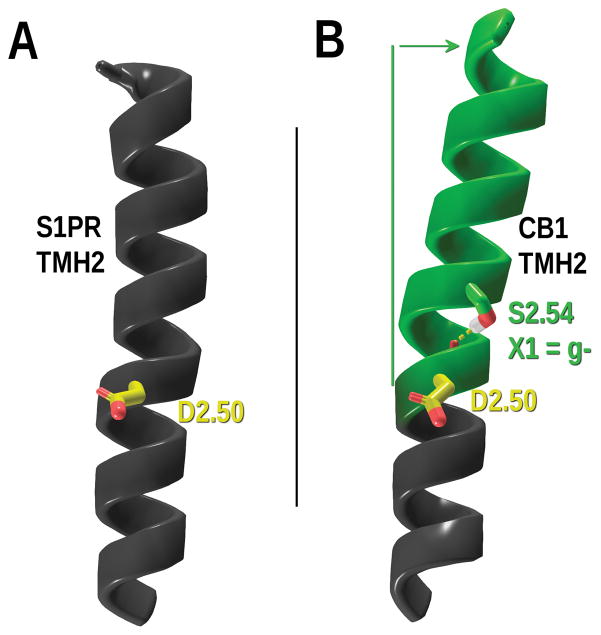
Besides the well-studied kinks induced by prolines in transmembrane helices (Cordes, Bright, & Sansom, 2002; Kim & Kang, 1999; Perálvarez-Marín, Bourdelande, Querol, & Padrós, 2006; Williams & Deber, 1991; Yohannan, Faham, Yang, Whitelegge, & Bowie, 2004), other residues such as glycines, or serines and threonines in specific conformations can also cause structural distortions. As demonstrated by Ballesteros and coworkers, (Ballesteros, Deupi, Olivella, Haaksma, & Pardo, 2000; Deupi et al., 2004) serines and threonines can bend helices when their χ1 dihedral is in a g− (+60°) conformation. They can therefore act as hinge residues affecting the conformation of an α-helix inducing an intrahelical hydrogen bond between the side chain oxygen atom of the serine or threonine in the aforementioned conformation and the i-3 or i-4 carbonyl oxygen of the helix backbone. An example of this structural feature can be found in the CB1 crystal structure CB1 (Hua et al., 2016; Shao et al., 2016). Figure 5 compares TMH2 of S1PR1 (Hanson et al., 2012), which has a glycine at position 2.54, with CB1, which has a serine at position 2.54. In CB1, S2.54 in its χ1 g− conformation induces a bend in the helix (see green arrow in Figure 5), whereas G2.54 does not induce α-helical distortions in S1PR1 TMH2. The TMH bend in CB1 TMH2 is produced by S2.54 adopting a g− χ1. The analogous bend was previously identified and analyzed in CB2 by molecular modeling studies (Zhang et al., 2005).
Figure 5.
TMH2 of the (A) S1PR1 (PDB-ID: 3V2Y) and (B) CB1 (PDB-ID: 5U09) inactive state crystal structures. The CB1 S2.54 in its χ1 g− conformation induces helical distortion (deviation showed in green ribbons and green arrow). The conserved residue 2.50 (i-4 to S2.54) is shown as a reference.
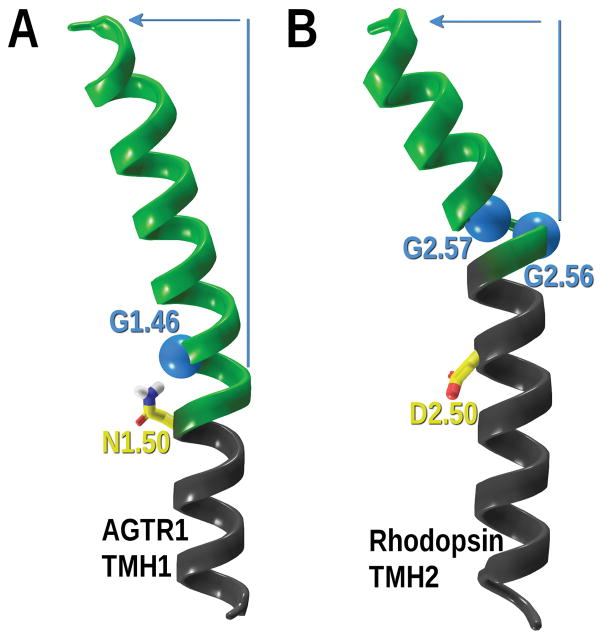
Moreover, glycines can also preclude normal α-helix geometry since they confer additional flexibility to a given region in some cases generating helix distortions (Curran & Engelman, 2003; Deupi et al., 2007; Hall, Roberts, & Vaidehi, 2009). Two cases of these helical distortions induced by glycines are illustrated in Figure 6. On the left panel (Figure 6A) the angiotensin 1 receptor TMH1 is shown with the hinge glycine, G1.46, highlighted in blue (C-alpha carbon in a light blue Van der Waals sphere). The glycine is on the inside of the bend in TMH1 and faces in towards the binding crevice. In this receptor, the N-terminus is linked via a disulfide bridge to the top of TMH7 adding structural restriction between the top of TMH1 and the top of TMH7. Since the loop has few residues, G1.46 provides the hinge that helps TMH1 to lean in towards TMH7. On the right panel (Figure 6B), the rhodopsin receptor TMH2 is shown with both G2.56 and G2.57 inducing an underwound turn and bend. The two sequential glycines form a GG motif, which allows disruption of standard α-helical phi/psi dihedral values due to the inherent flexibility of a residue having no sidechain steric bulk. The glycines do not face the binding crevice, G2.56 is facing lipid and G2.57 is in the TMH2/3 interface.
Figure 6.
Helical distortions induced by glycines. A) The angiotensin 1 receptor TMH1 is shown with G1.46 C-alpha carbon highlighted in a light blue Van der Waals sphere. N1.50, the most conserved residue in TMH1, and always facing in towards the binding crevice is shown for clarity. B) The rhodopsin receptor TMH2 GG motif (G2.56 and G2.57) is shown. Both glycine C-alpha carbons are shown in light blue Van der Waals spheres. D2.50, the most conserved residue in TMH2 and always facing in towards the binding crevice, is shown for clarity. The overall deviation induced by glycines is depicted in green ribbons and blue arrow.
4.2.1 Calculating a new TMH Conformation with Conformational Memories
If there is no crystal structure that has identical placement of all helix deforming residues with your receptor of interest, one can calculate a conformation for subject helices. For this purpose, we use the Conformational Memories (CM) method. The CM technique explores the possible low-free energy conformations for a helix of interest through Monte Carlo/simulated annealing random walks using the CHARMM (Chemistry at HARvard Molecular Mechanics) force field. This method, developed by Guarnieri and collaborators, efficiently explores dihedral conformational space of a given molecule (transmembrane helix in this case), independently of the initial conformation (Guarnieri & Weinstein, 1996; Guarnieri & Wilson, 1995). Conformational Memories combines Monte Carlo exploration of the dihedral angle space with simulated annealing to define the range of values that each dihedral angle is capable of exploring in a broad temperature range. The possibility to vary bond angles in addition to dihedral angles was also implemented in the CM method (Whitnell, Hurst, Reggio, & Guarnieri, 2007).
In our established protocol, we start from an ideal transmembrabe helix with backbone dihedrals set to the standard φ (−62.9°) and ψ (−41.6°) values. Helix ends are capped using the protein preparation wizard integrated in the Maestro software (Schrödinger 2016). The coordinate input file for CM needs to be converted to CHARMM nomenclature. Backbone φ and ψ torsions in regions of interest (i to i – 4 of a hinge residue) are allowed to vary by ±50°, while all other backbone torsion angles are allowed to vary by ±10°. Side chain torsions are allowed to vary by ±180° and bond angles are allowed to vary by ±8° except for C–S–C angles that are allowed to vary by ±15°. A minimum set of 108 conformers are generated for each helix, independently, in a distance-dependent dielectric at 310 K.
4.2.2 Calculating a new TMH7 Conformation in GPR3
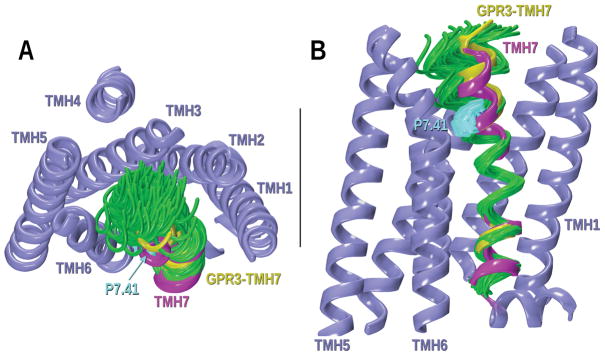
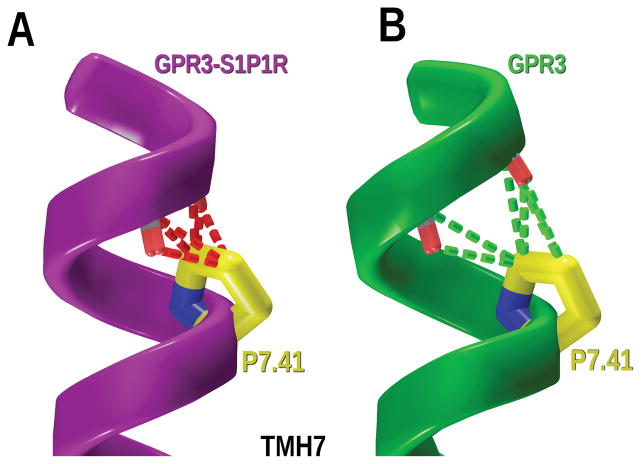
The CM technique was used to study the conformations of the GPR3 helices with important sequences divergences from the template structure. While TMH7 in GPR3 shares the NPXXY motif with TMH7 of S1PR1, TMH7 in GPR3 also has a proline at position 7.41 that is not found in S1PR1 or in any other crystal structure. TMH7 of the S1PR1 crystal structure was mutated to the GPR3 sequence and the region containing the proline and four residues prior to the proline (i to i–4, P7.41–L7.37) was studied with CM, considering P7.41-L7.37 to be the hinge region. The output conformers obtained in this study were superimposed on the corresponding TMH7 in the S1PR1 template that had been mutated to the sequence of the GPR3. As displayed in Figure 7, P7.41 creates an inwards kink of helix 7 towards the binding crevice. Among the low free energy conformers obtained, the helix highlighted in yellow was selected for inclusion in the revised GPR3 bundle, because it fit in the bundle without van der Waals overlaps with residues on other TMHs. Figure 8A shows the steric clashes generated by P7.41 in the GPR3 mutated S1PR1 crystal structure with the helix backbone in the i to i-4 region. In contrast, Figure 8B displays van der Waals interactions (no steric overlaps) of P7.41 in the CM conformer selected for GPR3–TMH7 with the backbone of residues in the proline kink.
Figure 7.
CM results for the GPR3-TMH7 study of possible helix deformation created by P7.41. A) Extracellular view of the bundle; B) Lipid view. Conformers have been superimposed at their intracellular ends. The magenta TMH7 corresponds to the S1PR1 crystal structure that was mutated to the GPR3 sequence. In green, some of the low free energy conformers obtained from CM are illustrated. Other TMHs in the bundle are colored in steel blue. The chosen TMH7 for the GPR3 homology model is highlighted in yellow.
Figure 8.
(A) The steric overlap (dash red lines) generated in TMH7 by P7.41 if TMH7 is simply mutated from the S1PR1 crystal structure TMH7 to the GPR3 sequence. (B) After CM calculations on GPR3 TMH7, there are no steric clashes with the backbone. Green dash lines represent good van der Waals interactions between P7.41 and TMH7.
ProKink (Visiers et al., 2000) was used to determine the helical kink induced by proline 7.41 with an input range of seven residues around the kink center. The TMH7 chosen for substitution into the TMH bundle from our Conformational Memories calculations has a helix bend angle of 12.4°, a wobble angle of −54.8°, and face shift of 61.2°.
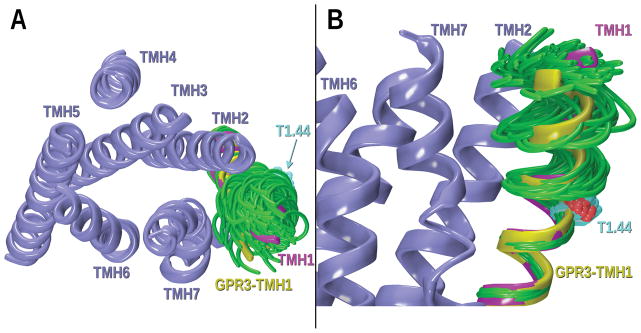
In addition, TMH1 in GPR3 has a SGT motif (1.42–1.44) not present in the template structure (see alignment, Figure 2A). The threonine on that motif, T1.44, is facing lipid and therefore, as previously detailed, it could bend the helix in its χ1 dihedral g− conformation. To explore this hypothesis, the possible conformations caused by this hinge residue in that particular side chain conformation were studied with CM. In the GPR3 mutated TMH1, T1.44 to C1.40 was considered the hinge region. The results indicate that T1.44 in a g− χ1 dihedral can form an intrahelical hydrogen bond with the backbone carbonyl oxygen of C1.40 producing an alteration from normal α-helicity in GPR3 TMH1. As shown in Figure 9, the helix in yellow was chosen since it fits in the bundle with no van der Waals overlaps with residues on other TMHs. The chosen helix (Figure 9) is bent outwards and towards TMH7 but preserving the portal present in the template crystal structure.
Figure 9.
CM results for the GPR3-TMH1 study of possible helix deformation created by T1.44 (χ1 dihedral: +60°). A) Extracellular view of the bundle; B) Lipid view. TMH1 conformers have been superimposed at their intracellular ends. The magenta TMH1 corresponds to the S1PR1 crystal structure that was mutated to the GPR3 sequence. In green, some of the low free energy TMH1 conformers obtained from CM are illustrated. Other TMHs in the bundle are colored in steel blue. The TMH1 conformer chosen for inclusion in the GPR3 homology model is highlighted in yellow.
The appropriate helices chosen from Conformational Memories were incorporated into the GPR3 TMH bundle model.
4.3 Loop Modeling
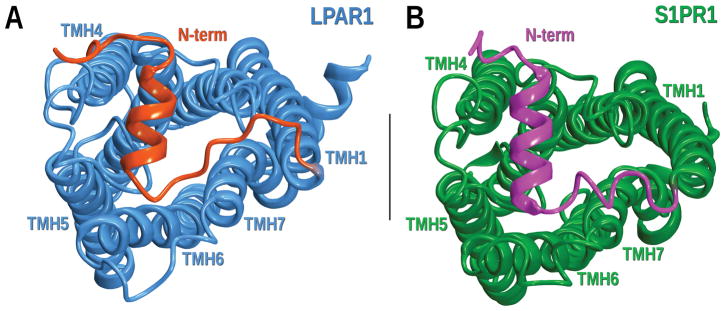
Although many GPCR homology models in the past have been focused on the transmembrane bundle, assuming that ligand interactions occur only in this helical region, GPCR crystal evidence from the last several years has led us to reconsider the importance of the loops. Current X-ray data indicates that the extracellular loops can contribute to ligand binding (Chrencik et al., 2015; Hanson et al., 2012), whereas the intracellular loops (particularly the IC-2 loop) are directly involved in promoting the complex with intracellular signaling partners (Chakraborty et al., 2013; Kang et al., 2015a; Mnpotra et al., 2014; Rasmussen et al., 2011; Zhou, Yan, Yamamoto, & Tai, 1999). In addition, the N- and the C-termini also play important roles in GPCR pharmacology. As elucidated by the crystal structures of S1PR1 and LPAR1, the N-terminus of lipid receptors can cover the extracellular region occluding access to ligands, which may enter to the binding crevice from within the membrane bilayer through a membrane portal (Chrencik et al., 2015; Hanson et al., 2012; Hurst et al., 2010; Mnpotra et al., 2014) (see Figure 10). In both the S1PR1 and LPAR1 structures, residues from the N-terminus point towards the binding crevice and are directly interacting with the co-crystallized ligand. On the other hand, the C-terminus plays an important role in receptor desensitization, internalization and in G-protein independent β-arrestin signaling by complexing with β-arrestin (Nobles et al., 2011; Okuno, Yokomizo, Hori, Miyano, & Shimizu, 2005).
Figure 10.
Extracellular view of LPAR1 and S1PR1 crystal structures. A) In LPAR1 (PDB ID: 4Z35) the TMHs and the EC loops are colored in blue while the N-terminus is highlighted in red. B) S1PR1 (PDB ID: 3V2Y) displays the TMHs and the EC loops in green and the N-terminus in magenta.
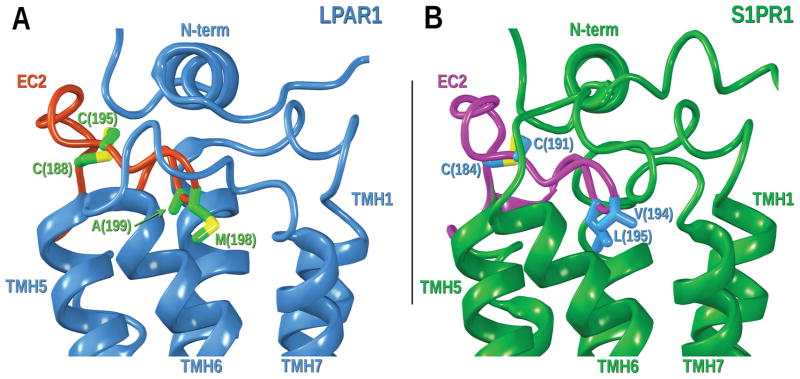
The loop regions of GPCRs are less conserved than the TM domains and in some cases are structurally diverse in the available GPCR structures. Consequently, comparative modelling of these regions is a more difficult challenge than for the TM portions. Despite this structural diversity, some common sequence motifs in critical areas from related receptors may help elucidate similar protein secondary structure. For example, the GPR3 EC2 loop displays the CX6CX4P motif that is present in other receptors such as S1PR1, LPAR1 and CB1 (see Figure 2E). Therefore, the EC2 loop of GPR3 may have a similar topology with the two cysteine residues in an internal disulfide bridge. This is in contrast to most class A GPCRs that have a disulfide bridge between a residue in the EC-2 loop and C3.25 near the top of TMH3. In addition to the internal disulfide bridge, the EC2 loop in S1PR1 and LPA1 crystal structures revealed that the third and fourth residues after the last cysteine in the disulfide bridge points down into the binding crevice (see Figure 11). These structural similarities need to be taken into account for modeling the GPR3 loops.
Figure 11.
Lipid view of the EC2 loop of LPAR1 and S1PR1 crystal structures. A) LPAR1 (PDB ID: 4Z35), TMHs, N-terminus, EC1 and EC3 loops are colored in blue; the EC2 loop is highlighted in red. Residues in the EC2 internal disulfide bridge (C188 and C195) and residues pointing down (M198 and A199) are displayed in green. B) S1PR1 (PDB ID: 3V2Y) TMHs, N-terminus, EC1 and EC3 loops are colored in dark green; the EC2 loop is highlighted in magenta. Residues in the EC2 internal disulfide bridge (C184 and C191) and residues pointing down (V194 and L195) are displayed in blue.
Different approaches can be pursued in order to add loop segments to the transmembrane bundle. In the last decades, several programs and algorithms have been described for protein loop prediction (Crooks, Minh, & Chodera, 2012; Fiser, Kinh Gian Do, & Sali, 2000; Goldfeld & Friesner, 2013; Goldfeld, Zhu, Beuming, & Friesner, 2013; Mehler, Periole, Hassan, & Weinstein, 2002; Šali & Blundell, 1993). In our case, the loops and N- and C-termini were added manually in Maestro (Schrödinger Inc., Portland, OR) to the TMH bundle and Modeller was used to refine loop conformations (Fiser et al., 2000; Šali & Blundell, 1993). Modeller is a Monte Carlo technique based on the use of a repository template library of potential side chain conformations from the Protein Data Bank. By using the CHARMM force field, the program varies each loop and assigns an objective function ranking value. The objective function is based on steric interactions and hydrogen bonding of each possible conformation. The 500 loops with the lowest objective function are used for further analysis.
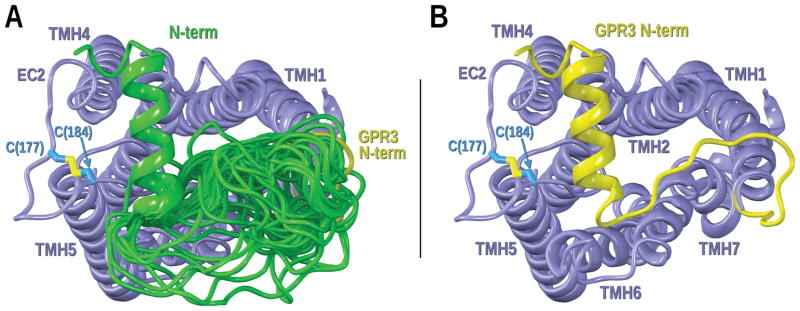
The loops were varied in the presence of the TM receptor region. Because of their close spatial proximity, the conformations of the EC loops and the N-terminus are calculated together. The same was done for IC loops. Restraints were added on the EC2 loop when performing Modeller calculations so that the conserved disulfide bridge between C177 and C184 was intact as seen in the crystal structures. Additionally, the file was set up so that a portion of the GPR3 N-terminus is helical (A14 to G25) as shown by S1PR1 and LPAR1 crystal structures. As previously mentioned, a loop was selected that had the third and fourth residues (V187 and Y188) after the last cysteine in the internal disulfide bridge pointing down into the binding crevice. This loop was carefully chosen taking into account a similar overall topology, determined by its sequence, with crystallized lipid receptors. Figure 12 displays Modeller results for the calculation of the GPR3-EC2 loop.
Figure 12.
Modeling of the GPR3-EC2 loop. A) EC view of the GPR3 bundle with some of the EC2 loop conformers with lower values of the Modeller objective function superimposed (colored in green). TMHs in the bundle are colored in steel blue. The magenta EC2 loop corresponds to the EC-2 loop conformation in the S1PR1 crystal structure. The chosen EC2 loop for the GPR3 homology model is highlighted in yellow. B) Magenta and yellow EC2 loops displayed for clarity in an EC view of the GPR3 bundle. Residues in the EC2 internal disulfide bridge of S1PR1 (C184 and C191) and residues pointing down (V194 and L195) are displayed in magenta. Residues in the EC2 internal disulfide bridge of GPR3 (C177 and C184) and residues pointing down (V187 and Y188) are displayed in blue. C) Lipid view of the EC2 loop of GPR3.
The selected N-terminus forms hydrophobic patches with different residues in the EC loops. Lacking structural information about the remaining loops, Modeller output was evaluated to ensure that each loop structurally made sense, such as hydrophobic residues close to the lipid bilayer were pointing into the receptor rather than directly positioned in water. Chosen loop conformations are those that produced a low value of the Modeller objective function (see Figure 13). As detailed in the following section, the geometry of the resulting homology model with the loops, N- and C-termini added to the TM bundle is then optimized using the OPLS3 force field in MacroModel 11.3 (Schrödinger Inc., Portland, OR).
Figure 13.
Modeling of the GPR3-N-terminus. A) GPR3 bundle with some of the N-terminus conformers with lower values of the Modeller objective function superimposed (colored in green). TMHs in the bundle are colored in steel blue. The chosen N-terminus for the GPR3 homology model is highlighted in yellow. B) GPR3 bundle with the selected N-terminus is displayed for clarity. Residues in the EC2 internal disulfide bridge (C177 and C184) are displayed in blue.
4.4 Energy Minimization
The homology model obtained after the addition of the loops to the TMH bundle needs to be optimized using the appropriate electrostatic treatment. For this purpose, we use the MacroModel 11.3 package that is integrated in the Maestro software (Schrödinger Inc., Portland, OR). This program combines high-quality force fields and Generalized Born/Surface Area (GB/SA) effective solvation model leading to reliably accurate estimations of energies.
The energy of the GPR3 model was minimized using the OPLS3 force field in MacroModel 11.3. The GPR3 model minimization was performed by using a distance-dependent dielectric, 8.0 Å extended non-bonded cutoff (updated every 10 steps), a 20.0 Å electrostatic cutoff, and a 4.0 Å hydrogen bond cutoff in each stage of the calculation. The minimization was performed in two stages. Each stage consisted of a Polak–Ribier conjugate gradient minimization in 1000-step increments until the bundle reached a 0.05 kJ/mol gradient. In the first stage, a harmonic constraint was placed on all the TMH backbone torsions (φ, ψ, and ω); this was done to preserve the general shape of the helices during minimization. In addition, the backbone atoms of the loops were frozen. A distance-dependent dielectric was used for this minimization. In the second stage of the calculation, the TMH bundle was frozen, but the loops were allowed to relax. The GB/SA continuum solvation model for water as implemented in MacroModel was used.
If the transmembrane bundle has been pulled apart in previous steps to enable initial modelling and accommodation of bulky residues, after minimization, the inter-helical contacts, which are conserved across class A GPCRs, should be present in the minimized homology model (Cvicek et al., 2016). For instance, the networks of hydrogen bonds observed among TMH4-2-3 (residues W4.50-S/N/T2.45-S/N/T3.42) and TMH1-2-7 (residues N1.50-D2.50-N7.49). In particular, in GPR3 as well as in other receptors containing E1.49, an interaction between this neutral glutamate and the backbone of TMH7 (7.47) takes place. Contact between TMH3 and 4 can also be observed since the highly conserved bulky residue W4.50 leans on A3.38.
If one is at a preliminary stage in model development with only the TMH bundle built, each helix of the model should be capped as the acetamide at its N-terminus, and as the N-methyl amide at its C-terminus. To account for the lack of a fully hydrated phospholipid bilayer as the receptor environment, all charged residues, those facing outward normally interacting with the phospholipid headgroups, or those facing inward without counterions, need neutralization before minimization of the model. Neutralization can be done by addition of placed water molecules, or by neutralized forms of the amino acids if the force field being used contains them.
4.5 Active vs inactive states
Conformational changes in the receptor and rearrangements at the intracellular domain that accompany ligand binding dictate the signaling pathways initiated by GPCRs. Classically, our understanding of GPCR signaling assumed that the receptor formed one unique active receptor structure in response to agonist binding. However, we currently know that this process is much more complex. Increasing evidence indicates that GPCRs can adopt different active conformations depending on the type of ligand (Venkatakrishnan et al., 2016). Different ligand-dependent GPCR conformations can explain the fact that these receptors can couple to diverse signaling partners such as different G-protein types or non–G-protein effector proteins, such as β-arrestins (Shukla, Singh, & Ghosh, 2014). This ligand-dependent signal transduction is known as biased signaling or functional selectivity and is currently the focus of extensive research. The hope is that such ligands may maximize therapeutic benefits while avoiding undesired effects.
4.5.1 G-protein dependent signaling
The structural features that characterize the GPCR G-protein dependent (G-ProtDep) inactive (R) and active (R*) states have been inferred primarily from biophysical studies of rhodopsin (Choe et al., 2011; Okada et al., 2004; Palczewski et al., 2000), the β2-adrenergic (Cherezov et al., 2007; Rasmussen et al., 2011) and the μ-opioid receptors (Huang et al., 2015; Manglik, Kruse, Kobilka, Thian, Mathiesen, et al., 2012). In the inactive or off state, the intracellular end of TMH6 is bent towards TMH3 and a salt bridge between R3.50 and E/D6.30 on the intracellular side of the TMH bundle forms an “ionic lock”. In the μ-opioid receptor, the “ionic lock” is not at the exact same location (6.30), instead the μ-opioid crystal structure with a morphinan antagonist shows a strong hydrogen bond between R3.50 and T6.34 (Manglik, Kruse, Kobilka, Thian, Mathiesen, et al., 2012).
The “ionic lock” bond is enabled by the CWXP motif (common in most class A GPCR) that hinges the IC end of TMH6 toward the IC end of TMH3. The strong interaction of these two residues intracellularly closes the receptor to possible coupling with the α subunit of the G protein. Inside the binding crevice of each class A GPCR there is a set of residues, known as the “toggle switch” that changes conformation upon agonist binding. For many class A GPCRs, these “toggle switch” residues include an amino acid (W/F6.48) in the TMH6 CWXP motif and residues directly interacting with it. Agonist binding trips this toggle switch, producing a conformational change in TMH6 that impacts the IC domain of the receptor. W6.48 has been shown to change its conformational state within the binding pocket upon ligand activation (χ1 g+ → trans). In the inactive state, W6.48 is typically held in its χ1 = g+ conformation by another binding pocket residue. For instance, in the R state of Rho, 11-cis-retinal’s β-ionone ring directly interacts with W6.48, blocking its movement (Li et al., 2004; Okada et al., 2002; Palczewski et al., 2000). Upon receptor activation by light, 11-cis-retinal isomerizes to all-trans-retinal and the β-ionone ring moves away from TMH6 and toward TMH4 freeing the χ1 of W6.48 to undergo a g+ → trans conformational change (Standfuss et al., 2011). This change is transient in some receptors and not seen in every activated GPCR crystal structure. Indeed, such a transient change in W6.48 was observed in molecular dynamics calculations of the CB2 receptor activation by its endogenous ligand (2-arachidonoylglycerol) (Hurst et al., 2010), and the β-2AR-Gs protein complex (Rasmussen et al., 2011).
The results of the W6.48 (χ1 g+ → trans) transition is that TMH6 straightens in the highly conserved CWXP hinge region moving its intracellular end away from the TMH bundle (Farrens, Altenbach, Yang, Hubbell, & Khoranat, 1996; Ghanouni, Steenhuis, Farrens, & Kobilka, 2001; Javitch, Fu, Liapakis, & Chen, 1997; Jensen et al., 2001). This results in the intracellular “ionic lock” breaking as TMH3 and TMH6 move away from each other (Ballesteros et al., 2001). Moreover, the intracellular opening generated in the TMH3-4-5-6 region allows Gα protein insertion into the activated GPCR (Rasmussen et al., 2011).
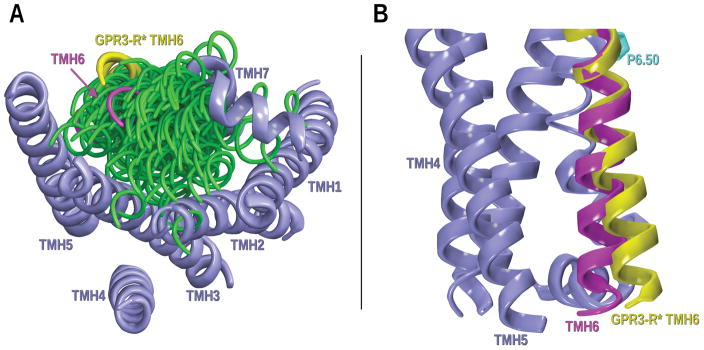
In GPR3, the TMH6 hinge motif sequence is CWLP. In the inactive state model of this receptor, F3.36, F5.47 and W6.48 form an extended toggle switch. The χ1 dihedral angle of W6.48 is g+ and is held in this conformation by F3.36 (χ1 in trans) that at the same time is forming an aromatic stack with F5.47 (χ1 in trans). We hypothesized that these interactions constitute the toggle switch for GPR3. Mutational and computational studies have previously demonstrated that W6.48 and F3.36 are the toggle switch residues in the CB1 receptor (McAllister et al., 2004; Singh et al., 2002). In addition, our GPR3 inactive model has a hydrogen bond between R3.50 and T6.30 that corresponds to the R3.50-D/E6.30 “ionic lock” found in many class A GPCRs. In the GPR3 G-protein active state model, this interaction will be broken allowing TMH6 to straighten, moving its intracellular end away from the TMH bundle. For this reason, it is crucial to explore the conformational space of GPR3 TMH6 to understand the conformational changes that take place at the hinge region. To study the possible conformations for GPR3 TMH6, we used Conformational Memories (Guarnieri & Weinstein, 1996; Guarnieri & Wilson, 1995). The calculation started from the existing inactive state TMH6. The i to i – 4 region around the proline (P6.50–A6.46) was varied using CM.
Figure 14A shows an IC view of the GPR3 TMH bundle with the CM output superimposed on the EC end of TMH6 (6.50–6.58). To build a G-protein active state model, we need to select a TMH6 conformation that pulls away from the TMH bundle and would lead to breaking of the ionic lock. The helix highlighted in yellow in Figure 14 was selected from the CM study since in this conformation the ionic lock is broken; the IC domain of TMH6 is moved away from the bundle opening the IC TMH3-4-5-6 region for the insertion of the Gs protein. This helix was incorporated in the GPR3 active state bundle and was then optimized using the OPLS3 force field in MacroModel 11.3 (Schrödinger Inc., Portland, OR).
Figure 14.
CM results for the GPR3-TMH6 study to identify a TMH6 conformer appropriate for a GPR3 activated state model of G-protein dependent signaling. A) Intracellular view of the bundle; B) Lipid view. Conformers have been superimposed at their extracellular ends. The magenta TMH6 corresponds to TMH6 in our GPR3 inactive state model. In green, some of the free energy conformers obtained from CM. Other TMHs in the bundle are colored in steel blue. The chosen TMH6 for the GPR3 active state model (R*) is highlighted in yellow.
4.5.2 G-protein independent β-arrestin signaling
The conformational hallmarks that accompany GPCR activation for coupling to G-protein are well-understood, however, the structural changes associated with G-protein independent β-arrestin (G-ProtIndep βArr) activation are now emerging in the literature (Kang et al., 2015b; Liu, Horst, Katritch, Stevens, & Wüthrich, 2012; Shukla, Westfield, et al., 2014). Arrestins were initially named for their ability to arrest signaling of heterotrimeric G-proteins. Their role in GPCR desensitization and internalization has been appreciated for some time (Ferguson, 2001). However, we now know that arrestins can also mediate GPCR signaling that is G-protein independent (Nobles et al., 2011). As proposed by Lefkowitz and coworkers, the conformational state of the receptor triggered by a biased ligand can result in a different GRK phosphorylation “bar-code” pattern on the receptor C-terminus that determines whether the β-arrestin’s recruitment is for internalization or for forming a signaling complex (Nobles et al., 2011). A 19F-NMR study reported site-specific conformational changes in the β2-adrenergic receptor associated with G-protein and β-arrestin independent signaling pathways.(Liu et al., 2012) G-protein biased ligands induced conformational changes in TMH3/TMH6, in contrast, β-arrestin biased ligands like carvedilol predominantly impacted TMH7 conformational states. In another study, Rahmeh and co-workers reported similar findings for the arginine-vasopressin type 2 receptor using a β-arrestin biased and a Gs biased ligand. They also concluded that conformational changes of TMH6-IC3 loop are associated with G-protein signaling, whereas changes in TMH7-Hx8 domains are associated with G-ProtIndep β-Arr signaling (Rahmeh et al., 2012). Therefore, a key factor in the design of β-arrestin biased ligands would be that each derivative should block the movement of the TMH7-Hx8 elbow region by holding TMHs 2 and 7, while not affecting the G protein toggle switch. A schematic representation of overall movements in TMHs 6 and 7 in G-ProtDep and G-ProtIndep β-Arr is depicted in Figure 15.
Figure 15.
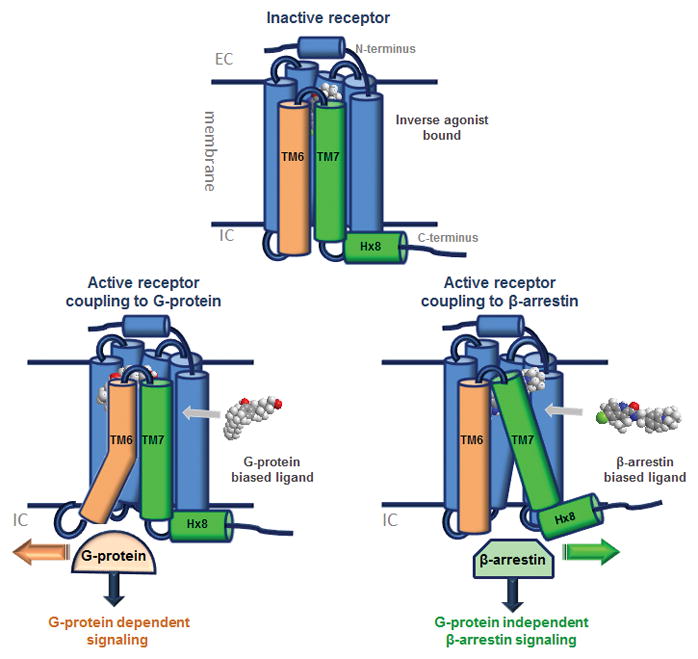
Schematic representation showing conformational changes at the IC domain of a GPCR. Inactive state (up), active states (down): G-ProtDep signaling (left), and G-ProtIndep βArr signaling (right).
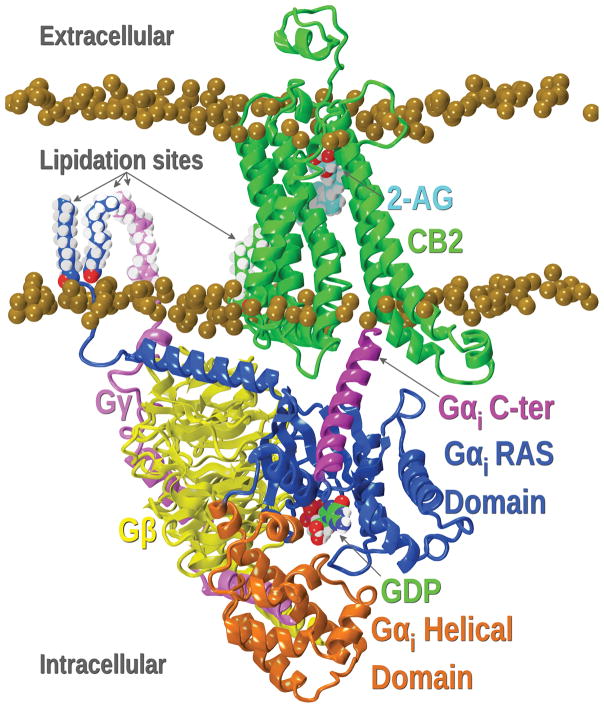
The GPCR-binding interface for G proteins has been extensively studied whereas β-arrestin-GPCR complexes are poorly understood. As shown in different studies, the flexibility of the Gα protein allows it to rapidly enter the binding crevice, and after a process of mutual conformational adaptation, both the Gα protein and the cytoplasmic crevice of the receptor gain a well-defined structure (Shukla, Xiao, & Lefkowitz, 2011; Szczepek et al., 2014). As an example, the CB2-G protein complex previously published by our group is illustrated in Figure 16 (Mnpotra et al., 2014).
Figure 16.
CB2-G protein with 2-AG complex. The CB2 receptor is shown in green while the different domains of the G protein are highlighted in different colors as detailed in the figure. Lipidation sites shown on the G-protein trimer anchor the protein to the bilayer. The palmitoylation site on CB2 is shown with green carbons.
Recent data indicates that arrestins partially mimic this process (Szczepek et al., 2014). The finger loop of this effector protein is highly flexible (Bourquard et al., 2015; Lee et al., 2016; Nobles et al., 2011; Shukla et al., 2011; Szczepek et al., 2014), and interaction with the binding crevice of the receptor induces structuring in the form of a reverse turn. The first structural characterization of a β-arrestin-GPCR complex (arrestin-rhodopsin) has been lately released shedding light on the interaction interface (Kang et al., 2015b). However, this is the complex formed when β-arrestin is called for internalization and insertion is in the opening created for G-protein signaling. The complex formed for beta-arrestin biased signaling is yet to be determined, but should involve insertion in the opening created when TMH7-Hx8 move away from the bundle. It also should be noted that both β-arrestin-1 and β-arrestin-2 have been implicated in G-protein independent β-arrestin signaling, with a receptor choosing one of these for signaling. In CB1, the G-protein independent β-arrestin signaling produced by ORG27569, is mediated by β-arrestin-1 (Ahn, Mahmoud, Shim, & Kendall, 2013). For GPR3, the G-protein independent β-arrestin signaling appears to be via β-arrestin-2 (Thathiah et al., 2013).
Even though we have not created yet a GPR3 active G-ProtIndep β-Arr state, because of its therapeutic potential in AD (Huang et al., 2015; Thathiah et al., 2009, 2013), we are highly interested in the design of GPR3 β-arrestin biased inverse agonists. A key factor in the design of these ligands is that each derivative should block the movement of the TMH7-Hx8 elbow region by holding helixes 2 and 7, while not affecting the G-protein toggle switch.
5. DOCKING STUDIES
The ultimate goal of developing a GPCR homology model is the design of potent and efficient ligands that can maximize therapeutic benefits. For that purpose, molecular docking is a very valuable structure-based drug design technique essential in hit-to-lead and lead optimization drug discovery phases. Using docking studies, we can rationalize ligand-receptor interactions in the binding site, understanding the structural features underlying a particular pharmacological effect. It is very important to take into account how a particular ligand modulates the targeted GPCR before performing docking studies. Inverse agonists are compounds that can turn off constitutive signalling by returning a receptor to its inactive state, whereas agonists stabilize the active state of the receptor allowing the GPCR to couple with the corresponding effector protein. Therefore, each ligand should be docked in the corresponding R or R* state model according to the structural basis detailed in the previous section.
Before docking a specific molecule, a conformational analysis of the compound needs to be accomplished. For this purpose, we perform complete conformational analyses of the structures to dock using the OPLS3 force field and the Mixed Torsional Low Mode Sampling Monte Carlo Conformational Search in Macromodel 11.3 (Schrödinger, LLC, NY 2016). This method uses a combination of the random changes in torsion angles and/or molecular position from the MCMM method, together with the low-mode steps from the LMOD method, based on the principles of saddle-point searching used in pure low-mode. In each conformer search, local energy minima are identified by rotation of a subject torsion angle through 360° in 60° increments (6-fold search). These conformers are then minimized using ab initio Hartree–Fock (HF) calculations at the 6-31G* basis set level as encoded in Spartan’08 (Wave function, Inc., Irvine CA). The global minimum energy conformer of each compound is then used as input for receptor docking studies. To calculate the energy difference between the global minimal energy conformer of each compound and its final docked conformation, rotatable bonds in the global minimal energy conformer are driven to their corresponding value in the final docked conformation and the single-point energy of the resultant structure is calculated at the HF6-31G* level.
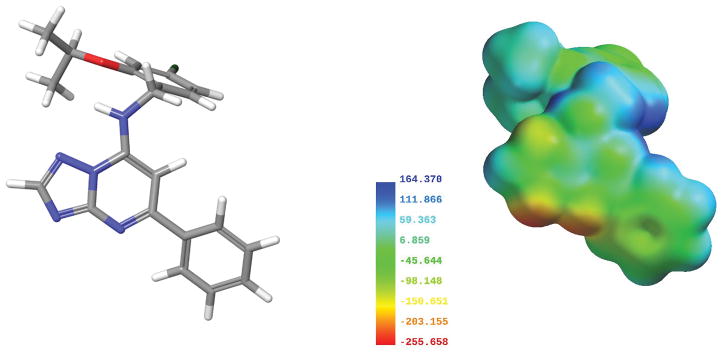
It is also very useful to perform electrostatic potential map calculations of lowest-energy conformation of each ligand to visualize the hot-spots of electron density on the molecule that could be susceptible for interactions with specific residues in the binding crevice. To calculate these electrostatic potential density surfaces we use Spartan ’08 (Wave function, Inc.). The electrostatic potential energy is calculated using the ab initio HF 6-31G* level of theory and is mapped on the 0.002 isodensity surface of each molecule.
The lowest-energy conformation of each ligand can be manually docked in the appropriate state model. Before performing docking studies, some bundles need to be pulled apart 1 or 2 Å in order to fit the corresponding ligands. Binding site anchoring interactions within the receptor for each ligand should be consistent with mutational and SAR (structure-activity relationships) data. Once the ligand is positioned adequately in the binding crevice, initial steric clashes can be removed manually with interactive graphics. After that, we minimize the ligand–receptor complex, including loop regions, using the OPLS3 force field in Macromodel version 11.3 (Schrödinger Inc.) in two stages following the procedure described in section 4.4. No constraints are normally placed on the ligands during this process.
In parallel to manual docking, we use the automatic docking program, Glide version 7.2 (Schrödinger Inc.), to explore other possible receptor binding modes for each compound. Glide is used to generate a grid based upon the centroid of select residues in the binding site (e.g., from the manual dock). The grid defines the region in which Glide is allowed to attempt to dock ligands. The grid dimensions were 26 Å × 26 Å × 26 Å; this grid size allows Glide to thoroughly explore the receptor for possible binding sites. Other than the requirement that ligands must be docked within the grid, no constraints are used. Standard precision (SP) is selected for the docking setup. The receptor and ligand van der Waals radii are set to the default value of 0.80, and the maximal number poses to be produced is also set to 1000.
The interaction energies of each docking can be calculated to analyze which residues contribute more to the ligand-receptor complex. The atoms of each ligand need to be defined as one group (group 1) and the atoms corresponding to a residue that lines the binding site in the final ligand–GPCR complex is defined as another group (group 2). Macromodel version 8.6 (Schrödinger, can be used to output LLC, New York, the pair interaction energy (CoulombicNY) and van der Waals) for a given pair of atoms. In order to yield the energy of interaction between the ligand and that residue, the pairs corresponding to group 1 (ligand) and group 2 (residue of interest) are summed. The total of the interaction energies for all residues in the binding site are summed with the conformational cost for the ligand to assume its conformation in the final complex. This sum will yield the total interaction energy for each ligand–GPCR complex.
GPR3 Docking Studies
Very few ligands have been reported to modulate GPR3. Particularly, sphingosine-1-phosphate (S1P) (Kostenis, 2004; Uhlenbrock, Gassenhuber, & Kostenis, 2002) and diphenyleneiodonium chloride (DPI) (Ye et al., 2014) have been proposed to be GPR3 agonists. However, other research groups have not seen activation with S1P (Thathiah et al., 2009; Valverde et al., 2009; Yin et al., 2009). We were also unable to confirm GPR3 agonism for either S1P or DPI in preliminary studies. The triazolopyrimidine AF64394 is the only published GPR3 inverse agonist (Jensen et al., 2014). In our hands, this compound behaves as an inverse agonist of both the GPR3 G-protein and β-arrestin signaling pathways. Therefore, we selected this triazolopyrimidine derivative for our docking studies.
Since G-protein antagonists/inverse agonists stabilize the inactive state of the receptor, a key factor in the structural understanding of AF64394 is that it should block the W6.48 (χ1 g+ → trans) transition, thus keeping GPR3 in its inactive state. Direct interaction with the “toggle switch” residues in the GPR3 ligand binding pocket (F3.36/W6.48 for GPR3) will keep W6.48 in its GPR3-R state conformation. In this docking position, AF64394 will also prevent TMH7 from moving away from the bundle by stabilizing the TMH1-2-7 region. This should result in AF64394 acting as an inverse agonists of the β-Arr-2 signaling pathway.
Before AF64394 was docked, a complete conformational analysis was performed following the protocol described above. The global minimum conformer (Figure 17) was used as an input for docking studies. The electrostatic potential map of this lowest-energy AF64394 conformation is shown in Figure 17. The surface is color-coded according to the potential, with electron rich regions colored red and electron poor regions colored blue.
Figure 17.
Molecular electrostatic potential maps of AF64394 (right). Global minimum energy conformer used to calculate the map shown in tube display (left).
Our dock of the global minimum energy conformer of AF64394 in the GPR3 inactive model is illustrated in Figure 18. The triazolopyrimidine core of AF64394 sits up in the binding crevice directly interacting with H2.60. The most electronegative nitrogen of the triazole ring forms a hydrogen bond with H2.60 [H bond (N-N) distance 2.88 Å; (N-H—N) angle, 149°] and the triazole ring forms an aromatic stacking with this same histidine (ring centroid to centroid distance 4.3 Å; angle 84°). The lower phenyl ring sits deeper in the receptor interacting with F6.51 (ring centroid to centroid distance 5.4 Å; angle 69°) and Y188 (ring centroid to centroid distance 58 Å; angle 58°). The 4-chloro-2-isopropoxybenzyl ring stablizes an aromatic stacking interaction with W1.35 (ring centroid to centroid distance 5.9 Å; angle 88°). The Glide Score is −10.1 kcal/mol. This docking is consistent with the SAR previously published (Jensen et al., 2014).
Figure 18.
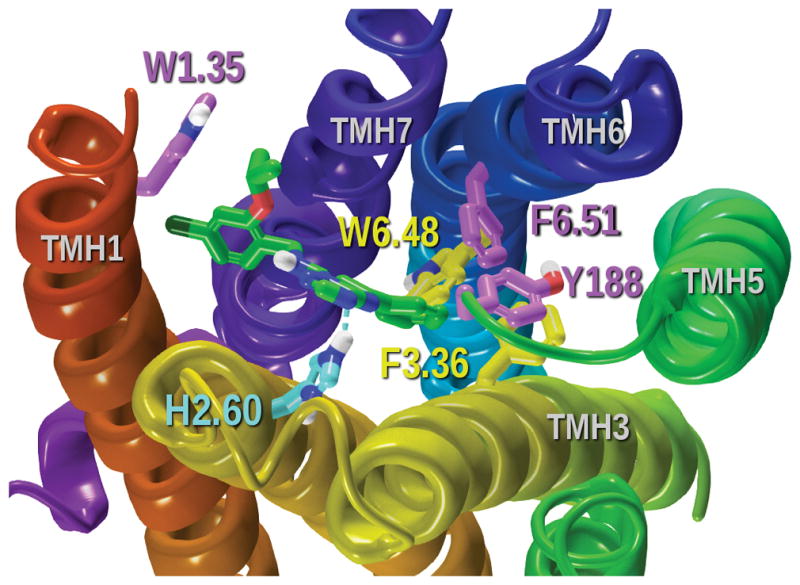
Docking of AF64394 in the GPR3 inactive state model. Residues displayed in tube display are directly interacting with the ligand. The blue dash line represents the hydrogen bond of the ligand with H2.60.
6. MODEL REFINEMENT
Homology models can be used to predict key interactions with specific ligands, as well as, which residues are mainly involved in the receptor function. However, experimental validation and refinement are crucial for the development of an accurate GPCR homology model. Mutation of residues involved in signalling or binding of ligands, as well as site-directed cross-linking should be used to test the model. Moreover, molecular dynamics simulations of the refined model should be performed in the appropriate lipid bilayer to further equilibrate it in a biological environment (Grossfield, 2011; McRobb, Negri, Beuming, & Sherman, 2016).
In the case of GPR3, a previously published structure-activity relationship (Jensen et al., 2014) was important as a first test of the AF64394 binding site identified in our current GPR3 homology model. In addition, the model has been used to design mutations for primary residues that may lead to specific changes in the receptor function or the binding pocket.
These mutations are currently ongoing and they will allow us to refine and improve the model for a better understanding of its physiological function. Design and optimization of GPR3 modulators, along with in silico drug screening will be also accomplished in the refined homology model. All these tools will facilitate the exploitation of this promising therapeutic target for the treatment of different pathologies such as Alzheimer’s disease.
7. SUMMARY
GPCR molecular modelling represents a very valuable tool for understanding biological mechanisms and guiding drug discovery. Even though today there are a wide variety of computational tools, in our opinion, the development of a reliable homology model should consider the features described in this chapter. Structural similarities, the resolution of the X-ray crystals or the presence of mutations and engineered portions need to be evaluated for template selection. The state of the receptor based on the pharmacology of the targeted ligands should also be carefully rationalized. In the refinement and optimization processes, mutagenesis data are also crucial for supporting the role of residues fundamental for interaction with ligands. By addressing all these issues, we can build a fully consistent homology model that may help us understand the complex pharmacology of GPCRs.
References
- Ahn KH, Mahmoud MM, Shim JY, Kendall DA. Distinct roles of β-arrestin 1 and β-arrestin 2 in ORG27569-induced biased signaling and internalization of the cannabinoid receptor 1 (CB1) Journal of Biological Chemistry. 2013;288:9790–9800. doi: 10.1074/jbc.M112.438804. [DOI] [PMC free article] [PubMed] [Google Scholar]
- Ballesteros JA, Jensen AD, Liapakis G, Rasmussen SGF, Shi L, Gether U, Javitch JA. Activation of the β2-Adrenergic Receptor Involves Disruption of an Ionic Lock between the Cytoplasmic Ends of Transmembrane Segments 3 and 6. Journal of Biological Chemistry. 2001;276:29171–29177. doi: 10.1074/jbc.M103747200. [DOI] [PubMed] [Google Scholar]
- Ballesteros JA, Shi L, Javitch J. Structural mimicry in G protein-coupled receptors: implications of the high-resolution structure of rhodopsin for structure-function analysis of rhodopsin-like receptors. Molecular Pharmacology. 2001;60:1–19. [PubMed] [Google Scholar]
- Ballesteros J, Deupi X, Olivella M, Haaksma EEJ, Pardo L. Serine and threonine residues bend α-helices in the χ1= g− conformation. Biophysical Journal. 2000;79:2754–2760. doi: 10.1016/S0006-3495(00)76514-3. [DOI] [PMC free article] [PubMed] [Google Scholar]
- Ballesteros J, Weinstein H. Analysis and refinement of criteria for predicting the structure and relative orientations of transmembranal helical domains. Biophysical Journal. 1992;62:107–109. doi: 10.1016/S0006-3495(92)81794-0. [DOI] [PMC free article] [PubMed] [Google Scholar]
- Ballesteros J, Weinstein H. Integrated methods for the construction of three-dimensional models and computational probing of structure-function relations in G protein-coupled receptors. In: Stuart CS, Acade, editors. Methods in Neurosciences. Vol. 25. San Diego, CA: 1995. pp. 366–428. [Google Scholar]
- Bonner I, Song ZH, Bonner TI. A lysine residue of the cannabinoid receptor is critical for receptor recognition by several agonists but not WIN55212-2. Molecular Pharmacology. 1996;49:891–896. [PubMed] [Google Scholar]
- Bourquard T, Landomiel F, Reiter E, Crépieux P, Ritchie DW, Azé J, Poupon A. Unraveling the molecular architecture of a G protein-coupled receptor/β-arrestin/Erk module complex. Scientific Reports. 2015;5:10760. doi: 10.1038/srep10760. [DOI] [PMC free article] [PubMed] [Google Scholar]
- Bramblett RD, Panu AM, Ballesteros JA, Reggio PH. Construction of a 3D model of the cannabinoid CB1 receptor: Determination of helix ends and helix orientation. Life Sciences. 1995;56:1971–1982. doi: 10.1016/0024-3205(95)00178-9. [DOI] [PubMed] [Google Scholar]
- Chakraborty R, Pydi SP, Gleim S, Bhullar RP, Hwa J, Dakshinamurti S, Chelikani P. New insights into structural determinants for prostanoid thromboxane A2 receptor- and prostacyclin receptor-G protein coupling. Molecular and Cellular Biology. 2013;33:184–193. doi: 10.1128/MCB.00725-12. [DOI] [PMC free article] [PubMed] [Google Scholar]
- Chamberlain AK, Bowie JU. Analysis of side-chain rotamers in transmembrane proteins. Biophysical Journal. 2004;87:3460–3469. doi: 10.1529/biophysj.104.044024. [DOI] [PMC free article] [PubMed] [Google Scholar]
- Cherezov V, Rosenbaum DM, Hanson MA, Rasmussen SGF, Thian FS, Kobilka TS, et al. High-Resolution Crystal Structure of an Engineered Human β2 -Adrenergic. Science. 2007;318:1258–1266. doi: 10.1126/science.1150577. [DOI] [PMC free article] [PubMed] [Google Scholar]
- Chin CN, Lucas-Lenard J, Abadji V, Kendall DA. Ligand binding and modulation of cyclic AMP levels depend on the chemical nature of residue 192 of the human cannabinoid receptor 1. Journal of Neurochemistry. 1998;70:366–373. doi: 10.1046/j.1471-4159.1998.70010366.x. [DOI] [PubMed] [Google Scholar]
- Choe HW, Kim YJ, Park JH, Morizumi T, Pai EF, Krauss N, et al. Crystal structure of metarhodopsin II. Nature. 2011;471:651–655. doi: 10.1038/nature09789. [DOI] [PubMed] [Google Scholar]
- Chrencik JE, Roth CB, Terakado M, Kurata H, Omi R, Kihara Y, et al. Crystal Structure of Antagonist Bound Human Lysophosphatidic Acid Receptor 1. Cell. 2015;161:1633–1643. doi: 10.1016/j.cell.2015.06.002. [DOI] [PMC free article] [PubMed] [Google Scholar]
- Cordes FS, Bright JN, Sansom MSP. Proline-induced distortions of transmembrane helices. Journal of Molecular Biology. 2002;323:951–960. doi: 10.1016/s0022-2836(02)01006-9. [DOI] [PubMed] [Google Scholar]
- Crooks GE, Minh DDL, Chodera JD. Successful prediction of the intra- and extracellular loops of four G-protein-coupled receptors. Proceedings of the National Academy of Sciences. 2012;109:9665–9665. doi: 10.1073/pnas.1016951108. [DOI] [PMC free article] [PubMed] [Google Scholar]
- Curran AR, Engelman DM. Sequence motifs, polar interactions and conformational changes in helical membrane proteins. Current Opinion in Structural Biology. 2003;13:412–417. doi: 10.1016/s0959-440x(03)00102-7. [DOI] [PubMed] [Google Scholar]
- Cvicek V, Goddard WA, Abrol R. Structure-Based Sequence Alignment of the Transmembrane Domains of All Human GPCRs: Phylogenetic, Structural and Functional Implications. PLoS Computational Biology. 2016;12:1–31. doi: 10.1371/journal.pcbi.1004805. [DOI] [PMC free article] [PubMed] [Google Scholar]
- Deupi X, Dölker N, López-Rodríguez ML, Campillo M, Ballesteros JA, Pardo L. Structural models of class a G protein-coupled receptors as a tool for drug design: insights on transmembrane bundle plasticity. Current Topics in Medicinal Chemistry. 2007;7:991–998. doi: 10.2174/156802607780906799. [DOI] [PubMed] [Google Scholar]
- Deupi X, Olivella M, Govaerts C, Ballesteros JA, Campillo M, Pardo L. Ser and Thr residues modulate the conformation of pro-kinked transmembrane alpha-helices. Biophysical Journal. 2004;86:105–115. doi: 10.1016/S0006-3495(04)74088-6. [DOI] [PMC free article] [PubMed] [Google Scholar]
- Eggerickx D, Denef JF, Labbe O, Hayashi Y, Refetoff S, Vassart G, et al. Molecular cloning of an orphan G-protein-coupled receptor that constitutively activates adenylate cyclase. Biochemical Journal. 1995;309:837–843. doi: 10.1042/bj3090837. [DOI] [PMC free article] [PubMed] [Google Scholar]
- Farrens DL, Altenbach C, Yang K, Hubbell WL, Khoranat HG. Requirement of Rigid-Body Motion of Transmembrane Helices for Light Activation of Rhodopsin. Science. 1996;274:768–770. doi: 10.1126/science.274.5288.768. [DOI] [PubMed] [Google Scholar]
- Fenalti G, Giguere PM, Katritch V, Huang XP, Thompson Aa, Cherezov V, et al. Molecular control of δ-opioid receptor signalling. Nature. 2014;506:191–196. doi: 10.1038/nature12944. [DOI] [PMC free article] [PubMed] [Google Scholar]
- Ferguson SSG. Evolving concepts in G protein-coupled receptor endocytosis: The role in receptor desensitization and signaling. Pharmacological Reviews. 2001;53:1–24. [PubMed] [Google Scholar]
- Fiser A, Kinh Gian Do R, Sali Modeling Loops in Protein Structures. Protein Science. 2000;9:1753–1773. doi: 10.1110/ps.9.9.1753. [DOI] [PMC free article] [PubMed] [Google Scholar]
- Fredriksson R, Lagerström MC, Lundin LG, Schiöth HB. The G-protein-coupled receptors in the human genome form five main families. Phylogenetic analysis, paralogon groups, and fingerprints. Molecular Pharmacology. 2003;63:1256–1272. doi: 10.1124/mol.63.6.1256. [DOI] [PubMed] [Google Scholar]
- Fredriksson R, Schio HB. The Repertoire of G-Protein – Coupled Receptors in Fully. Molecular Pharmacology. 2005;67:1414–1425. doi: 10.1124/mol.104.009001. [DOI] [PubMed] [Google Scholar]
- Gainza P, Roberts KE, Donald BR. Protein design using continuous rotamers. PLoS Computational Biology. 2012;8:e1002335. doi: 10.1371/journal.pcbi.1002335. [DOI] [PMC free article] [PubMed] [Google Scholar]
- Ghanouni P, Steenhuis JJ, Farrens DL, Kobilka BK. Agonist-induced conformational changes in the G-protein-coupling domain of the beta 2 adrenergic receptor. Proceedings of the National Academy of Sciences of the United States of America. 2001;98:5997–6002. doi: 10.1073/pnas.101126198. [DOI] [PMC free article] [PubMed] [Google Scholar]
- Godlewski G, Jourdan T, Szanda G, Tam J, Cinar Resat, Harvey-White J, et al. Mice lacking GPR3 receptors display late-onset obese phenotype due to impaired thermogenic function in brown adipose tissue. Scientific Reports. 2015;5:14953. doi: 10.1038/srep14953. [DOI] [PMC free article] [PubMed] [Google Scholar]
- Goldfeld DA, Friesner RA. The protein local optimization program and G-protein-coupled receptors: Loop restoration and applications to homology modeling. Methods in Enzymology. 2013;522:1–20. doi: 10.1016/B978-0-12-407865-9.00001-7. [DOI] [PubMed] [Google Scholar]
- Goldfeld DA, Zhu K, Beuming T, Friesner RA. Loop prediction for a GPCR homology model: Algorithms and results. Proteins: Structure, Function and Bioinformatics. 2013;81:214–228. doi: 10.1002/prot.24178. [DOI] [PubMed] [Google Scholar]
- Grossfield A. Recent progress in the study of G protein-coupled receptors with molecular dynamics computer simulations. Biochimica et Biophysica Acta (BBA) - Biomembranes. 2011;1808:1868–1878. doi: 10.1016/j.bbamem.2011.03.010. [DOI] [PubMed] [Google Scholar]
- Guarnieri F, Weinstein H. Conformational memories and the exploration of biologically relevant peptide conformations: An illustration for the gonadotropin-releasing hormone. Journal of the American Chemical Society. 1996;118:5580–5589. [Google Scholar]
- Guarnieri F, Wilson SR. Conformational memories and a simulated annealing program that learns: Application to LTB4. Journal of Computational Chemistry. 1995;16:648–653. [Google Scholar]
- Hall SE, Roberts K, Vaidehi N. Position of helical kinks in membrane protein crystal structures and the accuracy of computational prediction. Journal of Molecular Graphics and Modelling. 2009;27:944–950. doi: 10.1016/j.jmgm.2009.02.004. [DOI] [PubMed] [Google Scholar]
- Hanson MA, Roth CB, Jo E, Griffith MT, Scott FL, Reinhart G, et al. Crystal Structure of a Lipid G Protein – Coupled Receptor. Science. 2012;335:851–856. doi: 10.1126/science.1215904. [DOI] [PMC free article] [PubMed] [Google Scholar]
- Hua T, Vemuri K, Pu M, Makriyannis A, Stevens RC, Liu Z. Crystal Structure of the Human Cannabinoid CB 1. Cell. 2016;167:750–762. doi: 10.1016/j.cell.2016.10.004. [DOI] [PMC free article] [PubMed] [Google Scholar]
- Huang W, Manglik A, Venkatakrishnan AJ, Laeremans T, Feinberg EN, Sanborn AL, et al. Structural insights into μ-opioid receptor activation. Nature. 2015;524:315–321. doi: 10.1038/nature14886. [DOI] [PMC free article] [PubMed] [Google Scholar]
- Huang Y, Skwarek-Maruszewska A, Horré K, Vandewyer E, Wolfs L, Snellinx A, et al. Loss of GPR3 reduces the amyloid plaque burden and improves memory in Alzheimer’s disease mouse models. Science Translational Medicine. 2015;7:309ra164. doi: 10.1126/scitranslmed.aab3492. [DOI] [PubMed] [Google Scholar]
- Hurst DP, Grossfield A, Lynch DL, Feller S, Romo TD, Gawrisch K, et al. A lipid pathway for ligand binding is necessary for a cannabinoid G protein-coupled receptor. The Journal of Biological Chemistry. 2010;285:17954–17964. doi: 10.1074/jbc.M109.041590. [DOI] [PMC free article] [PubMed] [Google Scholar]
- Hurst DP, Lynch DL, Barnett-Norris J, Hyatt SM, Seltzman HH, Zhong M, et al. N-(Piperidin-1-yl)-5-(4-chlorophenyl)-1-(2,4-dichlorophenyl)-4-methyl-1H-pyrazole-3-carboxamide (SR141716A) Interaction with LYS 3.28(192) Is Crucial for Its Inverse Agonism at the Cannabinoid CB1 Receptor. Molecular Pharmacology. 2002a;62:1274–1287. doi: 10.1124/mol.62.6.1274. [DOI] [PubMed] [Google Scholar]
- Hurst DP, Lynch DL, Barnett-Norris J, Hyatt SM, Seltzman HH, Zhong M, et al. N-(Piperidin-1-yl)-5-(4-chlorophenyl)-1-(2,4-dichlorophenyl)-4-methyl-1H-pyrazole-3-carboxamide (SR141716A) Interaction with LYS 3.28(192) Is Crucial for Its Inverse Agonism at the Cannabinoid CB1 Receptor. Molecular Pharmacology. 2002b;62:1274–1287. doi: 10.1124/mol.62.6.1274. [DOI] [PubMed] [Google Scholar]
- Isberg V, Mordalski S, Munk C, Rataj K, Harpsoe K, Hauser AS, et al. GPCRdb: An information system for G protein-coupled receptors. Nucleic Acids Research. 2016;44:D356–D364. doi: 10.1093/nar/gkv1178. [DOI] [PMC free article] [PubMed] [Google Scholar]
- Iyer MR, Cinar R, Liu J, Godlewski G, Szanda G, Puhl H, et al. Structural Basis of Species-dependent Differential Affinity of 6-Alkoxy-5-aryl-3-pyridinecarboxamide Cannabinoid Receptor 1 Antagonists Running Title: Species-specific affinity of CB1 receptor antagonists. Molecular Pharmacology. 2015;8195:238–244. doi: 10.1124/mol.115.098541. [DOI] [PMC free article] [PubMed] [Google Scholar]
- Javitch JA, Fu D, Liapakis G, Chen J. Constitutive Activation of the β2 Adrenergic Receptor Alters. Journal of Biological Chemistry. 1997;272:18546–18549. doi: 10.1074/jbc.272.30.18546. [DOI] [PubMed] [Google Scholar]
- Jensen AD, Guarnieri F, Rasmussen SGF, Asmar F, Ballesteros JA, Gether U. Agonist-induced Conformational Changes at the Cytoplasmic Side of Transmembrane Segment 6 in the β2 Adrenergic Receptor Mapped by Site-selective Fluorescent Labeling. Journal of Biological Chemistry. 2001;276:9279–9290. doi: 10.1074/jbc.M004871200. [DOI] [PubMed] [Google Scholar]
- Jensen T, Elster L, Nielsen SM, Poda SB, Loechel F, Volbracht C, et al. The identification of GPR3 inverse agonist AF64394; The first small molecule inhibitor of GPR3 receptor function. Bioorganic and Medicinal Chemistry Letters. 2014;24:5195–5198. doi: 10.1016/j.bmcl.2014.09.077. [DOI] [PubMed] [Google Scholar]
- Kang Y, Zhou XE, Gao X, He Y, Liu W, Ishchenko A, et al. Crystal structure of rhodopsin bound to arrestin by femtosecond X-ray laser. Nature. 2015a;523:561–567. doi: 10.1038/nature14656. [DOI] [PMC free article] [PubMed] [Google Scholar]
- Kang Y, Zhou XE, Gao X, He Y, Liu W, Ishchenko A, et al. Crystal structure of rhodopsin bound to arrestin by femtosecond X-ray laser. Nature. 2015b;523:561–567. doi: 10.1038/nature14656. [DOI] [PMC free article] [PubMed] [Google Scholar]
- Katritch V, Cherezov V, Stevens RC. Diversity and modularity of G protein-coupled receptor structures. Trends in Pharmacological Sciences. 2012;33:17–27. doi: 10.1016/j.tips.2011.09.003. [DOI] [PMC free article] [PubMed] [Google Scholar]
- Katritch V, Fenalti G, Abola EE, Roth BL, Cherezov V, Stevens RC. Allosteric sodium in class A GPCR signaling. Trends in Biochemical Sciences. 2014;39:233–244. doi: 10.1016/j.tibs.2014.03.002. [DOI] [PMC free article] [PubMed] [Google Scholar]
- Kim MK, Kang YK. Positional preference of proline in alpha-helices. Protein Science. 1999;8:1492–1499. doi: 10.1110/ps.8.7.1492. [DOI] [PMC free article] [PubMed] [Google Scholar]
- Kostenis E. Novel clusters of receptors for sphingosine-1-phosphate, sphingosylphosphorylcholine, and (lyso)-phosphatidic acid: New receptors for “old” ligands. Journal of Cellular Biochemistry. 2004;92:923–936. doi: 10.1002/jcb.20092. [DOI] [PubMed] [Google Scholar]
- Larkin MA, Blackshields G, Brown NP, Chenna R, Mcgettigan PA, McWilliam HG, et al. Clustal W and Clustal X version 2.0. Bioinformatics. 2007;23:2947–2948. doi: 10.1093/bioinformatics/btm404. [DOI] [PubMed] [Google Scholar]
- Lee MH, Appleton KM, Strungs EG, Kwon JY, Morinelli TA, Peterson YK, et al. The conformational signature of β-arrestin2 predicts its trafficking and signalling functions. Nature. 2016;531:665–668. doi: 10.1038/nature17154. [DOI] [PMC free article] [PubMed] [Google Scholar]
- Li J, Edwards PC, Burghammer M, Villa C, Schertler GFX. Structure of bovine rhodopsin in a trigonal crystal form. Journal of Molecular Biology. 2004;343:1409–1438. doi: 10.1016/j.jmb.2004.08.090. [DOI] [PubMed] [Google Scholar]
- Lin LS, Ha S, Ball RG, Tsou NN, Castonguay La, Doss GA, et al. Conformational Analysis and Receptor Docking of N-[(1S, 2S)-3-(4-Chlorophenyl)-2-(3-cyanophenyl)-1-methylpropyl]-2-methyl-2-{[5-(trifluoromethyl)pyridin-2-yl]oxy} propanamide (Taranabant, MK-0364), a Novel, Acyclic Cannabinoid 1 Receptor Inverse Agonist. Journal of Medicinal Chemistry. 2008;51:2108–2114. doi: 10.1021/jm7014974. [DOI] [PubMed] [Google Scholar]
- Lingerfelt MA, Zhao P, Sharir HP, Hurst DP, Reggio PH, Abood ME. Identification of Crucial Amino Acid Residues Involved in Agonist Signaling at the GPR55 Receptor. Biochemistry. 2017;56:473–486. doi: 10.1021/acs.biochem.6b01013. [DOI] [PMC free article] [PubMed] [Google Scholar]
- Liu JJ, Horst R, Katritch V, Stevens RC, Wüthrich K. Biased signaling pathways in β2-adrenergic receptor characterized by 19F-NMR. Science (New York, NY) 2012;335:1106–1110. doi: 10.1126/science.1215802. [DOI] [PMC free article] [PubMed] [Google Scholar]
- Manglik A, Kruse AC, Kobilka TS, Thian FS, Jesper M, Sunahara RK, et al. Crystal structure of the μ-opioid receptor bound to a morphian antagonist. Nature. 2012;485:321–326. doi: 10.1038/nature10954. [DOI] [PMC free article] [PubMed] [Google Scholar]
- Manglik A, Kruse AC, Kobilka TS, Thian FS, Mathiesen JM, Sunahara RK, et al. Crystal structure of the μ-opioid receptor bound to a morphinan antagonist. Nature. 2012;485:321–326. doi: 10.1038/nature10954. [DOI] [PMC free article] [PubMed] [Google Scholar]
- McAllister SD, Hurst DP, Barnett-Norris J, Lynch D, Reggio PH, Abood ME. Structural mimicry in class A G protein-coupled receptor rotamer toggle switches: The importance of the F3.36(201)/W6.48(357) interaction in cannabinoid CB1 receptor activation. Journal of Biological Chemistry. 2004;279:48024–48037. doi: 10.1074/jbc.M406648200. [DOI] [PubMed] [Google Scholar]
- McRobb FM, Negri A, Beuming T, Sherman W. Molecular dynamics techniques for modeling G protein-coupled receptors. Current Opinion in Pharmacology. 2016;30:69–75. doi: 10.1016/j.coph.2016.07.001. [DOI] [PubMed] [Google Scholar]
- Mehler EL, Periole X, Hassan SA, Weinstein H. Key issues in the computational simulation of GPCR function: Representation of loop domains. Journal of Computer-Aided Molecular Design. 2002;16:841–853. doi: 10.1023/a:1023845015343. [DOI] [PubMed] [Google Scholar]
- Mehlmann LM, Saeki Y, Tanaka S, Brennan TJ, Evsikov AV, Pendola FL, et al. The Gs-linked receptor GPR3 maintains meiotic arrest in mammalian oocytes. Science. 2004;306:1947–50. doi: 10.1126/science.1103974. [DOI] [PubMed] [Google Scholar]
- Mnpotra JS, Qiao Z, Cai J, Lynch DL, Grossfield A, Leioatts N, et al. Structural basis of G protein-coupled receptor-Gi protein interaction: formation of the cannabinoid CB2 receptor-Gi protein complex. The Journal of Biological Chemistry. 2014;289:20259–72. doi: 10.1074/jbc.M113.539916. [DOI] [PMC free article] [PubMed] [Google Scholar]
- Munk C, Isberg V, Mordalski S, Harpsøe K, Rataj K, Hauser AS, et al. GPCRdb: the G protein-coupled receptor database - an introduction. British Journal of Pharmacology. 2016;16:2195–2207. doi: 10.1111/bph.13509. [DOI] [PMC free article] [PubMed] [Google Scholar]
- Nebane NM, Hurst DP, Carrasquer CA, Qiao Z, Reggio PH, Song ZH. Residues accessible in the binding-site crevice of transmembrane helix 6 of the CB2 cannabinoid receptor. Biochemistry. 2008;47:13811–13821. doi: 10.1021/bi8007802. [DOI] [PMC free article] [PubMed] [Google Scholar]
- Nelson CD, Sheng M. GPR3 stimulates Aβ production via interactions with APP and β-arrestin2. PloS One. 2013;8:e74680. doi: 10.1371/journal.pone.0074680. [DOI] [PMC free article] [PubMed] [Google Scholar]
- Nobles KN, Xiao K, Ahn S, Shukla AK, Lam CM, Rajagopal S, et al. Distinct Phosphorylation Sites on the β2-Adrenergic Receptor Establish a Barcode That Encodes Differential Functions of β-Arrestin. Science Signaling. 2011;4:ra51. doi: 10.1126/scisignal.2001707. [DOI] [PMC free article] [PubMed] [Google Scholar]
- Okada T, Fujiyoshi Y, Silow M, Navarro J, Landau EM, Shichida Y. Functional role of internal water molecules in rhodopsin revealed by X-ray crystallography. Proceedings of the National Academy of Sciences of the United States of America. 2002;99:5982–5987. doi: 10.1073/pnas.082666399. [DOI] [PMC free article] [PubMed] [Google Scholar]
- Okada T, Sugihara M, Bondar AN, Elstner M, Entel P, Buss V. The retinal conformation and its environment in rhodopsin in light of a new 2.2 A crystal structure. Journal of Molecular Biology. 2004;342:571–583. doi: 10.1016/j.jmb.2004.07.044. [DOI] [PubMed] [Google Scholar]
- Okuno T, Yokomizo T, Hori T, Miyano M, Shimizu T. Leukotriene B4 receptor and the function of its helix 8. Journal of Biological Chemistry. 2005;280:32049–32052. doi: 10.1074/jbc.R500007200. [DOI] [PubMed] [Google Scholar]
- Palczewski K, Palczewski K, Kumasaka T, Hori T, Le Trong I, Teller DC, Okada T. Crystal Structure of Rhodopsin : A G Protein – Coupled Receptor. Science. 2000;4:739–745. doi: 10.1126/science.289.5480.739. [DOI] [PubMed] [Google Scholar]
- Pan X, Ikeda SR, Lewis DL. SR 141716A acts as an inverse agonist to increase neuronal voltage-dependent Ca2+ currents by reversal of tonic CB1 cannabinoid receptor activity. Molecular Pharmacology. 1998;54:1064–1072. doi: 10.1124/mol.54.6.1064. [DOI] [PubMed] [Google Scholar]
- Perálvarez-Marín A, Bourdelande JL, Querol E, Padrós E. The role of proline residues in the dynamics of transmembrane helices: the case of bacteriorhodopsin. Molecular Membrane Biology. 2006;23:127–135. doi: 10.1080/09687860500435019. [DOI] [PubMed] [Google Scholar]
- Pertwee RG, Howlett AC, Abood ME, Alexander SPH, Di Marzo V, Elphick MR, et al. International Union of Basic and Clinical Pharmacology. LXXIX. Cannabinoid Receptors and Their Ligands: Beyond CB1 and CB2. Pharmacological Reviews. 2010;62:588–631. doi: 10.1124/pr.110.003004. [DOI] [PMC free article] [PubMed] [Google Scholar]
- Rahmeh R, Damian M, Cottet M, Orcel H, Mendre C, Durroux T, et al. Structural insights into biased G protein-coupled receptor signaling revealed by fluorescence spectroscopy. Proceedings of the National Academy of Sciences of the United States of America. 2012;109:6733–6738. doi: 10.1073/pnas.1201093109. [DOI] [PMC free article] [PubMed] [Google Scholar]
- Rasmussen SGF, DeVree BT, Zou Y, Kruse AC, Chung KY, Kobilka TS, et al. Crystal structure of the β2 adrenergic receptor-Gs protein complex. Nature. 2011:549–55. doi: 10.1038/nature10361. [DOI] [PMC free article] [PubMed] [Google Scholar]
- Reggio PH. Computational methods in drug design: modeling G protein-coupled receptor monomers, dimers, and oligomers. The AAPS Journal. 2006;8:E322–36. doi: 10.1007/BF02854903. [DOI] [PMC free article] [PubMed] [Google Scholar]
- Rosenbaum DM, Rasmussen SGF, Kobilka BK. The structure and function of G-protein-coupled receptors. Nature. 2009;459:356–363. doi: 10.1038/nature08144. [DOI] [PMC free article] [PubMed] [Google Scholar]
- Ross RA. The enigmatic pharmacology of GPR55. Trends in Pharmacological Sciences. 2009;30:156–163. doi: 10.1016/j.tips.2008.12.004. [DOI] [PubMed] [Google Scholar]
- Ruiz-Medina J, Ledent C, Valverde O. GPR3 orphan receptor is involved in neuropathic pain after peripheral nerve injury and regulates morphine-induced antinociception. Neuropharmacology. 2011;61:43–50. doi: 10.1016/j.neuropharm.2011.02.014. [DOI] [PubMed] [Google Scholar]
- Šali A, Blundell TL. Comparative Protein Modelling by Satisfaction of Spatial Restraints. Journal of Molecular Biology. 1993;234:779–815. doi: 10.1006/jmbi.1993.1626. [DOI] [PubMed] [Google Scholar]
- Salon Ja, Lodowski DT, Palczewski K. The Significance of G Protein-Coupled Receptor Crystallography for Drug Discovery. Pharmacological Reviews. 2011;63:901–937. doi: 10.1124/pr.110.003350. [DOI] [PMC free article] [PubMed] [Google Scholar]
- Shao Z, Yin J, Chapman K, Grzemska M, Clark L, Wang J, Rosenbaum DM. High-resolution crystal structure of the human CB1 cannabinoid receptor. Nature. 2016;540:602–606. doi: 10.1038/nature20613. [DOI] [PMC free article] [PubMed] [Google Scholar]
- Shukla AK, Singh G, Ghosh E. Emerging structural insights into biased GPCR signaling. Trends in Biochemical Sciences. 2014;39:594–602. doi: 10.1016/j.tibs.2014.10.001. [DOI] [PubMed] [Google Scholar]
- Shukla AK, Westfield GH, Xiao K, Reis RI, Huang LY, Tripathi-Shukla P, et al. Visualization of arrestin recruitment by a G-protein-coupled receptor. Nature. 2014;512:218–222. doi: 10.1038/nature13430. [DOI] [PMC free article] [PubMed] [Google Scholar]
- Shukla AK, Xiao K, Lefkowitz RJ. Emerging paradigms of β-arrestin-dependent seven transmembrane receptor signaling. Trends in Biochemical Sciences. 2011;36:457–469. doi: 10.1016/j.tibs.2011.06.003. [DOI] [PMC free article] [PubMed] [Google Scholar]
- Singh R, Hurst DP, Barnett-Norris J, Lynch DL, Reggio PH, Guarnieri F. Activation of the cannabinoid CB1 receptor may involve a W6.48/F3.36 rotamer toggle switch. The Journal of Peptide Research: Official Journal of the American Peptide Society. 2002;60:357–370. doi: 10.1034/j.1399-3011.2002.21065.x. [DOI] [PubMed] [Google Scholar]
- Song ZH, Modi W, Bonner TI. Molecular Cloning and Chromosomal Localization of Human Genes Encoding Three Closely Related G Protein-Coupled Receptors. Genomics. 1995;28:347–349. doi: 10.1006/geno.1995.1154. [DOI] [PubMed] [Google Scholar]
- Song ZH, Slowey Ca, Hurst DP, Reggio PH. The difference between the CB(1) and CB(2) cannabinoid receptors at position 5.46 is crucial for the selectivity of WIN55212-2 for CB(2) Molecular Pharmacology. 1999;56:834–840. [PubMed] [Google Scholar]
- Standfuss J, Edwards PC, D’Antona A, Fransen M, Xie G, Oprian DD, Schertler GFX. The structural basis of agonist-induced activation in constitutively active rhodopsin. Nature. 2011;471:656–660. doi: 10.1038/nature09795. [DOI] [PMC free article] [PubMed] [Google Scholar]
- Szczepek M, Beyrière F, Hofmann KP, Elgeti M, Kazmin R, Rose A, et al. Crystal structure of a common GPCR-binding interface for G protein and arrestin. Nature Communications. 2014;5:4801. doi: 10.1038/ncomms5801. [DOI] [PMC free article] [PubMed] [Google Scholar]
- Tanaka S, Ishii K, Kasai K, Sung OY, Saeki Y. Neural expression of G protein-coupled receptors GPR3, GPR6, and GPR12 up-regulates cyclic AMP levels and promotes neurite outgrowth. Journal of Biological Chemistry. 2007;282:10506–10515. doi: 10.1074/jbc.M700911200. [DOI] [PubMed] [Google Scholar]
- Tanaka S, Miyagi T, Dohi E, Seki T, Hide I, Sotomaru Y, … Sakai N. Developmental expression of GPR3 in rodent cerebellar granule neurons is associated with cell survival and protects neurons from various apoptotic stimuli. Neurobiology of Disease. 2014;68:215–27. doi: 10.1016/j.nbd.2014.04.007. [DOI] [PubMed] [Google Scholar]
- Tanaka S, Shaikh IM, Chiocca EA, Saeki Y. The Gs-linked receptor GPR3 inhibits the proliferation of cerebellar granule cells during postnatal development. PLoS ONE. 2009;4:1–12. doi: 10.1371/journal.pone.0005922. [DOI] [PMC free article] [PubMed] [Google Scholar]
- Thathiah A, Horré K, Snellinx A, Vandewyer E, Huang Y, Ciesielska M, et al. β-arrestin 2 regulates Aβ generation and γ-secretase activity in Alzheimer’s disease. Nature Medicine. 2013;19:43–49. doi: 10.1038/nm.3023. [DOI] [PubMed] [Google Scholar]
- Thathiah A, Spittaels K, Hoffmann M, Staes M, Cohen A, Horré K, et al. The orphan G protein-coupled receptor 3 modulates amyloid-beta peptide generation in neurons. Science (New York, NY) 2009;323:946–51. doi: 10.1126/science.1160649. [DOI] [PubMed] [Google Scholar]
- Thompson JD, Higgins DG, Gibson TJ. CLUSTAL W: Improving the sensitivity of progressive multiple sequence alignment through sequence weighting, position-specific gap penalties and weight matrix choice. Nucleic Acids Research. 1994;22:4673–4680. doi: 10.1093/nar/22.22.4673. [DOI] [PMC free article] [PubMed] [Google Scholar]
- Tourino C, Valjent E, Ruiz-Medina J, Herve D, Ledent C, Valverde O. The orphan receptor GPR3 modulates the early phases of cocaine reinforcement. British Journal of Pharmacology. 2012;167:892–904. doi: 10.1111/j.1476-5381.2012.02043.x. [DOI] [PMC free article] [PubMed] [Google Scholar]
- Uhlenbrock K, Gassenhuber H, Kostenis E. Sphingosine 1-phosphate is a ligand of the human gpr3, gpr6 and gpr12 family of constitutively active G protein-coupled receptors. Cellular Signalling. 2002;14:941–953. doi: 10.1016/s0898-6568(02)00041-4. [DOI] [PubMed] [Google Scholar]
- Valverde O, Celerier E, Baranyi M, Vanderhaeghen P, Maldonado R, Sperlagh B, et al. GPR3 receptor, a novel actor in the emotional-like responses. PLoS ONE. 2009:4. doi: 10.1371/journal.pone.0004704. [DOI] [PMC free article] [PubMed] [Google Scholar]
- Venkatakrishnan AJ, Deupi X, Lebon G, Heydenreich FM, Flock T, Miljus T, et al. Diverse activation pathways in class A GPCRs converge near the G-protein-coupling region. Nature. 2016;40:383–388. doi: 10.1038/nature19107. [DOI] [PMC free article] [PubMed] [Google Scholar]
- Visiers I, Braunheim BB, Weinstein H. Prokink: a protocol for numerical evaluation of helix distortions by proline. Protein Engineering. 2000;13:603–6. doi: 10.1093/protein/13.9.603. [DOI] [PubMed] [Google Scholar]
- Wasmuth EV, Lima CD. UniProt: the universal protein knowledgebase. Nucleic Acids Research. 2017;45:D158–D169. doi: 10.1093/nar/gkw1099. [DOI] [PMC free article] [PubMed] [Google Scholar]
- Whitnell R, Hurst DP, Reggio PH, Guarnieri F. Conformational Memories with Variable Bond Angles. Journal of Computational Chemistry. 2007;29:741–752. doi: 10.1002/jcc.20822. [DOI] [PubMed] [Google Scholar]
- Williams KA, Deber CM. Proline Residues in Transmembrane Helices : Structural or Dynamic Role ? Biochemistry. 1991;30:8919–8923. doi: 10.1021/bi00101a001. [DOI] [PubMed] [Google Scholar]
- Worth CL, Kleinau G, Krause G. Comparative sequence and structural analyses of G-protein-coupled receptor crystal structures and implications for molecular models. PLoS ONE. 2009;4:e7011. doi: 10.1371/journal.pone.0007011. [DOI] [PMC free article] [PubMed] [Google Scholar]
- Ye C, Zhang Z, Wang Z, Hua Q, Zhang R, Xie X. Identification of a novel small-molecule agonist for human G protein-coupled receptor 3. The Journal of Pharmacology and Experimental Therapeutics. 2014;349:437–443. doi: 10.1124/jpet.114.213082. [DOI] [PubMed] [Google Scholar]
- Yin H, Chu A, Li W, Wang B, Shelton F, Otero F, et al. Lipid G protein-coupled receptor ligand identification using beta-arrestin PathHunter assay. Journal of Biological Chemistry. 2009;284:12328–12338. doi: 10.1074/jbc.M806516200. [DOI] [PMC free article] [PubMed] [Google Scholar]
- Yohannan S, Faham S, Yang D, Whitelegge JP, Bowie JU. The evolution of transmembrane helix kinks and the structural diversity of G protein-coupled receptors. Proceedings of the National Academy of Sciences. 2004;101:959–963. doi: 10.1073/pnas.0306077101. [DOI] [PMC free article] [PubMed] [Google Scholar]
- Zhang C, Srinivasan Y, Arlow DH, Fung JJ, Palmer D, Zheng Y, et al. High-resolution crystal structure of human protease-activated receptor 1. Nature. 2012;492:387–92. doi: 10.1038/nature11701. [DOI] [PMC free article] [PubMed] [Google Scholar]
- Zhang HY, Bi GH, Li X, Li J, Qu H, Zhang SJ, et al. Species differences in cannabinoid receptor 2 and receptor responses to cocaine self-administration in mice and rats. Neuropsychopharmacology : Official Publication of the American College of Neuropsychopharmacology. 2015;40:1037–1051. doi: 10.1038/npp.2014.297. [DOI] [PMC free article] [PubMed] [Google Scholar]
- Zhang R, Hurst DP, Barnett-Norris J, Reggio PH, Song ZH. Cysteine 2.59(89) in the second transmembrane domain of human CB2 receptor is accessible within the ligand binding crevice: evidence for possible CB2 deviation from a rhodopsin template. Molecular Pharmacology. 2005;68:69–83. doi: 10.1124/mol.104.007823. [DOI] [PubMed] [Google Scholar]
- Zhou H, Yan F, Yamamoto S, Tai HH. Phenylalanine 138 in the second intracellular loop of human thromboxane receptor is critical for receptor-G-protein coupling. Biochemical and Biophysical Research Communications. 1999;264:171–5. doi: 10.1006/bbrc.1999.1508. [DOI] [PubMed] [Google Scholar]


