

Abstract
Many human diseases result from the dysregulation of the complex interactions between tens to thousands of genes. However, approaches for the transcriptional modulation of many genes simultaneously in a predictive manner are lacking. Here, through the combination of simulations, systems modelling and in vitro experiments, we provide a physical regulatory framework based on chromatin packing-density heterogeneity for modulating the genomic information space. Because transcriptional interactions are essentially chemical reactions, they depend largely on the local physical nanoenvironment. We show that the regulation of the chromatin nanoenvironment allows for the predictable modulation of global patterns in gene expression. In particular, we show that the rational modulation of chromatin density fluctuations can lead to a decrease in global transcriptional activity and intercellular transcriptional heterogeneity in cancer cells during chemotherapeutic responses to achieve near-complete cancer cell killing in vitro. Our findings represent a ‘macrogenomic engineering’ approach to modulating the physical structure of chromatin for whole-scale transcriptional modulation.
Fully sequencing the human genome has allowed unprecedented exploration of the roles that genes play in diseases, including neurological and autoimmune disorders, heart disease, and cancer. One of the most significant findings from the human genome project was the fact that, in many cases, these diseases do not depend on the behaviour of individual genes, but on the complex interplay between tens to thousands of genes over long periods of time1–3. Despite this emerging understanding that many human diseases are thus inherently multifactorial and genomic in nature, no technologies have been developed that allow for the simultaneous, predictable engineering of multidimensional transcriptional interactions.
In this regard, many studies have explored the mechanisms that control the transcription of genes, and have provided new understanding of the epigenetics that govern diseases. At the level of histones and nucleosomal organization (~10 nm), it is widely recognized that the physical structure of chromatin plays an important role in governing gene expression4,5. In a disease where particular genes or their mutational variants produce a hierarchal, central network topology, this information can be leveraged to control many genes simultaneously by targeting a key node (Fig. 1a). These insights have greatly expanded our knowledge of the basis of genetic diseases, but they face the limitation that genetic changes to transcription factor binding sites, nucleosomal remodelling or specific gene compartments6,7 determine the activity of a few genes only; yet most genetic networks are inherently decentralized or diffuse (Fig. 1b). Therefore, methods to manipulate the expression patterns of many genes simultaneously for non-hierarchical diseases, including most cancers and many diseases of ageing (Fig. 1c), are largely missing. To address this need, here we present a method to target supra-nucleosomal (> 10 nm) chromatin physical structure as a means to predictably modulate global patterns in gene transcription. Starting from first-principle physical considerations and using a combination of Brownian dynamics and Monte Carlo simulations paired with systems modelling, we develop a model that explains the role of supra-nucleosomal chromatin organization on gene expression at the level of physiochemical interactions. Testing the predictions from this model with experimental results obtained from nanoscale measurements of chromatin structure using partial wave spectroscopic (PWS) microscopy—which measures nanoscopic alterations in the scaling of chromatin packing density with a sensitivity to chromatin organization between 20 and 350 nm—in live cells and from measurements of gene expression using mRNA microarrays, we show that altering the packing-density scaling of chromatin produces predictable changes in gene expression, and that one of the main functional roles of the physical organization of chromatin is controlling the genomic information space as well as intercellular transcriptional heterogeneity. Accordingly, whereas existing understanding of transcriptional regulation has focused on means that regulate individual genes (modifying transcription factor binding domains, performing nucleosomal post-translational modifications, or localizing genes to chromatin compartments), the approach introduced in this work modulates the physical structure of chromatin for global transcriptional modulation (Fig. 2a–d).
Fig. 1. Genomic networks are highly interconnected and decentralized.
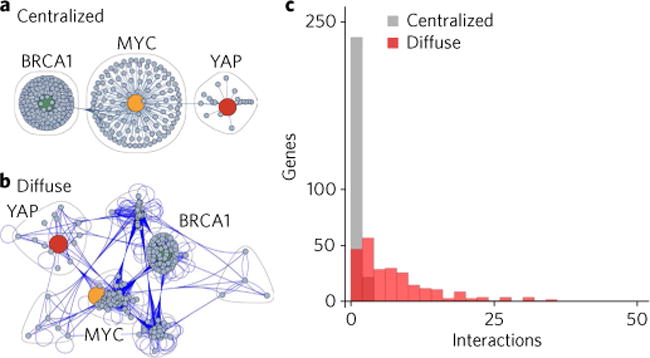
a, Classically, the role of critical genes, such as MYC, BRCA1 and YAP, has been viewed in the context of a hub-spoke model, in which these genes form the critical link between the elements in the system. b, However, evidence has shown that the full mapping of the interactions that occur for all genes within a given interaction network shows a diffuse plurality of connections and broad network redundancy. c, Mathematically, the divergence in these models can be represented by the number of connections each gene shares. In the classical hub-spoke system, most genes are anchored only by the central elements (such as BRCA1, MYC and YAP). In most genetic networks, however, this is a major oversimplification. Indeed, most genes share direct interactions with at least five other genes within the network, necessitating a strategy to target the overall regulators of gene transcription. In c, note that when grey and red bars overlap, the bar appears dark red.
Fig. 2. Genomic interactions depend on a complex physical nanoenvironment.
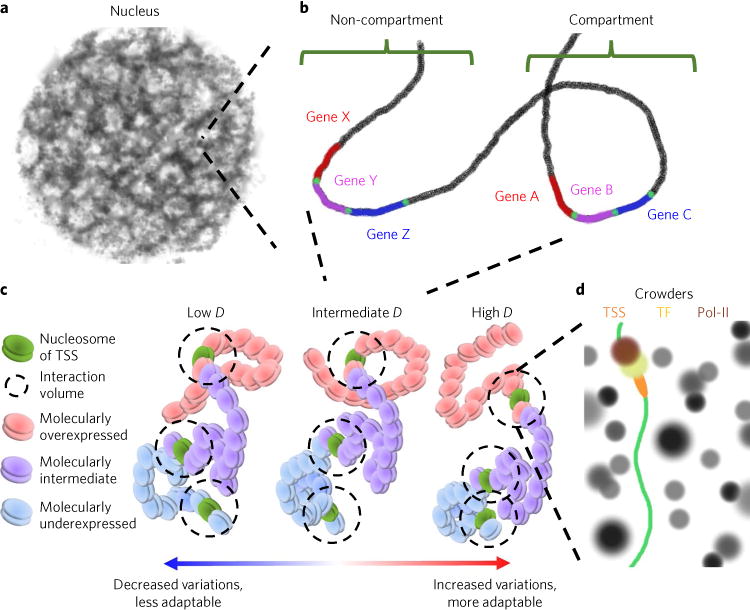
a, One universally shared feature of all genes is the physical nanoenvironment that is determined by the supranucleosomal (> 10 nm) packing density of chromatin within the nucleus. b, While previous work has shown that localizing genes into or out of compartments will influence their expression, both genes within compartments (genes A–C) and outside of compartments (genes X–Z) will respond to the physical forces produced by their differential packing density. c, As a consequence, while genes are regulated by distinct molecular characteristics (transcription factor binding affinity, compartment concentrations of factors or nucleosomal modifications) that predispose them to a preferred expression state (overexpressed, intermediate or underexpressed), the transcription of these genes into mRNA will also depend on local physical forces. Thus, regardless of the determinant of expression, overexpressed genes (A and X) will differentially respond to local physical organization produced by chromatin packing when compared to intermediately expressed (B and Y) or underexpressed (C and Z) genes. To integrate these effects, we consider the power-law scaling of chromatin packing density through fractal dimension, D. Increased D produces increased variations in chromatin packing density whereas decreased D does the opposite. d, Ultimately, the physical geometry of chromatin (scaling) determines accessible surface area as well as local crowding conditions that will influence the chemical reactions governing transcription by altering gene accessibility, molecular mobility of reactant species, and the free energy of the transcriptional reactions. Pol-II, RNA polymerase II; TF, transcription factor; TSS, transcription start site.
Owing to this role of physical structure of chromatin as a major regulator of the genomic information space through shaping the physiochemical nanoenvironment, we then apply the predictions in our model to overcome chemoevasion produced at the level of transcriptional heterogeneity8,9. One of the main challenges in cancer therapy is the innate ability of cells to adaptively sample their genome in order to develop mechanisms of chemotherapeutic evasion10. To reverse this process, we employ our model to show that the use of agents that reduce intranuclear variations in chromatin packing density, termed chromatin protective therapies (CPTs), should reduce this transcriptional heterogeneity, and therefore that CPT agents would be effective adjuvant compounds to prevent the emergence of chemoresistance by limiting the replicative adaptability of cancer cells8. Using live cell PWS microscopy11, we test this hypothesis on two potential adjuvants, celecoxib and digoxin, to see if they can act to reduce transcriptional heterogeneity and lead to significant amplification of cancer-cell lethality induced by chemotherapeutic agents. We validate this hypothesis in multiple models of aggressive gynaecological tumours and show that the level of chromatin modulation directly corresponds to the predicted in vitro efficacy.
Hence, we show that global patterns in gene transcription can be controlled by manipulating the physical nanoenvironment within the nucleus. Although we apply the functional consequence of such macrogenomic engineering to the screening of chemotherapeutic adjuvants, the approach paves the way for the study and treatment of diseases—such as Parkinson’s disease, atherosclerosis and autoimmune disorders—that are governed by the complex interplay of dozens of genes.
Results
In chromatin, chemical reactions such as gene transcription take place in a highly dense and heterogeneous physical nanoenvironment, the consequences of which are not yet fully understood. Here, we present and use a predictive model to leverage the effects of this physical nanoenvironment on gene transcription in order to control global patterns in gene expression. This model achieves this by considering that these chemical reactions depend on: (1) the accessibility of the genome12, (2) the intrinsic molecular characteristics of the gene (binding affinities, local concentration of reactant species, and reaction rates, among others)13, and (3) the effects of physical interactions on these chemical reactions13–15. Notably, the supranu-cleosomal physical organization of chromatin and the associated spatial fluctuations of concentration, and the overall accessibility of chromatin, have a role in determining the behaviour of these chemical reactions, as explored below.
To begin, we consider the elements that control the physical nanoenvironment within the eukaryotic nucleus and that influence many genes simultaneously. Chromatin (DNA and DNA-associated proteins, such as histones, polymerases and transcription factors) is the predominant macromolecular assembly within the nucleus16. Thus, the nuclear physical nanoenvironment with respect to multiple genes is shaped by the assembly of chromatin packed into supra-nucleosomal structures (> 10 nm) (Fig. 2a–d). Recent evidence suggests that chromatin polymer is a disordered chain that is packed together at different densities throughout the nucleus17. Independent of the exact configuration and of the kinetics of supranucleosomal folding, 3D chromatin packing density can be described statistically by the scaling of the mass of chromatin (M) contained within a sphere of radius r, M(r), and by the associated auto-correlation function (ACF) of chromatin packing density. The ACF is the quantitative relationship between smaller components (such as nucleotides and nucleosomes) and larger structures (up to chromosomal territories). Although the exact nature of chromatin organization is a topic of active debate, most of the recent evidence suggests that for supra-nucleosomal length scales up to the Mbp range, chromatin can be characterized as a mass fractal (power-law scaling) media with a fractal dimension (scaling exponent) D < 3, a property which is commonly found in a variety of polymer systems18–27: M ∝ rD and , where V is volume28–30. It will be of consequence to the discussion below that ACF also quantifies the intranuclear heterogeneity of chromatin packing density, and thus the scaling of chromatin packing density and packing-density heterogeneity are inherently linked. Experimentally, the power-law scaling of chromatin packing density was found using both ex vivo molecular techniques such as neutron scattering and chromatin conformation capture (3C, 5C and Hi-C)31–33 as well as in vitro by nanoscale-sensitive imaging techniques such as transmission electron microscopy (TEM), PWS microscopy, fluorescence correlation spectroscopy and photon localization microscopy (PLM)34–37.
By using this evidence, and without loss of generality, we consider the mass and ACF of chromatin structure to follow a power-law scaling form with fractal dimension, D. To extend this work to non-fractal conditions, one should note that D is proportional to the molecular correlation distance regardless of the exact form of the correlation function (for example, when D > 3)38–40. In cases with a non-fractal ACF, D instead statistically quantifies the fraction of large versus small length-scale structures in chromatin (a larger D implies a greater fraction of larger length scales)39,41, and the physical properties of chromatin (including the accessible surface area and the local variations in density, which are two critical quantities that play a major role in global transcriptional regulation) can still be quantified using the ACF. Consequently, in the context of this work, the scaling of chromatin packing density refers to the polymeric properties of chromatin as it relates to the scaling dimension (or scaling exponent), D, of its mass, as a function of distance from a reference point. Clearly, multiple chromatin conformations may potentially correspond to the same scaling dimension. However, as it occurs with other polymers, modifying the scaling dimension will produce critical differences in both the accessibility of chromatin regions and the distribution of chromatin packing density.
To understand the link between chromatin packing-density scaling and transcription, we consider the average mRNA transcription rate, E, for any given group of genes (n > 1) as the product of the expectation of the fraction of chromatin that corresponds to the accessible surface (ASA) and the average rate of transcription of genes associated with the accessible chromatin surface, ,
| (1) |
where ε(m, ϕ) is the expression rate of any given gene within the group as a function of its molecular features, m, for a given local molecular crowding density, ϕ. m accounts for molecular regulators such as the local concentration of transcription factors, their binding affinities, and the transcription rate of RNA polymerases, which in turn depend on histone regulation, genome compartmentalization (such as gene positioning with respect to A/B domains and transcription factors)22,42, and other molecular regulatory processes.
We first consider the influence that packing-density scaling has on the accessible surface area of chromatin. In a fractal medium, the relation between ASA and D is analytically quantified following the law of dimensional coadditivity as:
| (2) |
where Mmin is the mass of the basic unit of the chromatin chain (a single nucleotide) and Mf is the total mass of the chromatin domain within which the power-law scaling holds with the number of base pairs . Therefore, in a power-law medium such as chromatin, increases in D directly elevate ASA, and without other considerations, would elevate transcription overall. In principle, D can vary throughout the nucleus and, as a result, ASA could vary from gene to gene. However, global increases or decreases in packing-density scaling would be expected to change the accessibility of genes on average. It is important to note that these conclusions also apply to a medium with a non-fractal ACF, as an increase in the correlation distance (higher D) would increase the ASA (see Supplementary equations (10)–(14) for details).
In addition to altering ASA, changes in D also have an effect on ε through the heterogeneity of chromatin packing density. Changes in the local mass density (that is, changes in crowding) will non-monotonically alter expression depending on the molecular features of a given gene. This complexity and molecular dependence is rooted in the competition between the effect of local crowding on molecular diffusion and the stability of binding reactions13. As crowding increases from dilute conditions, the initial effect on chemical reactions is a gain in stabilization of the intermediary complexes, as the entire system gains entropy by decreasing the excluded volume of the reactant species. As the volume fraction continues to increase, the gain in entropy is eventually overcome by the decreased mobility that results from crowding. This produces a non-monotonic relationship between the local density and the rate of transcription that disproportionately influences underexpressed genes (Fig. 3a). To quantify this relationship as a function of various molecular features for a homogenous media, we used Brownian dynamics and Monte Carlo simulations13. However, chromatin is an inherently heterogeneous environment, and therefore predicting the effects of changes in density requires information on the distribution of mass density. To estimate these changes, we analytically calculated the local variations in crowding as a function of D on the basis of the properties of a polymeric assembly. Of note, the effects of the spatial distribution of mass density on gene expression are applicable both to genes localized within and outside of higher-order compartments, as crowding has a generalized effect on chemical reactions (Fig. 2b,c). Therefore, although compartmentalization has itself been shown to control individual genes by modulating the distribution of cis regulatory factors, in the context of the transcriptional modulation by chromatin packing density, the compartmentalization effects will be similar to those of genomic or histone modifications: they alter the underlying molecular predisposition of individual genes for gene expression, which is further modulated by the local chromatin packing density.
Fig. 3. Control of higher-order chromatin packing density scaling allows manipulation of genomic information space.
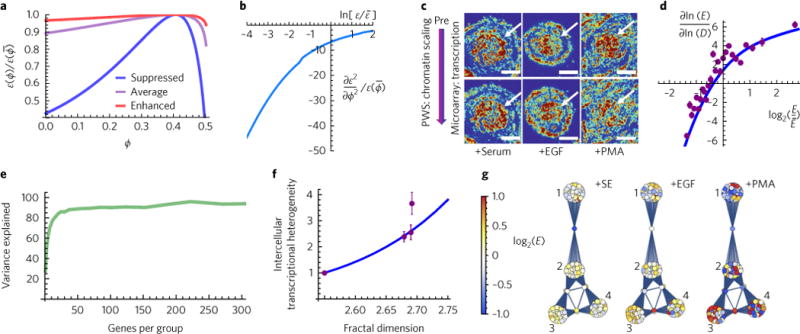
a, Local macromolecular crowding density (ϕ) non-monotonically regulates gene expression. The rate of expression relative to that of the average crowding that would be observed in the absence of chromatin packing-density heterogeneity is a non-monotonic function of ϕ and also depends on . In turn, is determined by molecular factors m including transcription-factor concentrations, binding affinities and the rate of transcription, among others. Expression of suppressed genes is 0.01-fold of the average, and that of enhanced genes is 10-fold the average. b, The result of this non-monotonic relationship between macromolecular crowding and gene expression is an anisotropic response of the rate of expression to changes in crowding as a function of the rate of expression where is the average rate of expression. c, Differential PWS microscopy of the variations in chromatin packing density and RNA microarray experiment to measure the relation between changes in chromatin packing-density scaling and transformation of global gene expression using stimulation with serum (SE), epidermal growth factor (EGF), or phorbal 12-myristate-13-acetate (PMA). Scale bars, 15 μm. Pseudo-colour: heterogeneity of chromatin packing density (Σ). Arrows: cell nuclei. d, Comparison of the analytical macrogenomic model predicting the changes in gene expression in response to changes in chromatin packing-density scaling (fractal dimension) D (blue curve; gene expression sensitivity (Se), see equation (5)), with experimental microarray results (purple markers) obtained from c. Each experimental data point represents the average of 100 genes. is the average expression of all genes. Error bars are the standard errors of the gene expression sensitivity (Se) calculated based on the microarray data in each subgroup. e, The accuracy of the macrogenomic model (equation (5)) increases as a function of the number of genes in each group. For gene groups with more than 50 genes, over 90% of the variance of gene expression is explained by the predicted effect of the chromatin packing-density scaling. f,g, A major functional role of the regulation of chromatin packing-density scaling is the modulation of the genomic information. Increases in the variations in chromatin packing density are directly linked to increased intercellular transcriptional heterogeneity (f) and transcriptional divergence (g). f, Comparison of the analytical macrogenomic model predicting intercellular transcriptional heterogeneity (H) as a function of D (blue curve; equation (6)) with experimental microarray results (purple markers). Error bars represent the standard errors of the heterogeneity of 1,000 genes for each condition. Genes were selected such that their expression was within 1 standard deviation of gene expression of the mean expression for all conditions. g, Processes where transcriptional divergence occurs include but are not limited to: (1) metabolic regulators, (2) proliferation, (3) apoptosis and (4) developmental regulation.
With respect to chemical reactions, it is reasonable to assume that the physical environment within a small ‘interaction volume’ of radius Lin neighbouring any given gene is homogenous with a local crowding density ϕ (Fig. 2c,d). Furthermore, outside of this interaction volume, crowding conditions have no effect on transcription reactions of the given gene, as crowding density has a negligible influence on the free energy of reactions13. Therefore, the effect of D on transcriptional reactions is mediated by the variations in mass density (ϕ) throughout the nucleus. Analytically, the variance of local density within the nucleus, , can be derived as a function of packing-density scaling, D, and is calculated as:
| (3) |
where rmin is the size of the unit element (here a single base pair of DNA) and is the average of ϕ across the entire nucleus. As D increases, so too do the local variations in density. As the location of genes within a group (for example, genes with similar molecular features) can vary throughout the nucleus, the ensemble expression is given by the expectation of gene expression as a function of the local crowding conditions. Therefore can be approximated by:
| (4) |
where is the rate of gene expression that would be observed in the absence of chromatin packing-density heterogeneity. Using equation (4), the effect of D on is analytically computed as a function of the local crowding conditions with obtained from the simulations (Fig. 3a). Since is non-monotonic and, for the range of typically found in cell nuclei (~30–45%), is close to its maximum, . Therefore, an increase in D reduces ε, as genes become exposed to a wider range of local crowding conditions for which ε is : not at its maximum. As Fig. 3b illustrates, this effect depends on ε(m): the absolute value of decreases as a function of the rate of (Supplementary equation (19)). This is because highly expressed genes are already optimized by molecular modifications (such as histone interactions or gene positioning within chromatin domains) and crowding has a lesser effect on the stabilization of their intermediary complexes. Therefore, the net result of an increase in D is greater suppression of initially underexpressed genes in comparison to overexpressed genes. Integrated with the overall upregulation of gene expression probabilities due to an increase in ASA as a function of D, the resulting behaviour of increases in D on transcription would be asymmetric and monotonic.
What is practically significant is to predict how gene expression for a given functional group of genes that share a common characteristic (such as similar initial expression, length, or other attributes) changes in response to a change in chromatin packing-density scaling as quantified by D. To characterize this relationship, we define the relative change of gene expression as a function of the change in D (‘gene expression sensitivity’), Se = ∂ln(E)/∂ln(D). Combining equations (1)–(4), this can be directly quantified as:
| (5) |
Here, L is the sequence length of the gene, and function g is used as a change of variables to transform into a function of , and can be computed either numerically from simulations or analytically as:
where κ = 22.6 nM s−1 is the critical expression such that for crowding has a significant effect. Because κ exceeds the physiological range of the rate of transcription, crowding is expected to have a significant effect on gene transcription (Supplementary equations (15)–(20)).
To validate this model, we tested these predictions against experimental data. Cells were exposed to multiple perturbations, including stimulation with serum, epidermal growth factor (EGF) and phorbol 12-myristate 13-acetate (PMA) (Fig. 3c). The changes in the scaling of chromatin packing density due to a perturbation were assessed using PWS microscopy on live cells while the consequential changes in gene transcription were evaluated using microarray mRNA sequencing. Here, PWS microscopy was used to quantify the nanoscale (20–350 nm) heterogeneity of chromatin packing density averaged throughout the nucleus. This range of structural length scales corresponds to genomic distances from the Kbp to the Mbp range. The produced signal, Σ, is a result of the heterogeneity of the spatial variations in chromatin density within each diffraction-limited voxel, and is proportional to D: Σ ∝ (D − D0), where D0 ≈ 1.5043. As shown by equation (5), the influence of the change in the packing-density scaling of chromatin on gene expression depends on: (1) the average initial (that is, preceding the perturbation) expression rate determined by m, (2) the initial D, (3) the upper length-scale of packing-density scaling of chromatin , (4) gene length L, and (5) the size of the interaction volume (see Supplementary Section 1 for the derivation). These parameters were obtained experimentally and from the simulations: initial gene expression and D for each condition were obtained by microarray and PWS microscopy measurements respectively11,44, was assumed to correspond to the average size of a single chromosome, L was calculated as the average gene length for genes in the microarray data set, and the radius of the interaction volume was determined from the depletion distance between DNA and transcription factors from simulations (Supplementary equation (7))13,45.
Critically, the theoretical prediction of the model strongly matches the experimentally observed changes in expression (Fig. 3d). Thus, the combined effect of increases in D on transcription is to warp the genomic landscape towards a state where overexpressed genes are further upregulated and underexpressed genes are suppressed, which can be referred as transcriptional divergence. Furthermore, over 90% of the change in gene expression is captured by the model as the number of genes per group increases (> 50 genes), indicating that the scaling of chromatin packing density plays the predominant role in the collective response of tens to hundreds of genes (Fig. 3e). In relation to the diffuse network hierarchy that is present for most genes, this provides a key feature of macrogenomic engineering via the modulation of the physical structure of chromatin because it allows predictable regulation of gene expression for multiple genes simultaneously. As uncovered by the model, although individual genes still retain the capacity to respond to specific stimuli, the collective global behaviour of genes is dominated by alterations to the physical nanoenvironment.
To leverage the predictive capabilities of our model on the expression patterns of hundreds of genes, we next explored if controlling chromatin packing-density scaling could be used to modulate the available genomic information space. In brief, this genomic information space is the cumulative functional capacities present within an individual cell (intra-network heterogeneity or transcriptional divergence) or a population of cells (intercellular transcriptional heterogeneity). Analytically, our model shows that the variations in chromatin packing density determine intercellular transcriptional heterogeneity, H, which is defined as the standard deviation of the transcription rate of the same gene across a cell population (see Supplementary Section 1.3 for more detail):
| (6) |
Because ASA and increase monotonically with D (equations (2) and (3)), H also increases with D. The relative intercellular heterogeneity between two cell populations with different chromatin packing-density scaling properties, D1 and D2, is therefore (Supplementary equation (26)). This indicates that chromatin packing-density scaling is directly coupled to intercellular transcriptional heterogeneity and to the divergence in gene expression for critical processes, including metabolic regulation, proliferation, apoptosis, and differentiation, which is in agreement with the microarray data (Fig. 3f,g). Finally, the coefficient of variation of intercellular transcriptional heterogeneity also increases with D, where is the average rate of expression for the same gene across multiple cells (Supplementary equations (27), (28) and Supplementary Fig. 5). In summary, elevation of D augments both intracellular transcriptional divergence and intercellular transcriptional heterogeneity.
In this context, carcinogenesis may present a test bed for macrogenomic regulation. Indeed, increased chromatin packing-density fluctuations are a near-universal hallmark of early oncogenesis. The model described above would suggest that chromatin packing-density heterogeneity could facilitate tumorigenesis by expanding the genomic information space available to neoplastic cells to stabilize otherwise deleterious states46–56. By extension, this principle would also be expected to apply to the cellular response to cytotoxic chemotherapeutic stress, because increasing intra-network and intercellular transcriptional heterogeneity for functional processes (such as stress response, proliferation, and cell-cycle maintenance) would allow cells to stochastically develop chemotherapeutic resistance in real time8.
In brief, cytotoxic stressors can be overcome by numerous means and can depend on the capacity of cells to sample their genome to acclimate to the stressful environmental conditions. Since apoptotic and non-apoptotic decisions occur over a concomitant but separated timescale that spans several hours57, decreasing the accessible genomic information space is expected to shift behaviour toward the initial stress-response activity, that is, apoptosis. Conversely, rapidly increasing the information space provides a means for cells to arrive at one of a number of successful evasive mechanisms. Experimentally, intercellular transcriptional heterogeneity has so far been observed as a critical determinant of chemoevasion without a clear mechanistic basis58. However, as demonstrated by our model, increased scaling of chromatin packing density and the resulting density fluctuations can produce the observed transcriptional heterogeneity. In principle, this allows for a direct application of macrogenomic engineering to develop adjuvant agents as CPTs that would decrease the scaling of chromatin packing density, and would enhance the efficacy of cytotoxic chemotherapy by limiting information sampling encoded in the genome and reducing the fitness of cells during their response to cytotoxic chemotherapy.
To explore this hypothesis and the applicability of macrogenomic engineering for selecting CPT adjuvant agents, we tested if cytotoxic chemotherapeutic intervention did indeed produce increased chromatin fluctuations coupled to an expanded genomic information space (that is, increased intra-network and intercellular heterogeneity). In particular, we tested the effect of cytotoxic treatment on chromatin organization and transcriptional heterogeneity in five cell-line models of three gynaecological tumours by using a wide range of compounds: microtubule depolymerization inhibitors (paclitaxel or docetaxel), DNA intercalating agents (oxaliplatin), and nucleoside analogues (5-fluoruracil or gemcitabine). The three tumours were chosen based on their clinical aggressiveness: uterine leiomyosarcoma (MES-SA and mitoxantrone resistant MES-SA.MX2), ovarian carcinoma (A2780 and TP53 mutant clone A2780.M248), and triple-negative breast cancer (MDA-MB-231). As expected, cytotoxic intervention increases the heterogeneity of chromatin density Σ—and thus D—within 48 hours, independent of the cell-line model or of the mechanism of the chemotherapeutic agent (Fig. 4a–d and Supplementary Figs. 1 and 2).
Fig. 4. Chemotherapeutic stress increases variations in chromatin packing density.
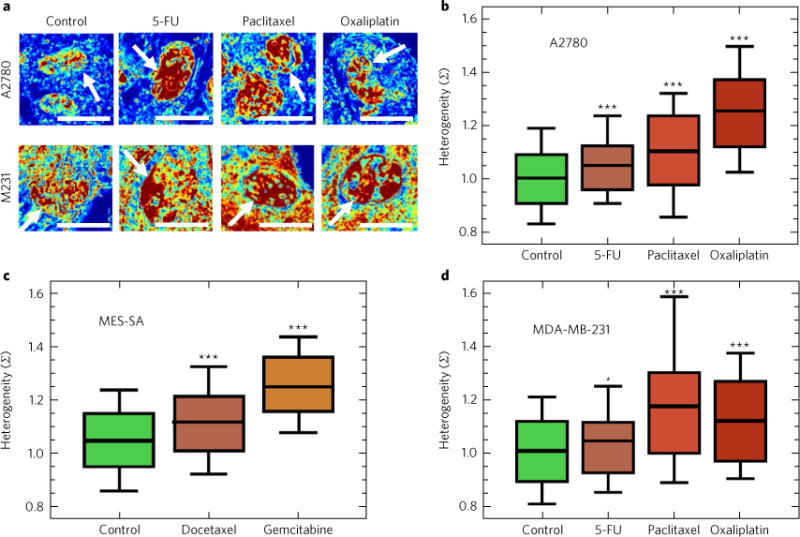
a, Representative PWS microscopy images of cell nuclei before and 72 (5-FU) or 48 (paclitaxel and oxaliplatin) hours after their exposure to cytotoxic chemotherapy for A2780 and MDA-MB-231 (M231) cells. Scale bars, 15 μm. Pseudo-colour: heterogeneity of chromatin packing density (Σ). Arrows: cell nuclei. b–d, Treatment of ovarian A2780 cells (P = 2.5 × 10⁻⁴, 1.9 × 10⁻⁷ and 2.8 × 10⁻²⁸) (b), uterine leiomyosarcoma MES-SA cells (P = 2.1 × 10⁻⁶ and 1.1 × 10⁻¹⁹) (c), and triple-negative breast cancer MDA-MB-231 cells (P = 2.5 × 10⁻², 1.6 × 10⁻⁴ and 3.9 × 10⁻⁵) (d) with cytotoxic chemotherapeutic agents (5-FU, paclitaxel and oxaliplatin) produces an increase in the intranuclear chromatin packing-density heterogeneity (Σ), independent of the mechanism of cytotoxic action. Significance was determined using Student’s t-test with unpaired, unequal variance on the average nuclear Σ normalized by the average Σ of the accompanying control group between the conditions. Box represents the 25–75% range of values and whisker represents the 10–90% range around the mean for N = 823 control, 145 5-FU, 132 paclitaxel and 101 oxaliplatin A2780 cells; N = 836 control, 102 docetaxel and 69 gemcitabine MES-SA cells; and N = 264 control, 81 5-FU, 36 paclitaxel and 59 oxaliplatin MDA-MB-231 cells (***P < 0.001, *P < 0.05).
By taking advantage of the fact that chromatin D is indeed predictably and directly coupled to the chemotherapeutic response, we explored whether CPT compounds that can rapidly (< 30 min) reduce chromatin packing-density fluctuations would act as adjuvant agents for chemotherapeutic efficacy. This short time point was chosen to avoid potential confounding from protein translation on chromatin structure. To test the macrogenomic engineering CPT approach, we selected two compounds that act on biological processes that were transformed by paclitaxel treatment: celecoxib (stress response) and digoxin (ion homeostasis). Using live cell PWS microscopy, we measured the transformation in chromatin-scaling within 30 minutes for A2780, A2780. M248 (M248), MES-SA and MES-SA.MX2 (MX2) cells treated with either digoxin or celecoxib. We focused on uterine leiomyosarcoma and ovarian carcinoma, as we had both a resistant and a sensitive subclone for each model. Notably, the response of each cell type to these compounds varied, but a substantive response was identifiable (Fig. 5a–d). In view of the differential response between CPT and chemotherapeutic agents at the level of variations in chromatin packing-density scaling, we next tested if these observations would extend into transcriptional heterogeneity.
Fig. 5. Chromatin protective agents rapidly decrease the spatial variations in chromatin packing density.
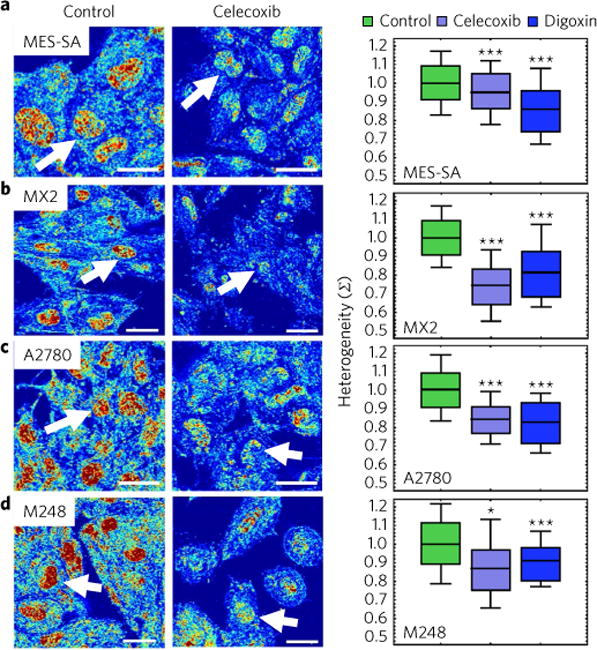
a–d, Representative PWS images (left) and quantification (right) of the effects of CPT agents on the variations of chromatin packing density for MES-SA (a), MES-SA. MX2 (MX2) (b), A2780 (c) and A2780.M248 (M248) (d) cells. Notably, variations of chromatin packing density for each cell line model have a differential response to CPT agents celecoxib (P = 3.9 × 10⁻³⁴, 1.5 × 10−53, 1.5 × 10⁻³⁰ and 1.3 × 10⁻³ for MES-SA, MX2, A2780 and M248 cells, respectively) and digoxin (P = 2.7 × 10⁻⁸, 7.6 × 10−69, 3.1 × 10−36 and 6.2 × 10⁻⁹ for MES-SA, MX2, A2780 and M248 cells, respectively). Significance was determined using Student’s t-test with unpaired, unequal variance on the average nuclear Σ normalized by the average Σ of the accompanying control group between the conditions. Box represents the 25–75% range and whisker represents the 10–90% range of values around the mean for N = 836 control, 275 celecoxib and 342 digoxin MES-SA cells; N = 558 control, 216 celecoxib and 252 digoxin MX2 cells; N = 823 control, 132 celecoxib and 130 digoxin A2780 cells; and N = 525 control, 36 celecoxib and 91 digoxin M248 cells (***P < 0.001, *P < 0.05). Scale bars, 15 μm. Pseudo-colour: heterogeneity of chromatin packing density (Σ). Arrows: cell nuclei.
Critically, analysis of single-cell RNA-seq data of MDA-MB-231 cells treated with paclitaxel in comparison to control cells10 shows the expected shift towards increased intercellular transcriptional heterogeneity, as well as towards intra-network transcriptional heterogeneity, owing to chemotherapeutic intervention. The shift affects numerous biological processes, as it includes genes involved in proliferation, apoptosis, oxidation/reduction, ion transport, and nucleosome assembly (Fig. 6a–c). Furthermore, analysis of RNA-seq data of digoxin-treated cells shows that decreases in the chromatin packing-density fluctuations through CPT agents likewise correlated with decreases in intercellular and intra-network transcriptional heterogeneity (Fig. 6a–c). This differential response between chemotherapeutic agents (taxols) increasing D and CPT agents (digoxin) decreasing D (Fig. 6a) paired with the expected changes to gene expression (Fig. 6b,c) supports our finding that controlling chromatin packing-density scaling can be used to modulate the genomic information space. By extension, we hypothesize that if the genomic information space is critical for chemotherapeutic evasion, we would observe that differential changes in chromatin packing-density scaling would extend to the adjuvant efficacy in vitro.
Fig. 6. Regulation of chromatin packing-density scaling modulates transcriptional heterogeneity.
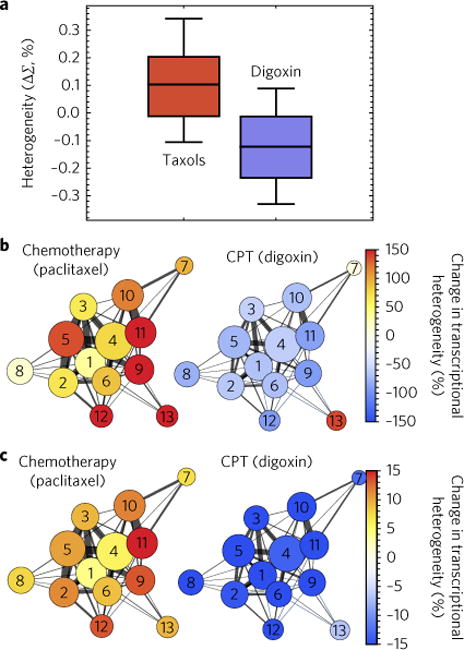
a, Comparison of the alterations in the variations of chromatin packing density due to taxol treatment (paclitaxel or docetaxel) in contrast to CPT agent digoxin for five cell line models (A2780, M248, MDA-MB-231, MES-SA and MX2). Notably, chemotherapeutic intervention produces increased variations in chromatin packing density whereas a CPT agent (digoxin) decreases variations in chromatin packing density. Box represents the 25–75% range and whisker represents the 10–90% range of values around the mean for N = 401 taxol-treated cells (132 A2780, 25 M248, 102 MES-SA, 106 MX2 and 36 MDA-MB-231 cells) and N = 815 digoxin-treated cells (130 A2780, 91 M248, 342 MES-SA and 252 MX2 cells). b,c, As expected, intercellular (b) and intra-network (c) transcriptional heterogeneity increases in cells treated with the chemotherapy agent and decreases in cells treated with the CPT agent for critical biological processes, including: (1) cell cycle, (2) apoptosis, (3) proliferation, (4) transcription, (5) signalling, (6) differentiation, (7) glycolysis, (8) translation, (9) ion transport, (10) metabolism, (11) oxidation/reduction, (12) stress response and (13) nucleosome assembly. Circle size represents the number of each genes belonging to a functional network/process and thickness the number of shared genes. Colour intensity represents the percentage change in transcriptional heterogeneity in paclitaxel-treated versus controls and in digoxin-treated cells versus controls (see the sections ‘RNA-Seq transcriptional analysis’, ‘Intranetwork transcriptional heterogeneity’ and ‘Intercellular transcriptional heterogeneity’ in the Methods for calculations).
We found that this is indeed the case. Under normal growth conditions, untreated ovarian A2780 cells rapidly grew into colonies and covered over 90% of the imaging field (Fig. 7a). As expected, 48 hour mono-treatment with IC50 concentration of paclitaxel resulted in cellular coverage of ~50% of the imaging field over the same growth period as the controls (Fig. 7b). Combination treatment of paclitaxel with a CPT agent (celecoxib) greatly enhanced the efficacy of chemotherapeutic intervention, with clearance approaching 100% (Fig. 7c), even though CPT agents on their own did not induce apoptosis (Supplementary Fig. 3). Furthermore, this effect extends across all the investigated cell lines, showing an increased efficacy even in models with intrinsic resistance such as the M248 and MX2 models (Fig. 7d). These effects were model- and adjuvant-independent, with the effective clearance centering on the total modification to chromatin packing-density scaling. Importantly, the magnitude of the decrease in chromatin packing-density heterogeneity by the CPT agents as measured by PWS microscopy strongly correlates with their increased efficacy to induce cancer-cell death when administered in combination with the chemotherapeutic compounds (Fig. 7e), resulting in highly linear behaviour that directly matches the level of decrease in chromatin packing-density scaling with the level of cellular inhibition (R2 > 0.99, Fig. 7e).
Fig. 7. Rapid modulation of chromatin packing density scaling by CPT agents greatly enhances chemotherapeutic efficacy.
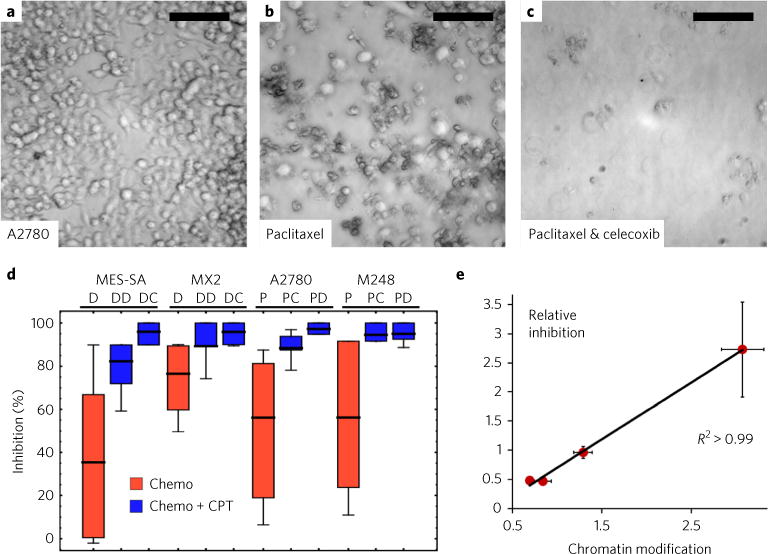
a–c, Representative images of untreated A2780 cells (a) grown for the same duration as cells treated with 5 nM paclitaxel (b) and cells co-treated with paclitaxel and celecoxib (c). Scale bars, 100 μm. d, Reduction of the scaling of chromatin packing density by CPT agents is directly linked to chemotherapeutic efficacy independent of cell line model and the primary molecular mechanism of action of the chemotherapy and the CPT compounds. D, docetaxel; DD, docetaxel + digoxin; DC, docetaxel + celecoxib; P, paclitaxel; PC, paclitaxel + celecoxib; PD, paclitaxel + digoxin. The mean was calculated from N = 45 D, 45 DD and 45 DC (MES-SA cells); N = 30 D, 30 DD and 30 DC (MX2); N = 60 P, 30 PC and 30 PD (A2780); and N = 60 P, 30 PC and 30 PD (M248) individual measurements of cell density per low-power field (410 μm2) for each condition, normalized by the average cell density per low-power field of the accompanying control group. Box represents the 25–75% range and whisker represents the 10–90% range of values around the mean. e, Relative elimination of cancer cells due to the co-treatment with chemotherapy and adjuvant CPT compounds versus the chemotherapy mono-treatment (relative inhibition) is strongly correlated to the efficacy of the CPT compounds to reduce chromatin packing-density scaling (chromatin modification) (R2 > 0.99). Relative inhibition was calculated by measuring the effective difference between the two CPT agents when paired with chemotherapy normalized by the therapeutic efficacy of chemotherapy alone (see ‘Viability analysis’ in the Methods for details).
Discussion
Supra-nucleosomal chromatin can have profound effects on gene expression by acting on accessibility, mobility and the binding affinities between reactant molecules. Previous investigations of the interaction between molecular behaviour and physical organization have focused on the regulators of local compaction/decompaction in the context of the expression of individual genes4,5. Whereas previous work has demonstrated the role of genetic modifications, histone post-translational modifications and genomic compartments in the regulation of the expression of individual genes, the role of the physical environment within the nucleus on the broad regulation of gene expression has not been previously explored. Here, we have described a physiochemical framework that maps the collective behaviour of multiple genes simultaneously on the basis of chromatin’s physical nanoenvironment (Fig. 2a–d). These capabilities are derived from experimental evidence indicating that chromatin is the dominant crowder within the nucleus. In this context, modulating the packing-density scaling of chromatin (D) is one mechanism to shape the nuclear physical nanoenvironment and alter global patterns in gene expression. In particular, we have demonstrated that macrogenomic engineering can control the transcriptional activity of many genes simultaneously and can be applied to the selection of adjuvant compounds to increase the efficacy of chemotherapeutic agents in vitro. Physiochemical modulation of the chromatin nanoenvironment influences patterns in gene expression owing to the sensitivity of genes to changes in the local physical conditions.
Although previous work investigating supra-nucleosomal organization has shown that gene expression depends on gene localization into a compartment or outside of it, we have shown that both genes within compartments and those outside of them respond to the physical forces produced by the physical nanoenvironment (Fig. 2b,c). We integrated Brownian dynamics and Monte Carlo simulations of the chemical reactions governing transcription with analytical predictions of the change in global accessible surface area and of the variations in local density of chromatin packing. The combined model allows the analytical prediction of transcriptional consequences of changes in the power-law scaling of chromatin packing density. Although we consider chromatin as a power-law media because of recent experimental evidence, our predictions can be extended for any known auto-correlation function describing the structural relationship between smaller and larger structures within the nucleus. Even in non-fractal conditions, both the ASA and variations in density monotonically increase as a function of D (Supplementary Fig. 4). Critically, the results from the model are in strong agreement with experimental results obtained through a combination of microarray measurements of gene expression and of live-cell PWS microscopy of the cell’s physical structure. The model appears to be best equipped to explain collective patterns in gene expression, and ultimately becomes the dominant predictor of expression patterns for larger groups of genes (> 50; Fig. 3e). At the level of transcription, the observed collective behaviour is anisotropic and monotonic, with highly expressed genes benefiting from increased variations in chromatin packing density and underexpressed genes responding conversely.
A major functional consequence of this asymmetric response is the transformation of the genomic information space, as the level of intercellular transcriptional heterogeneity (Fig. 3f), genomic divergence (Fig. 3d,g) and intra-network transcriptional heterogeneity (Fig. 3g) relate directly to chromatin packing-density scaling (Fig. 3c,f). As this intercellular transcriptional heterogeneity is a major factor in chemotherapeutic resistance, we predicted that: (1) cytotoxic chemotherapeutic intervention would produce increased variations in chromatin packing density, and (2) agents could be predictably selected as adjuvants based on their capacity to reverse this effect. As predicted, treatment with cytotoxic chemotherapeutic compounds selected for cells with increased chromatin packing-density heterogeneity independent of the cell line model (ovarian, breast and sarcoma) and of the mechanism of the chemotherapeutic agent (DNA intercalators, microtubule assembly inhibitors and DNA analogues). Furthermore, the transformation of chromatin towards increased packing-density fluctuations corresponded with increased intra-network and intercellular transcriptional heterogeneity as demonstrated by single-cell RNA sequencing. As these findings are in strong agreement with our model predictions, we therefore hypothesized that compounds that could reverse this process (decrease chromatin packing-density heterogeneity) at short time-scales (< 30 min) would increase the efficacy of existing chemotherapies.
We tested this hypothesis by examining the effects of two compounds that act on processes that demonstrated increased intercellular and intra-network transcriptional heterogeneity during paclitaxel treatment: stress response (celecoxib) and ion homeostasis (digoxin). Both of these compounds have some anti-neoplastic inhibitory effects; however, our results suggest that they also modulate chromatin packing density (Fig. 5). Indeed, we observed that the efficacy of these agents as adjuvants depends in large part on their capability to modulate chromatin packing-density heterogeneity (Fig. 7d,e). For example, the ovarian carcinoma cells, A2780 and M248, had a robust decrease in the intranuclear variations in chromatin packing density for both digoxin and celecoxib, and showed a marked enhancement in clearance for both adjuvants. Critically, the adjuvant efficacy is directly linked (R2 > 0.99) to the effect on chromatin, with the level of decrease in the variations of chromatin packing density linearly matching cellular death. Although these results are strongly in agreement with the model, it is impossible to rule out the presence of secondary mechanisms that could produce the observed adjuvant efficacy. However, the robust agreement between the observed changes in gene expression and the predictions of our model (Fig. 3), the effect of chemotherapeutics on transcriptional and chromatin packing-density heterogeneity (Fig. 4), the effects of CPT agents on decreasing both transcriptional and chromatin packing-density heterogeneities (Figs. 5 and 6), and a robust agreement between the ability of CPT agents to reduce chromatin packing-density heterogeneity and the synergistic lethality imparted by these agents when administered in combination with cytotoxic chemotherapy (Fig. 7) support the overall potential of macrogenomic engineering for modulating chromatin packing density.
Outlook
We have shown that macrogenomic engineering can predictably modulate global patterns in gene expression by controlling the physiochemical environment within the cell’s nucleus. Whole-transcriptome manipulation based on the control of the physiochemical nanoenvironment of chromatin should be widely applicable to address many illnesses, including cancer, inflammatory disorders and autoimmune diseases. Macrogenomic engineering could complement gene-editing techniques: whereas the latter work at the level of the linear genetic code and thus target individual genes, the regulation of chromatin packing density affects global patterns of gene expression. Pairing gene editing and macrogenomic engineering may allow for the hitherto unachieved capacity to control the overall behaviour of biological systems. The joint application of genomic editing and macrogenomic engineering could significantly enhance existing capabilities to regulate biological behaviour in complex systems where global transcriptional reprogramming takes place, including pathologies related to atherosclerosis, neurodegeneration, wound repair, oncology and inflammation. Whereas genome-editing tools would supply the capacity to create new proteomic states, macrogenomic engineering is inherently reversible and can thus support the intrinsic capabilities of an organism by increasing or decreasing the access to such states.
Methods
Cell culture
Leiomyosarcoma (MES-SA and MES-SA.MX2) and breast (MDA-MB-231) cell lines were purchased from ATCC. Ovarian (A2780 and A2780.M248) cell lines were a gift from C.-P. Huang Yang and obtained from the lab of E. de Vries at Albert Einstein College of Medicine. MES-SA cells were cultured in McCoy’s 5a Modified Medium (ThermoFisher Scientific, Waltham, MA, no. 16600108), MES-SA.MX2 cells were cultured in 1:1 Waymouth’s MB 752/1 Medium (ThermoFisher Scientific, Waltham, MA, no. 11220035) and McCoy’s 5a Modified Medium, MDA-MB-231 cells were cultured in DMEM (ThermoFisher Scientific, Waltham, MA, no.11965118), and A2780 and A2780.M248 cells were cultured in RPMI-1640 Medium (ThermoFisher Scientific, Waltham, MA, no. 11875127). All culture media was supplemented with 10% FBS (ThermoFisher Scientific, Waltham, MA, no. 16000044).
All chemotherapeutic agents and potential chromatin protective therapy (CPT) agents were purchased from Sigma Aldrich, St. Louis, Mo.: paclitaxel (T7191, Sigma), oxaliplatin (O9512, Sigma), 5-fluorouracil (F6627, Sigma), gemcitabine (G6423, Sigma), docetaxel (01885, Sigma), celecoxib (PZ0008, Sigma) and digoxin (D6003, Sigma). All compounds were dissolved in anhydrous DMSO (ThermoFisher Scientific, Waltham, MA, no. D12345).
Before imaging, cells were cultured in 35 mm glass bottom petri dishes (Cellvis, Mountain View, CA) until 60–85% confluent. All cells were given at least 24 hours to re-adhere prior to pharmacological treatment. CPT-treated cells were given at least 24 hours to adhere after trypsinization and treated for 30 minutes prior to imaging with either celecoxib (75 μM) or digoxin (100 nM). Chemotherapy treated cells were treated for at least 48 hours prior to imaging with paclitaxel (48 h, 5 nM unless otherwise specified), oxaliplatin (48 h, 15 μm), 5-fluorouracil (72 h, 500 nM), docetaxel (48 h, 5 nM), or gemcitabine (48 h, 50 nM). Each population of treated cells measured by partial wave spectroscopic (PWS) microscopy was compared to a control-treated population of the same cell type that had been plated on the same day with the same seeding density as the treated cells. All cells were maintained and imaged at physiological conditions (5% CO2 and 37 °C) for the duration of the experiment. All cell lines were tested for mycoplasma contamination with Hoechst 33342 within the past year. Experiments were performed on cells from passage 5–20.
Partial wave spectroscopic (PWS) microscopy and in vitro treatments
Imaging was performed on commercial inverted microscope (Leica DMIRB) using a Hamamatsu Image-EM CCD camera C9100-13 coupled to a liquid crystal tunable filter (LCTF; CRi Woburn, MA) to acquire mono-chromatic spectrally resolved images that range from 500–700 nm at 1 nm intervals produced by a broad band illumination provided by an Xcite-120 LED Lamp (Excelitas, Waltham, MA). These spectrally resolved images were normalized by the incident light reflection produced from the glass-media interface by taking an independent reference from a field of view without cells. A low-pass Butterworth filter was applied to reduce spectral noise prior to the calculation of Σ at each pixel. Σ was calculated as per equations and algorithms described in detail in ref. 11.
Significance was determined using Student’s t-test with unpaired, unequal variance on the average nuclear Σ normalized by the average Σ of the accompanying control group between the conditions indicated in the experiment using Microsoft Excel (Microsoft, Redmond, Washington). Significance threshold for all comparisons was set to 0.05/N to account for multiple comparisons with the respective control groups, where n is the number of groups. For example, significance for chemotherapy treated A2780 cells was 0.05/3 as comparisons were made between control cells and 5FU, paclitaxel, and oxaliplatin-treated cells. All PWS measurements were performed at least in triplicate and resulted in the analysis of the following number of cells: A2780 cells: 823 control, 132 paclitaxel-, 145 5-FU-, 101 oxaliplatin-, 132 celecoxib- and 130 digoxin-treated; A2780.M248 cells: 525 control, 45 paclitaxel-, 100 5-FU-, 85 oxaliplatin-, 36 celecoxib- and 91 digoxin-treated; MES-SA cells: 836 control, 102 docetaxel-, 69 gemcitabine-, 275 celecoxib- and 342 digoxin-treated; MES-SA.MX2 cells: 558 control, 106 docetaxel-, 103 gemcitabine-, 216 celecoxib- and 252 digoxin-treated; MDA-MB-231 cells: 264 control, 36 paclitaxel-, 81 5-FU- and 59 oxaliplatin-treated. In total, nanoscale measurements were collected from 5,644 cells.
Each individual experiment consists of 5–10 independent fields of view for analysis with variations in the size and density of cells accounting for the variability in total cell counts for each group. All PWS microscopy measurements were performed at least in triplicate. All pseudo-coloured live cell PWS images were produced using Matlab v. 2015b using the Jet colour scheme with Σ scaled from 0.01 to 0.065.
Central values displayed in all applicable figures represent the mean with error bars that represent the standard error of measurements. The number of cells analysed was estimated to achieve a 95% confidence level given the expected difference between the treatment group and the controls. Experiments were blinded when assessing the outcome of the treatment to the cells during PWS microscopy. Each cell population followed an approximately normal distribution with an average standard deviation that was 15 ± 2% of the mean.
Flow cytometry
Apoptotic induction was measured by flow cytometry (BD LSRII at the Northwestern Flow Cytometry Core) using CellEvent Caspase-3/7 Green Detection Reagent and Hoechst 33342 (all ThermoFisher Scientific, Waltham, MA). In brief, cells were trypsinized and immediately stained with 2 μM Caspase-3/7 and 4 μM Hoechst 33342 for 30 min. Cells were then centrifuged for 5 minutes at 500g, washed with PBS, and resuspended in 1 ml of fresh media. Mock-stained cells were collected under the same preparation conditions. Flow cytometry was performed on the following groups of A2780 cells: unstained controls cells, stained control cells, stained 48 hour celecoxib-treated cells and stained 48 hour digoxin-treated cells. 20,000 cells were collected by forward and side scattering channels for each group, with illumination intensities set for all conditions for Hoechst 33342 and Cas3/7 staining laser lines to minimize autofluorescence produced from unstained cells. Analysis of flow cytometry was performed using open source Python software package, FlowCytometeryTools 0.4.5. Gates were set for Cas3/7 staining and Hoechst 33342 to minimize false positives from unstained cells (< 0.1% of total). Percentage of apoptotic cells was assessed as the ratio of Cas3/7 + cells divided by the population of Hoechst 33342 positive cells. Error bars represent uncertainty based on ± 10% change in gating thresholds.
Viability analysis
Relative elimination between two CPT compounds for a particular cell line model was calculated based on the relative population clearance adjusted for the efficacy of monotherapy. To quantify the relative elimination of the cells in response to chemotherapeutic agents alone or in combination with potential CPT agents, we measured the cell plate density using transmission microscopy of the dish for an area spanning between 600,000 to 2,500,000 μm2. These measurements were obtained using either a 40× or 20× air objective prior to the acquisition of PWS microscopy measurements of the population for three independent petri dishes for each condition group. The added elimination efficacy due to the co-treatment with CPT compound k and chemotherapy drug α relative to the elimination produced by the chemotherapy drug alone (Iα) was calculated as ln((1 − Iα)/(1 − Iαk)), where Iαk is the co-treatment efficacy. Relative CPT-added elimination (‘relative elimination’ in Fig. 7e) between two CPT compounds (k and n) was calculated as ln((1 − Iα)/(1 − Iαk))/ln((1 − Iα)/(1 − Iαn)).
Relative modification of chromatin packing-density heterogeneity between two CPT compounds k and n (‘chromatin modification’ in Fig. 7e was calculated as , where and are the average intranuclear chromatin heterogeneities for cells before and 30 min after the application of compound k, respectively, and Sc and Sk are the corresponding cell population entropy values. Entropy was calculated from each cell population cohort. Σ values for each cell were rounded to the nearest first decimal place prior to calculation. The Shannon entropy, S, was calculated as S = − Σipi × ln(pi), where pi is the probability of a cell of a given Σ value occurring within the population and Σi is the summation sign. The measured entropy was: MES-SA controls, 1.76; MES-SA celecoxib, 1.86; MES-SA digoxin, 1.707; MX2 controls, 1.758; MX2 celecoxib, 1.677; MX2 digoxin, 1.908; A2780 controls, 1.728; A2780 celecoxib, 1.604; A2780 digoxin, 1.428; M248 controls, 1.92; M248 celecoxib, 1.577; and M248 digoxin, 1.75.
Microarray transcriptional analysis
Cells were serum starved for 5 hours prior to being treated with 10% FBS (SE), 100ng/ml epidermal growth factor (EGF), or 100 ng ml−1 phorbol 12-myristate 13-acetate (PMA). Live-cell PWS microscopy measurements were performed on HT-29 cells grown on 5 mm glass bottom petri dishes (Cell Vis) and serum starved for 5 hours before and after stimulation59. Changes in gene expression for each treatment group were measured using Illumina human HG12-T microarray chips of mRNA collected by TRIzol isolation (Life Technologies, Carlsbad California) from 10 mL petri dishes. Quality check and the probe level processing of the Illumina microarray data were further made with R Bioconductor package, lumi by the Northwestern Genomics Core60. Analysis of network heterogeneity was performed on 2445 differentially expressed genes using Mathematica v10.
For gene network analysis, a total of 471 genes were selected based on their ontology groups (Cell Cycle, Proliferation, Apoptosis, Transcription, Signal Transduction or Cell Differentiation) using inbuilt GenomeData, matching the annotated genes with these processes. Transcriptional heterogeneity for each process was measured by analysing the relative gene expression for each gene in reference to the expression of the serum starved cells. Relative differences in chromatin packing-density heterogeneity were measured 30 minutes after a stimulation (SE, EGF or PMA) was applied using PWS microscopy on the same cells before and after the stimulation. The difference between the two measured values of Σ (ΔΣ) was obtained from over 50 cells per condition and was observed to be on average: 0.1% for SE cells, 0.77% for EGF cells and 8.49% for PMA cells.
RNA-seq transcriptional analysis
RNA sequencing data obtained from NCBI GEO from data produced previously10 for MDA-MB-231 cells treated with paclitaxel, as well as for androgen-resistant LNCap cells treated with diogxin61, were aligned to human reference genome hg38 using HISAT2, STRINGTIE, and BALLGOWN using the methods described previously62. Sequencing results for each gene were calculated as fragments per kilobase pair per million reads (FPKM). Variants for the same gene were averaged for each cell. Genes with no expression for all cells were not considered in downstream analysis. GO ontologies available from Mathematica v.10 using inbuilt GenomeData were used to classify genes according to the biological process in which they are involved.
Intra-network transcriptional heterogeneity
FPKM values for each condition were averaged across the five individual replicates for paclitaxel-treated cells and three replicates for digoxin-treated cells which were rounded to the nearest tenth of a decimal. To approximate the change in the genomic information space at the level of intra-network transcriptional heterogeneity, the entropy, S = − Σkpkln(pk), where pk is the probability of an observed expression value, was calculated for genes belonging to the listed biological processes. Size of each circle represents the relative number of genes belonging to each process and thickness of connecting lines indicates number of shared genes for each data set (paclitaxel versus digoxin). Colour intensity represents the percentage change in entropy for the paclitaxel or digoxin-treated cells in comparison to the untreated controls for each respective group
Intercellular transcriptional heterogeneity
FPKM values for each cell were rounded to the nearest tenth of a decimal as described above. To approximate the change in the genomic information space at the level of intercellular transcriptional heterogeneity, the variance in expression for each gene was calculated across the 5 replicates of paclitaxel-treated cells and the three replicates of the digoxin-treated cells. For each process, the median variance was calculated in order to account for the presence of large outliers that could skew the mean. Size of each circle represents the relative number of genes belonging to each process and thickness of connecting lines indicates number of shared genes. Colour intensity represents the percentage change in median variance for the paclitaxel or digoxin-treated cells in comparison to the untreated controls for each respective group.
In addition, the variance in expression was examined for individual oncogenic genes and chromatin remodelling genes, showing an increased in intercellular transcriptional heterogeneity due to paclitaxel treatment for MYC, KLF4, p21, NOTCH2, p53, BRCA1, BAX, BAK1, MXD1, EZH2, Arid1a, Brg1, SUZ12, SUV39H1, BRD8, JARID2, JMJD1C, NuA4 complex (EP400, RUVBL2, MORF4L1, YEATS4), SMYD3, L3MBTL2, RNF20, NCOR1 and GSK3b.
Supplementary Material
Acknowledgments
This work has been supported by the National Science Foundation grant EFRI-1240416, the National Science Foundation Graduate Research Fellowship grant DGE-0824162, National Institutes of Health T32 training grants T32GM008152 and T32HL076139, the Lefkofsky Innovation Award, The Robert H. Lurie Comprehensive Cancer Center Translational Bridge Award, the Chicago Biomedical Consortium with support from the Searle Funds at The Chicago Community Trust, the National Institute of Health through the Chicago Region Physical Science Oncology Center U54CA193419, as well as grants R01CA200064, R01CA165309, and R01EB016983. Flow Cytometry was performed by the Northwestern University Flow Cytometry Facility, which has received support from NCI CA060553.
Footnotes
Life Sciences Reporting Summary
Further information on experimental design and reagents is available in the Life Sciences Reporting Summary.
Code availability
Code for generating the output for the Monte Carlo and Brownian dynamics simulations and for the predicted and experimental results of the chromatin packing macromolecular crowding (CPMC) model can be found at GitHub: https://github.com/BiophotonicsNU/macrogenomics.
Data availability
The authors declare that all data supporting the findings of this study are available within the paper and its Supplementary Information. Source data for the figures are available from the authors upon request. RNA-seq data are available from the NCBI GEO database from ref. 10, accession number SRP040309, and from ref. 61, accession number GSE35126. Microarray source data for Fig. 3 and Supplementary Fig. 5 have been provided in Supplementary Table 1. Normalized Σ values for Figs. 4 and 5 as well as Supplementary Figs. 1 and 2 have been provided in Supplementary Table 2.
Author contributions
T.V.O., A.P.M., H.K.R., I.S., S.S. and V.B. conceived the research; L.C., J.E.C. and V.B. developed the PWS instrumentation; G.M.B., W.W., L.M.A., A.K., S.G. and D.V. performed the experiments, molecular dynamics simulations and mathematical modelling; Andrey Ugolkov (A.U.) and Daniel D. Billadeau (D.D.B.) contributed to the design of experiments; G.M.B., W.W., L.M.A. and V.B. wrote the original draft; G.M.B., L.M.A., L.C., A.K., S.G., J.E.C., B.-L.L.S., T.V.O., H.K.R., I.S., S.S. and V.B. reviewed and edited the paper.
Competing interests
The authors declare no competing financial interests.
Additional information
Supplementary information is available for this paper at https://doi.org/10.1038/s41551-017-0153-2.
Reprints and permissions information is available at www.nature.com/reprints.
Correspondence and requests for materials should be addressed to I.S. or V.B.
Publisher’s note: Springer Nature remains neutral with regard to jurisdictional claims in published maps and institutional affiliations.
References
- 1.Collins FS. Shattuck lecture—medical and societal consequences of the Human Genome Project. N Engl J Med. 1999;341:28–37. doi: 10.1056/NEJM199907013410106. [DOI] [PubMed] [Google Scholar]
- 2.Bailey JN, Pericak-Vance MA, Haines JL. The impact of the human genome project on complex disease. Genes. 2014;5:518–535. doi: 10.3390/genes5030518. [DOI] [PMC free article] [PubMed] [Google Scholar]
- 3.Forbes SA, et al. COSMIC: exploring the world’s knowledge of somatic mutations in human cancer. Nucleic Acids Res. 2015;43:805–811. doi: 10.1093/nar/gku1075. [DOI] [PMC free article] [PubMed] [Google Scholar]
- 4.Iwafuchi-Doi M, Zaret KS. Pioneer transcription factors in cell reprogramming. Genes Dev. 2014;28:2679–2692. doi: 10.1101/gad.253443.114. [DOI] [PMC free article] [PubMed] [Google Scholar]
- 5.Zhang Z, Pugh BF. High-resolution genome-wide mapping of the primary structure of chromatin. Cell. 2011;144:175–186. doi: 10.1016/j.cell.2011.01.003. [DOI] [PMC free article] [PubMed] [Google Scholar]
- 6.Lupianez DG, et al. Disruptions of topological chromatin domains cause pathogenic rewiring of gene-enhancer interactions. Cell. 2015;161:1012–1025. doi: 10.1016/j.cell.2015.04.004. [DOI] [PMC free article] [PubMed] [Google Scholar]
- 7.Franke M, et al. Formation of new chromatin domains determines pathogenicity of genomic duplications. Nature. 2016;538:265–269. doi: 10.1038/nature19800. [DOI] [PubMed] [Google Scholar]
- 8.Almassalha LM, et al. The greater genomic landscape: the heterogeneous evolution of cancer. Cancer Res. 2016;76:5605–5609. doi: 10.1158/0008-5472.CAN-16-0585. [DOI] [PMC free article] [PubMed] [Google Scholar]
- 9.Lynch HT, Rendell M, Shaw TG, Silberstein P, Ngo BT, Commentary on Almassalha et al. The greater genomic landscape: the heterogeneous evolution of cancer. Cancer Res. 2016;76:5602–5604. doi: 10.1158/0008-5472.CAN-16-2319. [DOI] [PubMed] [Google Scholar]
- 10.Lee MC, et al. Single-cell analyses of transcriptional heterogeneity during drug tolerance transition in cancer cells by RNA sequencing. Proc Natl Acad Sci USA. 2014;111:4726–4735. doi: 10.1073/pnas.1404656111. [DOI] [PMC free article] [PubMed] [Google Scholar]
- 11.Almassalha LM, et al. Label-free imaging of the native, living cellular nanoarchitecture using partial-wave spectroscopic microscopy. Proc Natl Acad Sci USA. 2016;113:E6372–E6381. doi: 10.1073/pnas.1608198113. [DOI] [PMC free article] [PubMed] [Google Scholar]
- 12.Kim JS, Backman V, Szleifer I. Crowding-induced structural alterations of random-loop chromosome model. Phys Rev Lett. 2011;106:168102. doi: 10.1103/PhysRevLett.106.168102. [DOI] [PubMed] [Google Scholar]
- 13.Matsuda H, Putzel GG, Backman V, Szleifer I. Macromolecular crowding as a regulator of gene transcription. Biophys J. 2014;106:1801–1810. doi: 10.1016/j.bpj.2014.02.019. [DOI] [PMC free article] [PubMed] [Google Scholar]
- 14.Morelli MJ, Allen RJ, Wolde PRT. Effects of macromolecular crowding on genetic networks. Biophys J. 2011;101:2882–2891. doi: 10.1016/j.bpj.2011.10.053. [DOI] [PMC free article] [PubMed] [Google Scholar]
- 15.Hansen MM, et al. Macromolecular crowding creates heterogeneous environments of gene expression in picolitre droplets. Nat Nanotechnol. 2016;11:191–197. doi: 10.1038/nnano.2015.243. [DOI] [PMC free article] [PubMed] [Google Scholar]
- 16.Richter K, Nessling M, Lichter P. Macromolecular crowding and its potential impact on nuclear function. Biochim Biophys Acta. 2008;1783:2100–2107. doi: 10.1016/j.bbamcr.2008.07.017. [DOI] [PubMed] [Google Scholar]
- 17.Ou HD, et al. ChromEMT: Visualizing 3D chromatin structure and compaction in interphase and mitotic cells. Science. 2017;357:eaag0025. doi: 10.1126/science.aag0025. [DOI] [PMC free article] [PubMed] [Google Scholar]
- 18.Fudenberg G, Getz G, Meyerson M, Mirny LA. High order chromatin architecture shapes the landscape of chromosomal alterations in cancer. Nat Biotechnol. 2011;29:1109–1113. doi: 10.1038/nbt.2049. [DOI] [PMC free article] [PubMed] [Google Scholar]
- 19.Metze K. Fractal dimension of chromatin: potential molecular diagnostic applications for cancer prognosis. Expert Rev Mol Diagn. 2013;13:719–735. doi: 10.1586/14737159.2013.828889. [DOI] [PMC free article] [PubMed] [Google Scholar]
- 20.Zack TI, et al. Pan-cancer patterns of somatic copy number alteration. Nat Genet. 2013;45:1134–1140. doi: 10.1038/ng.2760. [DOI] [PMC free article] [PubMed] [Google Scholar]
- 21.Boettiger AN, et al. Super-resolution imaging reveals distinct chromatin folding for different epigenetic states. Nature. 2016;529:418–422. doi: 10.1038/nature16496. [DOI] [PMC free article] [PubMed] [Google Scholar]
- 22.Lieberman-Aiden E, et al. Comprehensive mapping of long-range interactions reveals folding principles of the human genome. Science. 2009;326:289–293. doi: 10.1126/science.1181369. [DOI] [PMC free article] [PubMed] [Google Scholar]
- 23.Mirny LA. The fractal globule as a model of chromatin architecture in the cell. Chromosome Res. 2011;19:37–51. doi: 10.1007/s10577-010-9177-0. [DOI] [PMC free article] [PubMed] [Google Scholar]
- 24.Bancaud A, Lavelle C, Huet S, Ellenberg J. A fractal model for nuclear organization: current evidence and biological implications. Nucleic Acids Res. 2012;40:8783–8792. doi: 10.1093/nar/gks586. [DOI] [PMC free article] [PubMed] [Google Scholar]
- 25.Lebedev DV, et al. Fractal nature of chromatin organization in interphase chicken erythrocyte nuclei: DNA structure exhibits biphasic fractal properties. FEBS Lett. 2005;579:1465–1468. doi: 10.1016/j.febslet.2005.01.052. [DOI] [PubMed] [Google Scholar]
- 26.Huet S, et al. Relevance and limitations of crowding, fractal, and polymer models to describe nuclear architecture. Int Rev Cell Mol Biol. 2014;307:443–479. doi: 10.1016/B978-0-12-800046-5.00013-8. [DOI] [PubMed] [Google Scholar]
- 27.Dong B, et al. Superresolution intrinsic fluorescence imaging of chromatin utilizing native, unmodified nucleic acids for contrast. Proc Natl Acad Sci USA. 2016;113:9716–9721. doi: 10.1073/pnas.1602202113. [DOI] [PMC free article] [PubMed] [Google Scholar]
- 28.Flory PJ. Principles of Polymer Chemistry. Cornell Univ. Press; Ithaca: 1953. [Google Scholar]
- 29.Gennes PGd. Scaling Concepts in Polymer Physics. Cornell Univ. Press; Ithaca: 1979. [Google Scholar]
- 30.Doi M, Edwards SF. The Theory of Polymer Dynamics. Vol. 73. Oxford Univ Press; Oxford: 1988. [Google Scholar]
- 31.Lieberman-Aiden E, et al. Comprehensive mapping of long-range interactions reveals folding principles of the human genome. Science. 2009;326:289–293. doi: 10.1126/science.1181369. [DOI] [PMC free article] [PubMed] [Google Scholar]
- 32.Rao SS, et al. A 3D map of the human genome at kilobase resolution reveals principles of chromatin looping. Cell. 2014;159:1665–1680. doi: 10.1016/j.cell.2014.11.021. [DOI] [PMC free article] [PubMed] [Google Scholar]
- 33.Dostie J, et al. Chromosome conformation capture carbon copy (5C): a massively parallel solution for mapping interactions between genomic elements. Genome Res. 2006;16:1299–1309. doi: 10.1101/gr.5571506. [DOI] [PMC free article] [PubMed] [Google Scholar]
- 34.Wu W, et al. Using electron microscopy to calculate optical properties of biological samples. Biomed Optics Exp. 2016;7:4749–4762. doi: 10.1364/BOE.7.004749. [DOI] [PMC free article] [PubMed] [Google Scholar]
- 35.Subramanian H, et al. Nanoscale cellular changes in field carcinogenesis detected by partial wave spectroscopy. Cancer Res. 2009;69:5357–5363. doi: 10.1158/0008-5472.CAN-08-3895. [DOI] [PMC free article] [PubMed] [Google Scholar]
- 36.Bancaud A, et al. Molecular crowding affects diffusion and binding of nuclear proteins in heterochromatin and reveals the fractal organization of chromatin. EMBO J. 2009;28:3785–3798. doi: 10.1038/emboj.2009.340. [DOI] [PMC free article] [PubMed] [Google Scholar]
- 37.Dong B, et al. Superresolution intrinsic fluorescence imaging of chromatin utilizing native, unmodified nucleic acids for contrast. Proc Natl Acad Sci USA. 2016;113:9716–9721. doi: 10.1073/pnas.1602202113. [DOI] [PMC free article] [PubMed] [Google Scholar]
- 38.Cherkezyan L, et al. Interferometric spectroscopy of scattered light can quantify the statistics of subdiffractional refractive-index fluctuations. Phys Rev Lett. 2013;111:033903. doi: 10.1103/PhysRevLett.111.033903. [DOI] [PMC free article] [PubMed] [Google Scholar]
- 39.Rogers JD, Radosevich AJ, Yi J, Backman V. Modeling light scattering in tissue as continuous random media using a versatile refractive index Correlation Function. IEEE J Sel Top Quantum Electron. 2013;20:7000514. doi: 10.1109/JSTQE.2013.2280999. [DOI] [PMC free article] [PubMed] [Google Scholar]
- 40.Cherkezyan L, Subramanian H, Backman V. What structural length scales can be detected by the spectral variance of a microscope image? Opt Lett. 2014;39:4290–4293. doi: 10.1364/OL.39.004290. [DOI] [PMC free article] [PubMed] [Google Scholar]
- 41.Rogers JD, Capoglu IR, Backman V. Nonscalar elastic light scattering from continuous random media in the Born approximation. Opt Lett. 2009;34:1891–1893. doi: 10.1364/ol.34.001891. [DOI] [PMC free article] [PubMed] [Google Scholar]
- 42.Schoenfelder S, et al. Preferential associations between co-regulated genes reveal a transcriptional interactome in erythroid cells. Nat Genet. 2010;42:53–61. doi: 10.1038/ng.496. [DOI] [PMC free article] [PubMed] [Google Scholar]
- 43.Cherkezyan C, et al. Review of interferometric spectroscopy of scattered light for the quantification of subdiffractional structure of biomaterials. J Biomed Optics. 2017;22:030901–030919. doi: 10.1117/1.JBO.22.3.030901. [DOI] [PMC free article] [PubMed] [Google Scholar]
- 44.Almassalha LM, et al. The global relationship between chromatin physical topology, fractal structure, and gene expression. Sci Rep. 2017;7:41061. doi: 10.1038/srep41061. [DOI] [PMC free article] [PubMed] [Google Scholar]
- 45.Kim JS, Szleifer I. Depletion effect on polymers induced by small depleting spheres. J Phys Chem C. 2010;114:20864–20869. [Google Scholar]
- 46.Subramanian H, et al. Optical methodology for detecting histologically unapparent nanoscale consequences of genetic alterations in biological cells. Proc Natl Acad Sci USA. 2008;105:20118–20123. doi: 10.1073/pnas.0804723105. [DOI] [PMC free article] [PubMed] [Google Scholar]
- 47.Damania D, et al. Role of cytoskeleton in controlling the disorder strength of cellular nanoscale architecture. Biophys J. 2010;99:989–996. doi: 10.1016/j.bpj.2010.05.023. [DOI] [PMC free article] [PubMed] [Google Scholar]
- 48.Roy HK, et al. Optical detection of buccal epithelial nanoarchitectural alterations in patients harboring lung cancer: implications for screening. Cancer Res. 2010;70:7748–7754. doi: 10.1158/0008-5472.CAN-10-1686. [DOI] [PMC free article] [PubMed] [Google Scholar]
- 49.Roy HK, Hensing T, Backman V. Nanocytology for field carcinogenesis detection: novel paradigm for lung cancer risk stratification. Future Oncol. 2011;7:1–3. doi: 10.2217/fon.10.176. [DOI] [PMC free article] [PubMed] [Google Scholar]
- 50.Damania D, et al. Nanocytology of rectal colonocytes to assess risk of colon cancer based on field cancerization. Cancer Res. 2012;72:2720–2727. doi: 10.1158/0008-5472.CAN-11-3807. [DOI] [PMC free article] [PubMed] [Google Scholar]
- 51.Konda VJ, et al. Nanoscale markers of esophageal field carcinogenesis: potential implications for esophageal cancer screening. Endoscopy. 2013;45:983–988. doi: 10.1055/s-0033-1344617. [DOI] [PMC free article] [PubMed] [Google Scholar]
- 52.Roy HK, et al. Nano-architectural alterations in mucus layer fecal colonocytes in field carcinogenesis: potential for screening. Cancer Prev Res. 2013;6:1111–1119. doi: 10.1158/1940-6207.CAPR-13-0138. [DOI] [PMC free article] [PubMed] [Google Scholar]
- 53.Stypula-Cyrus Y, et al. HDAC up-regulation in early colon field carcinogenesis is involved in cell tumorigenicity through regulation of chromatin structure. PLoS ONE. 2013;8:e64600. doi: 10.1371/journal.pone.0064600. [DOI] [PMC free article] [PubMed] [Google Scholar]
- 54.Cherkezyan L, et al. Nanoscale changes in chromatin organization represent the initial steps of tumorigenesis: a transmission electron microscopy study. BMC Cancer. 2014;14:189. doi: 10.1186/1471-2407-14-189. [DOI] [PMC free article] [PubMed] [Google Scholar]
- 55.Wali RK, et al. Higher-order chromatin modulator cohesin SA1 is an early biomarker for colon carcinogenesis: race-specific implications. Cancer Prev Res. 2016;9:844–854. doi: 10.1158/1940-6207.CAPR-16-0054. [DOI] [PMC free article] [PubMed] [Google Scholar]
- 56.Roy HK, et al. Nanocytological field carcinogenesis detection to mitigate overdiagnosis of prostate cancer: a proof of concept study. PLoS ONE. 2015;10:e0115999. doi: 10.1371/journal.pone.0115999. [DOI] [PMC free article] [PubMed] [Google Scholar]
- 57.Paek AL, Liu JC, Loewer A, Forrester WC, Lahav G. Cell-to-cell variation in p53 dynamics leads to fractional killing. Cell. 2016;165:631–642. doi: 10.1016/j.cell.2016.03.025. [DOI] [PMC free article] [PubMed] [Google Scholar]
- 58.Shaffer SM, et al. Rare cell variability and drug-induced reprogramming as a mode of cancer drug resistance. Nature. 2017;546:431–435. doi: 10.1038/nature22794. [DOI] [PMC free article] [PubMed] [Google Scholar]
- 59.Almassalha LM. Live cell partial wave spectroscopic microscopy: label-free imaging of the native, living cellular nanoarchitecture. 2016 doi: 10.1073/pnas.1608198113. Preprint at https://doi.org/10.1101/061747. [DOI] [PMC free article] [PubMed]
- 60.Du P, Kibbe WA, Lin SM. lumi: a pipeline for processing Illumina microarray. Bioinformatics. 2008;24:1547–1548. doi: 10.1093/bioinformatics/btn224. [DOI] [PubMed] [Google Scholar]
- 61.Li H, et al. Versatile pathway-centric approach based on high-throughput sequencing to anticancer drug discovery. Proc Natl Acad Sci USA. 2012;109:4609–4614. doi: 10.1073/pnas.1200305109. [DOI] [PMC free article] [PubMed] [Google Scholar]
- 62.Pertea M, Kim D, Pertea GM, Leek JT, Salzberg SL. Transcript-level expression analysis of RNA-seq experiments with HISAT, StringTie and Ballgown. Nat Protoc. 2016;11:1650–1667. doi: 10.1038/nprot.2016.095. [DOI] [PMC free article] [PubMed] [Google Scholar]
Associated Data
This section collects any data citations, data availability statements, or supplementary materials included in this article.