

Abstract
Wnt signaling is required for lineage commitment of glandular stem cells (SCs) during tracheal submucosal gland (SMG) morphogenesis from the surface airway epithelium (SAE). Whether similar Wnt-dependent processes coordinate SC expansion in adult SMGs following airway injury remains unknown. We found that two Wnt-reporters in mice (BAT-gal and TCF/Lef:H2B-GFP) are co-expressed in actively cycling SCs of primordial glandular placodes and in a small subset of adult SMG progenitor cells that enter the cell cycle 24 hrs following airway injury. At homeostasis, these Wnt reporters showed non-overlapping cellular patterns of expression in the SAE and SMGs. Following tracheal injury, proliferation was accompanied by dynamic changes in Wnt-reporter activity and the analysis of 56 Wnt-related signaling genes revealed unique temporal changes in expression within proximal (gland-containing) and distal (gland-free) portions of the trachea. Wnt stimulation in vivo and in vitro promoted epithelial proliferation in both SMGs and the SAE. Interestingly, slowly cycling nucleotide label-retaining cells (LRCs) of SMGs were spatially positioned near clusters of BAT-gal positive serous tubules. Isolation and culture of tet-inducible H2B-GFP LRCs demonstrated that SMG LRCs were more proliferative than SAE LRCs and culture expanded SMG-derived progenitor cells outcompeted SAE-derived progenitors in regeneration of tracheal xenograft epithelium using a clonal analysis competition assay. SMG-derived progenitors were also multipotent for cell types in the surface airway epithelium and formed gland-like structures in xenografts. These studies demonstrate the importance of Wnt signals in modulating SC phenotypes within tracheal niches and provide new insight into phenotypic differences of SMG and SAE SCs.
Graphical Abstract
Two distinct stem cell (SC) compartments in the mouse trachea include basal cells in the surface airway epithelium (SAE) and submucosal glands (SMGs). This research demonstrates that SCs from these two compartments have unique and overlapping properties that respond to dynamic changes in Wnt signaling following injury. Slowly cycling label retaining (LRC) SCs isolated from the SMGs had a greater proliferative capacity than SAE LRCs and glandular LRCs reside near Wnt-active tubules. Isolated glandular SCs had a greater regenerative capacity to reconstitute a denuded tracheal xenograft than SAE SCs, and only glandular SCs formed gland-like clones in xenografts and organoid cultures.
Introduction
Renewal of the airway epithelium occurs from tissue-specific stem cells (SC) that reside within region-specific niches. Signals in these niches regulate progenitors, which can self-renew and give rise to differentiated cells found within their epithelial compartments. In the lung, there are at least five region-specific SC niches [1]. These niches contribute to maintenance and regeneration of specific types of epithelia that are functionally distinct. The tracheobronchial surface airway epithelium (SAE) is a pseudostratified columnar epithelium, and the primary SCs for the SAE are basal cells located along the basement membrane [2–9]. Submucosal glands (SMGs) in the airway also contain SCs that are thought to contribute to regeneration of the SAE [10–15]. These tubuloacinar structures secrete mucus and serous fluids into the airway through ciliated ducts that are continuous with the SAE. The glandular epithelium includes multiple cell types including ductal, serous, mucous, and myoepithelial cells. It remains undetermined whether SCs in the SAE and SMGs are biologically distinct. Furthermore, the factors that regulate proliferation of SCs within the glandular compartment are poorly understood.
Fundamental differences in SC niche regulation within the SMG and SAE can likely be informed through an understanding of processes that establish each of these compartments during development. For example, elements specific to glandular development may be conserved in regulating adult SCs within the SMGs. Glandular morphogenesis in mice begins with the formation of placodes in the proximal trachea. In this context, primordial glandular SCs coalesce to form primitive glandular structures that develop into branched networks of secretary acini, tubules, and ducts [16–19]. Canonical Wnt/β-catenin signaling is necessary during early stages of SMG development through the activation of transcription factors in the Tcf/Lef-1 family. In particular, expression of Lymphoid Enhancer Binding Factor 1 (Lef-1) is upregulated in glandular placodes and is required for SMG development [20–22]. Moreover, the canonical Wnt ligand, Wnt3a, is required for the induction of Lef-1 within glandular placodes [22–24]. In addition, Wnt reporter mice show activation of canonical Wnt signaling in neonatal glandular placodes [21, 22]. Given that Wnt signaling is such an important aspect in coordinating primordial glandular precursors during gland development, we hypothesized that this biology is conserved for regulating adult SCs in the airway SMGs.
In the current study, we advance our understanding of how SCs from tracheal niches within the SMGs and SAE are biologically distinct and utilize Wnt signals to regulate proliferation following injury. Importantly, we demonstrate that SCs derived from SMGs are highly proliferative and multipotent for regenerating cell types in the SAE and also have the unique capacity to form gland-like structures in organoid culture and tracheal xenografts. These and other findings underscore the unique properties of glandular SCs and their niche, and also suggest new directions for therapeutically manipulating the regenerative capacity of the proximal airway.
Methods
Animals and naphthalene injury experiments
Experiments involving mice were performed according to protocols approved by the Institutional Animal Care and Use Committee of the University of Iowa. Wild-type C57BL/6, BAT-gal (B6.Cg-Tg(BAT-lacZ)3Picc/J), TCF/Lef:H2B-GFP (TCF/Lef1-HIST1H2BB/EGFP)61Hadj/J), Rosa26-FlxTomatoStopFlx-eGFP (Gt(ROSA)26Sortm4(ACTB-tdTomato,-EGFP)Luo/J), and Rosa26-rtTA/TetON:H2B-GFP (B6.Cg-Gt(ROSA)26Sortm1(rtTA*M2)Jae/J) crossed with Tg(tetO-HIST1H2BJ/GFP)47Efu/J) mouse strains were purchased from The Jackson Laboratory. Mice were injured with a single IP injection of 300 μg Naphthalene per gram bodyweight and pulsed with nucleotide labels as described in the Supplemental Methods.
Histology, immunofluorescence, and image analysis
Excised tracheae were embedded in OCT or were fixed in cold 4% paraformaldehyde (PFA) in PBS and cryoprotected at 4°C with graded sucrose/PBS solutions before being embedded in OCT. PFA-fixed frozen 8 μm sections were used for immunofluorescent staining with the primary antibodies listed in Supplementary Table S1 and detailed methods described in the Supplemental Methods. Enzymatic LacZ staining and other histochemical stains were performed as described in the Supplemental Methods. Image analysis was performed using ImageJ software and MetaMorph Software’s Multi Wavelength Cell Scoring Application Module (see Supplemental Methods).
In vitro and in vivo Wnt induction experiments
Tracheae from double transgenic mice possessing both BAT-gal and TCF/Lef:H2B-GFP reporter alleles were treated in vitro with BSA, Dkk1, or Wnt1/Wnt3a and evaluated for Wnt-reporter and Ki67 expression as described in the Supplemental Methods. In vivo recombinant adenovirus expression of Wnt3a was performed in mice possessing the BAT-gal allele and the Rosa26-FlxTomatoStopFlx-eGFP Cre reporter allele to assess both Wnt activity and transduction efficiency. See Supplemental Methods for more details.
SMG and SAE cell isolation, expansion, and seeding into organoid culture and tracheal xenografts
Glandular- and surface airway-derived epithelial cells from excised mouse tracheae were isolated using a sequential enzymatic digestion strategy similar to previous reports [25, 26]. Organoids were generated using methods as previously described [6] with modifications. For xenografts, isolated cells were expanded in the presence of Rho-kinase inhibitor as previously described [27] with modifications. SMG and SAE-derived cells from wild type mice or mice expressing tdTomato were mixed at various ratios and seeded into tracheal xenografts as previously described [16, 28–30]. See Supplemental Methods for more details.
Colony forming efficiency assay of LRCs
SMG and SAE cells were isolated as described above from Rosa26-rtTA/TetON:H2B-GFP mice 120 days after H2B-GFP induction and injury. GFP+ LRCs and GFP− cells were manually selected to create LRC-enriched and LRC-depleted pools of cells derived from SMGs or the SAE. 2 × 10³ cells of each cellular fraction were mixed with 2 × 10⁵ cells Rosa-tdTomato total tracheal epithelial cells and cultured at an air-liquid interface [31] prior to doxycycline induction and quantification of H2B-GFP-derived colonies. See Supplemental Methods for more details.
RNA quantification
Tracheal RNA expression was measured in double transgenic BAT-gal:TCF/Lef:H2B-GFP mice before and after naphthalene injury (1 and 5 days) using the QuantiGene Plex Assay Kit (Affymetrix) as described in the Supplemental Methods. Bead-based oligonucleotide probe sets detected transcripts for 56 genes effecting Wnt signaling, 9 cellular marker genes, 3 housekeeping genes, and LacZ and GFP reporters (Supplementary Table S2).
Results
Canonical Wnt signaling is highly regulated in glandular and surface airway epithelial cells of the adult mouse trachea
Given that Wnt signaling is critically important during SMG development, we interrogated Wnt signaling in adult BAT-gal and TCF/Lef:H2B-GFP mice (Fig. 1A). Both Wnt reporters were active in SMG placodes in 1-day-old trachea (Fig. 1B), consistent with the transcriptional induction of the Lef-1 gene in SMG placodes [10, 24]. By contrast, the activity of these reporters was non-overlapping and confined to microenvironments within the adult SMGs and SAE (Fig. 1C-F and Supporting Information Fig. S1). Clusters of cells expressing β-galactosidase from the BAT-gal transgene were observed in the SAE and were primarily composed of CK5+ basal cells (Supporting Information Fig. S1C). In the SMGs, BAT-gal positive cells also localized as clusters primarily within acini, but also within ducts (Fig. 1C-F and Supporting Information Fig. S1A,B). To evaluate whether expression from these Wnt reporters might be linked to β-catenin activation, we quantified the amount of activated nuclear β-catenin and Wnt-reporter expression within cells of SMG placodes (Supporting Information Fig. S2). Interestingly, the degree of nuclear β-catenin observed in SMG placode progenitors correlated with specific Wnt-reporter phenotypes. For example, cells positive for both TCF/Lef:H2B-GFP and BAT-gal contained levels of activated nuclear β-catenin that were significantly greater than all other Wnt-reporter classifications (P<0.001 to P<0.0001). Cells expressing TCF/Lef:H2B-GFP alone contained the next highest level of nuclear β-catenin as compared to dual negative cells (P<0.0001) and cells expressing BAT-gal alone had no enrichment of nuclear β-catenin as compared to dual negative cells. These data suggest that simultaneous activation of both Wnt-reporters in glandular progenitors gives rise to the greatest degree of canonical Wnt/β-catenin signaling. Such a finding is generally consistent with a requirement for canonical Wnt3a signaling during gland morphogenesis [24].
Figure 1. Wnt signals that are co-activated in primordial glandular stem cells demonstrate non-overlapping cellular patterns of activation in adult mouse SMGs.
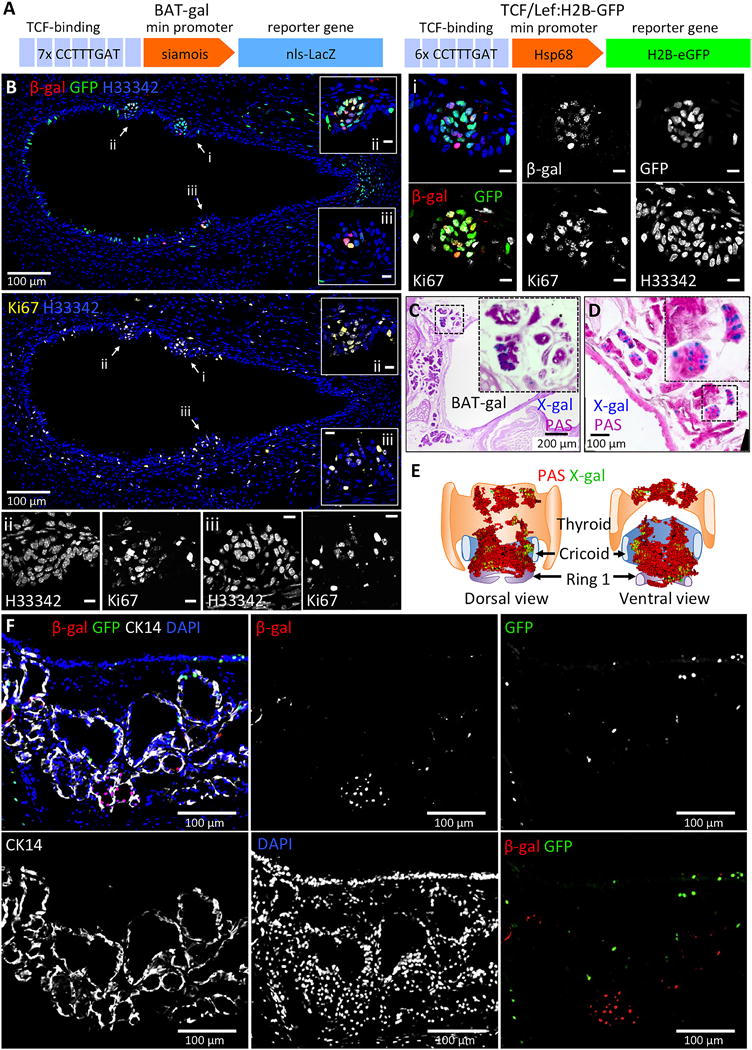
(A): Shown is a schematic of the Wnt-reporter transgenes in BAT-gal and TCF/Lef:H2B-GFP mice. (B): Representative tracheal section from a 1 day old mouse harboring both BAT-gal and TCF/Lef:H2B-GFP transgenes were immunofluorescently stained for β-Gal, GFP, and Ki67. Various channels are separated into different panels and pseudocolored as indicated. Several primordial gland placodes (PGPs) are marked with arrows and correspond to higher magnification images i-iii. Cells within PGPs display activation of BAT-gal and TCF/Lef:H2B-GFP and are enriched for Ki67+ proliferating cells. (C and D): Representative cross sections from BAT-gal tracheae were stained enzymatically with X-gal and counterstained with Periodic Acid Schiff’s (PAS) reagent to highlight glands. (E): 3D model constructed from serial BAT-gal tracheal sections stained with X-gal and PAS. Clusters of cells with active canonical Wnt-signaling (green) can be seen within SMGs (red) in the proximal trachea. (F): Representative tracheal section from an adult BAT-gal/TCF/Lef:H2B-GFP double transgenic mouse was immunofluorescently stained for β-Gal, GFP, and CK14 and demonstrates non-overlapping Wnt reporter expression. Scale bars represent 10 μm unless otherwise indicated.
Intα6+/Intβ4+/Lyz+ Wnt-active glandular cells cluster within a subset of serous tubules
To define the glandular cell type(s) displaying Wnt activation, we phenotyped clusters of BAT-gal+ cells in the SMGs (Supporting Information Fig. S3). Two phenotypic markers of SAE basal cells, cytokeratin 5 and 14, marked ~23% and ~3% of glandular BAT-gal+ cells, respectively. Approximately 98% and 96% of glandular BAT-gal+ cells were positive for Intα6 and Intβ4, respectively, which have both been shown to mark highly proliferative tracheal stem/progenitor cells in the SAE [32, 33]. Although Ngfr is a faithful marker of SAE basal cells, its expression in the SMGs is less extensive and did not mark an appreciable number of BAT-gal+ cells. However, ~18% of BAT-gal+ cells express αSMA, which marks glandular myoepithelial cells. Glandular BAT-gal+ cells did not localize to mucous tubules and did not express Muc5AC. Notably, the majority (~87%) of BAT-gal+ cells expressed lysozyme and thus would be classically defined as a subset of serous cells. Together these data suggest that Wnt signaling in murine SMGs is confined to non-mucous-producing acini and is activated in a subset of serous and myoepithelial cells, however, the majority of glandular BAT-gal+ cells do not express typical markers associated with basal cells in the SAE.
The tracheal SAE is regenerated in a proximal to distal fashion in mice after naphthalene injury
If SMGs contain SCs that contribute to the SAE, we hypothesized that following injury the tracheal SAE would regenerate in a proximal to distal fashion. To this end, we interrogated the dynamics of tracheal epithelial regeneration in naphthalene-injured mice by pulsing the mice with BrdU 1 hr prior to harvest on days post-injury (DPI) (Supporting Information Fig. S4). There was little BrdU incorporation in the trachea prior to and at 1 DPI. At 3 DPI, BrdU incorporation was first observed in the surface and glandular epithelium at cartilage ring 1-2 (C1-C2) of the trachea. This coincided with the emergence of CK14 positive cells in the SAE above the SMGs. In this C1-C2 region of the trachea, there was a significant decline in the proliferative index with time post-injury (Pearson r=−0.52, P=0.0037) (Supporting Information Fig. S4B). By contrast, the opposite trend was observed in the distal trachea lacking glands (C5-C6)—proliferation significantly increased with time post-injury (Pearson r=0.65, P=0.0001). Interestingly, with increasing time following injury, the abundance of CK14-expressing cells extended further distally in the trachea, and by 6 DPI, CK14-expressing cells in the SAE were observed distal to C6 (Supporting Information Fig. S4A). This apparent “spread” of CK14-expressing cells correlated with the localization of proliferating (BrdU+) cells in the SAE. These findings suggest that regeneration of the tracheal SAE may proceed from the glandular regions to the more distal regions of the trachea lacking SMGs.
Wnt signaling dynamically changes within the SMGs and SAE following injury and during regeneration
Given that Wnt signaling is maintained in the SMGs and SAE of adult mice and Wnts are known to regulate glandular progenitors during development, we set out to interrogate how Wnt signals are modulated during epithelial regeneration after naphthalene injury. Wnt activity was assessed in tracheal tissues from dual Wnt reporter mice harboring both TCF/Lef:H2B-GFP and BAT-gal transgenes. Ki67 was used to measure proliferation in the SAE and SMGs at the level of the cricoid cartilage (CC) to C4 following injury, and cells were scored for Wnt reporter expression (Fig. 2A). As previously observed, proliferation in the SAE and SMGs peaked at 3 DPI (Fig. 2B). Although the percentage of proliferating cells in the SAE was significantly higher than in the SMGs at 3 DPI (P=0.0022) and 5 DPI (P<0.0001) (Fig. 2B), the fold change in proliferating cells relative to uninjured values was similar in the SAE and SMGs at all time points except 5 DPI (Fig. 2C). Surprisingly, TCF/Lef:H2B-GFP expressing cells increased during the first 5 DPI (Fig. 2D), while BAT-gal positive cells decreased during the first 3 DPI and then rose thereafter (Fig. 2E). Despite the decline in BAT-gal at 3 DPI in the SAE and SMGs, the number of double positive cells for TCF/Lef:H2B-GFP and BAT-gal in the SAE increased at 5 DPI (Fig. 2F). However, these double positive Wnt-active cells constituted a minor component of the SAE (1.0%) or SMGs (0.03%). Analysis of subpopulations of Ki67+ proliferating cells in the SMGs revealed a highly dynamic change in cell types expressing TCF/Lef:H2B-GFP and/or BAT-gal (Fig. 2G,H,I). Relative to baseline values, there was a significant increase in TCF/Lef:H2B-GFP+Ki67+ cells at 3 DPI (P<0.001), 5 DPI (P<0.0001), and 7 DPI (P<0.05), and the abundance of BAT-gal+Ki67+ cells significantly increased at 5 DPI (P<0.0001) (Fig. 2G,H,I). Interestingly, the number of TCF/Lef:H2B-GFP+BAT-gal+Ki67+ cells significantly increased at 1 DPI (P<0.001) and again at 5 DPI (P<0.0001) (Fig. 2G,H), but represented a very small subset of glandular cells (0.01-0.1%). Taken together these data suggest that changes in Wnt signaling could coordinate proliferative programs that govern progenitor expansion in the SAE and SMGs. Furthermore, TCF/Lef:H2B-GFP+BAT-gal+ cells, which are absent in SMGs of the uninjured airway, proliferated very early following injury and have a Wnt-reporter phenotype similar to primordial glandular SCs during development (Fig. 1B).
Figure 2. Dynamic changes in Wnt signaling during epithelial regeneration following tracheal injury.
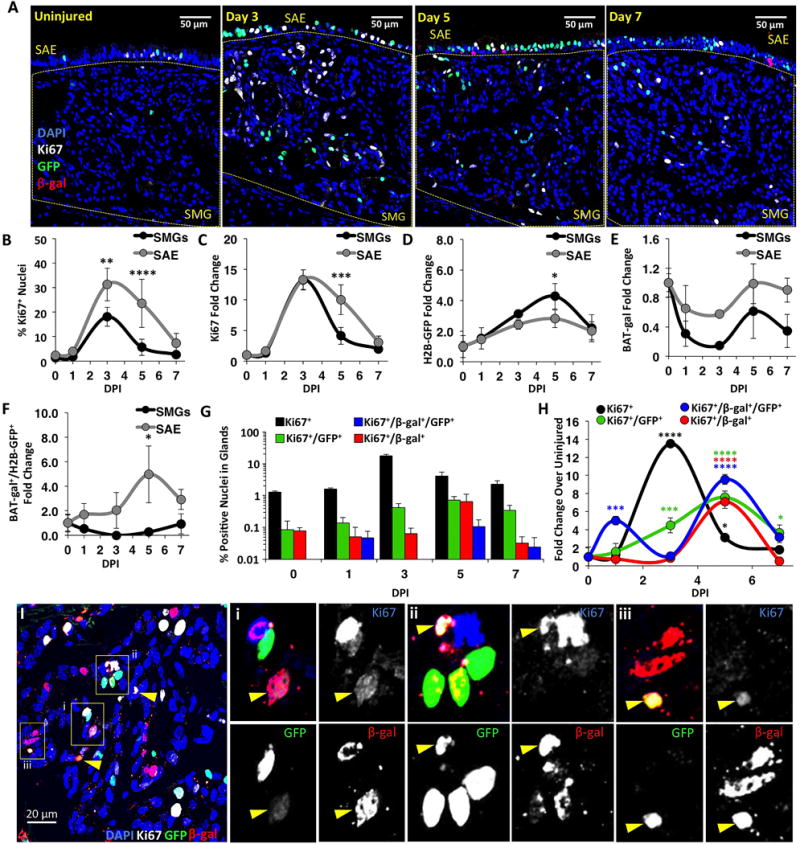
(A): Dual Wnt-reporter mice were treated with vehicle (uninjured) or naphthalene and harvested at 1, 3, 5 and 7 days-post-injury (DPI). Tracheal sections were then immunofluorescently stained for β-Gal, GFP, and Ki67. (B-H): Morphometry of β-Gal, GFP, and/or Ki67 expression within the SMGs and SAE was performed at the tracheal level containing glands (CC-C4). Fold changes reflect values at DPI relative to uninjured values. Panels depict the (B) percentage of proliferating cells after injury; the fold change in the abundance of (C) proliferating cells, (D) TCF/Lef:H2B-GFP expressing cells, (E) BAT-gal expressing cells, (F) TCF/Lef:H2B-GFP and BAT-gal co-expressing cells; (G) percentage of Ki67+ proliferating glandular cells and (H) fold change in abundance of glandular cells for various Wnt-reporter phenotypes. Data are shown as mean ± SEM of N=3 mice (N=4 for day 5) from multiple sections >60 μm apart. SEM was calculated using average counts from individual animals. Asterisks denote significance levels for (B-F) between epithelial compartments (Sidak’s multiple comparisons test) and (H) from uninjured baseline values (Dunnett’s multiple comparisons test): * P<0.05, ** P<0.01, *** P<0.001, and **** P<0.0001. Means varied significantly by Two-way ANOVA for DPI in B, C, G, H (P<0.0001) and D (P=0.0314), and for epithelial compartment in B, G, H (P<0.0001) and C, E, F (P<0.008). (I): Shown are β-Gal+, GFP+, and Ki67+ cells within the SMGs. Arrowheads mark triple-positive cells and enlarged images and separated channels correspond to boxed regions i-iii.
Wnt1 and Wnt3a promote proliferation in tracheal gland and surface epithelia
Previous studies have demonstrated that both Wnt1 and Wnt3a can modulate expression of Lef-1 in airway epithelia [21–24] and Lef-1 is a transcriptional activator of Cyclin D1 [34, 35]. Given that Wnt signals are required to promote Lef-1-dependent proliferation of primordial glandular SCs during airway development [24], we hypothesized that Wnt signals also modulate proliferation of adult SMG stem/progenitor cells. To approach this hypothesis, we infected BAT-gal reporter mice with Wnt3a-expressing recombinant adenovirus (Ad.Wnt3a) or an empty vector virus (Ad.Control) and assessed BAT-gal expression and proliferation (Ki67) (Supporting Information Fig. S5). Additionally, these mice contained the Rosa26: flxtdTomato-stopflxeGFP transgene to enable determination of viral transduction with an adenoviral Cre vector (Ad.Cre) spiked into the viral inoculum. Analysis was confined to the SAE due to insufficient SMG targeting. Importantly, there was no difference in eGFP conversion efficiency in mice treated with Ad.Control or Ad.Wnt3a (Supporting Information Fig. S5C). Ad.Wnt3a expression led to a significant increase in BAT-gal expression (P=0.0009) and to significantly more Ki67+ proliferating cells (P=0.0030) (Supporting Information Fig. S5D,E), relative to the control vector. These data indicate that Wnt3a expression in tracheal SAE is sufficient to induce proliferation.
In addition, we utilized a tracheal explant model to evaluate if Wnt signals impact proliferation in both the SAE and SMGs. Tracheae from dual Wnt reporter mice were halved length-wise down the ventral/dorsal axis and cultured in media supplemented with either Wnt inhibitor (Dkk1) or Wnt activators (Wnt1 and Wnt3a) (Supporting Information Fig. S6A). The culture media also contained EdU to label dividing cells (Supporting Information Fig. S6B,C). As expected, tracheal halves cultured in the presence of Wnt1 and Wnt3a showed upregulation of BAT-gal as compared to DKK-treated tracheas for both the SMGs (38.5-fold) and SAE (18.5-fold) (Supporting Information Fig. S6D); however, these comparisons were not significant for the TCF/Lef:H2B-GFP reporter (SAE 3.2-fold, SMGs 1.3-fold) (Supporting Information Fig. S6E). Interestingly, Wnt1/Wnt3a treatment only significantly induced proliferation in the SMGs (4.3-fold) (Supporting Information Fig. S6F) and SMG proliferation was significantly more responsive to Wnt-activation compared to the SAE (P=0.0070) (Supporting Information Fig. S6G). Similar changes were observed when BSA was used in place of Dkk1 (Supporting Information Fig. S6H-K), suggesting Wnt inhibition had a marginal effect on the study. These data indicate that activation of canonical Wnt signaling is sufficient to promote proliferation of progenitors within the glands. The nature of the explant model, in which the airway surface is injured during division of the trachea, may contribute to the higher baseline proliferation in the SAE and less Wnt-responsiveness compared to the in vivo studies on ectopic expression of Wnt3a.
Expression of Wnt pathway and Wnt reporter genes uniquely change in the proximal and distal trachea following injury
To identify molecular factors that might be responsible for modulating Wnt reporter activity, we quantified changes in tracheal RNA expression following naphthalene injury of BAT-gal:TCF/Lef:H2B-GFP double-transgenic mice. Target transcripts included 9 cell-type specific marker genes, 56 endogenous Wnt-related genes, and the Wnt reporter genes LacZ and GFP (Supplementary Table S2). Expression was evaluated in both the proximal gland-containing (CC-C4) and distal gland-absent (C5-C13) regions of the trachea at 1 and 5 days post-injury and compared to uninjured controls (Fig. 3A). TCF/Lef:H2B-GFP RNA expression increased in the proximal trachea and decreased in the distal trachea at 1 DPI, while at 5 DPI expression increased in both the proximal and distal regions (Fig. 3B). This change at 5 DPI was consistent with an increased abundance of TCF/Lef:H2B-GFP expressing cells following injury (Fig. 2D). BAT-gal RNA expression increased at 1 and 5 DPI in the proximal and distal trachea with the greatest change in the distal trachea (Fig. 3C). Given that the abundance of BAT-gal positive epithelial cells decreased following injury (Fig. 2E), it is likely that the increase in BAT-gal expression was within non-epithelial cells. Wisp2, a downstream target of Wnt signaling [36–38], was significantly induced following injury and to a greater extent in the distal trachea (Fig. 3D). Several Wnt-related genes were downregulated in a temporal- and/or regional-specific manner following injury (Fig. 3E-K,V), including the known Wnt inhibitors Wif1 (Fig. 3E) [39] and Dkk2 (Fig. 3K), Wnt ligands Wnt5a (Fig. 3H) and Wnt4 (Fig. 3I), and the Wnt-signaling modulator Sfrp2 (Fig. 3J). Many of these factors returned to baseline, or were elevated, at 5 DPI (i.e., Sfrp2). In addition, several Wnt-related genes were upregulated following injury, some with temporally- or regionally-specific changes (Fig. 3L-R and V). For example, Wnt3a expression increased in the proximal trachea and was not detected in the majority of distal segments (Fig. 3L), whereas Wnt2 expression was significantly upregulated in only the distal trachea at 1 DPI (Fig. 3M). In addition, Fzd2 (Fig. 3N) and Dvl1 (Fig. 3O) were upregulated in both regions and days post-injury. Interestingly, the Wnt- and Hedgehog-activated Wnt inhibitor, Sfrp1 [40–42], was significantly up-regulated in both regions at 1 and 5 DPI (Fig. 3N), and Hes1, a transcriptional target of Notch signaling [43], was upregulated in the proximal trachea at 1 and 5 DPI (Fig. 3Q). Importantly, the two housekeeping genes used for normalization (Ppib and Hprt) did not significantly change following injury (Fig. 3S,T). Fold changes in the expression of several cell-type marker genes followed a pattern that is consistent with tracheal injury (Fig. 3U) [9, 44, 45]. For example, ciliated cell-specific Foxj1 and club cell-specific Cyp2f2 and Scgb1a1 decreased following injury, while basal cell-specific markers Krt5 (CK5) and Krt14 (CK14) increased. Interestingly, expression of Acta2 (αSMA), a marker of myofibroblasts and glandular myoepithelial cells, was increased in the distal trachea (Fig. 3U). In summary, we found a total of 31 differentially expressed endogenous Wnt-related genes following injury including Wnt ligands, inhibitors/antagonists, effectors, receptors, and downstream targets (Fig. 3V). From the standpoint of factors that may impact expression of the Wnt-reporters following injury, GFP expression clustered with Hes1, Jag2, and Wnt10a, while LacZ expression clustered with a larger number of upregulated genes including Fzd1, Dkkl1, Fzd7, Lrp5, Fzd2, Sfrp1, Bmpr2, Dvl1, Wisp2, Wnt6, Dll1, and Wnt2 (Fig. 3V). Together, these data indicate that dynamic changes in Wnt-signaling occur following tracheal injury that show similar, as well as opposing, trends in regulation during epithelial regeneration in the proximal and distal trachea.
Figure 3. Transcriptional changes in Wnt pathway genes following tracheal injury.
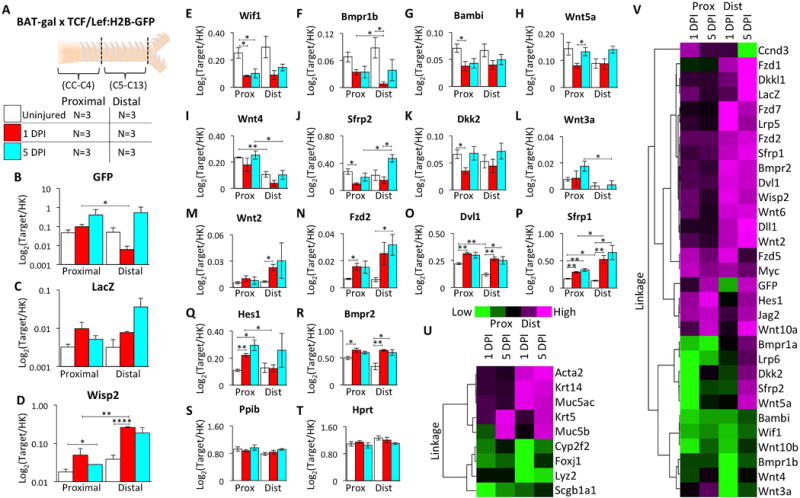
(A): Double Wnt-reporter mice were injured and harvested at 1 and 5 days post-injury (DPI) with uninjured controls. Tracheae were divided into proximal (CC-C4) and distal (C5-C13) segments for RNA extraction and multiplex analysis of 70 transcripts. (B-T): Log2-transformed expression ratios relative to the geometrc mean of internal housekeeping genes (Ppib and Hprt) showing mean ±SEM for N=3 mice with significant differences by two-tailed student’s t-tests: * P<0.05, ** P<0.01, *** P<0.001, and **** P<0.0001. (B): TCF/Lef:H2B-GFP (GFP) (C): BAT-gal (LacZ) (D): Wisp2 (E): Wif1 (F): Bmpr1b (G): Bambi (H): Wnt5a (I): Wnt4 (J): Sfrp2 (K): Dkk2 (L): Wnt3a (M): Wnt2 (N): Fzd2 (O): Dvl1 (P): Sfrp1 (Q): Hes1 (R): Bmpr2 (S): Ppib (T): Hprt. (U and V): Heat maps of unsupervised hierarchical clustering of the fold change (FC) in gene expression from uninjured baseline values for (U) cell-type specific transcripts and (V) differentially expressed (P<0.05) Wnt-pathway transcripts. Heat maps are normalized across genes.
At homeostasis, BAT-gal+ cells are not label-retaining cells, but reside near label-retaining cells
In light of the evidence that Wnt signals regulate proliferation in vivo and in tracheal explants, we hypothesized that Wnt-active cells within SMG tubules either play a role in the glandular SC niche or mark glandular stem/progenitor cells. We defined glandular stem/progenitor cells as those cells capable of retaining two pulsed nucleotide labels following two sequential injuries (Fig. 4A). To this end, BAT-gal mice were injured and pulsed with EdU (5-ethynyl-2′-deoxyuridine) and then reinjured at 90 days in the presence of a second BrdU (5-bromo-2′-deoxyuridine) pulse. At 120 days following the second injury, EdU, BrdU, and BAT-gal expression were co-localized by immunofluorescence (Fig. 4B,C). Dual positive nucleotide label-retaining cells (LRCs) are slowly cycling cells capable of reentering the cell cycle during sequential rounds of injury. Results from these studies demonstrated two important findings. First, BAT-gal positive cells did not retain nucleotide labels. Second, the abundance of BAT-gal positive cells within SMGs spatially correlated with the abundance of LRCs capable of reentering the cell cycle (Fig. 4D). These data suggest that BAT-gal expressing cells in the uninjured homeostatic state are not slowly cycling stem/progenitor cells, but may be a regulatory component of the glandular stem/progenitor cell niche.
Figure 4. BAT-gal cells are not nucleotide label retaining cells (LRCs), but localize near LRCs in the glandular network.
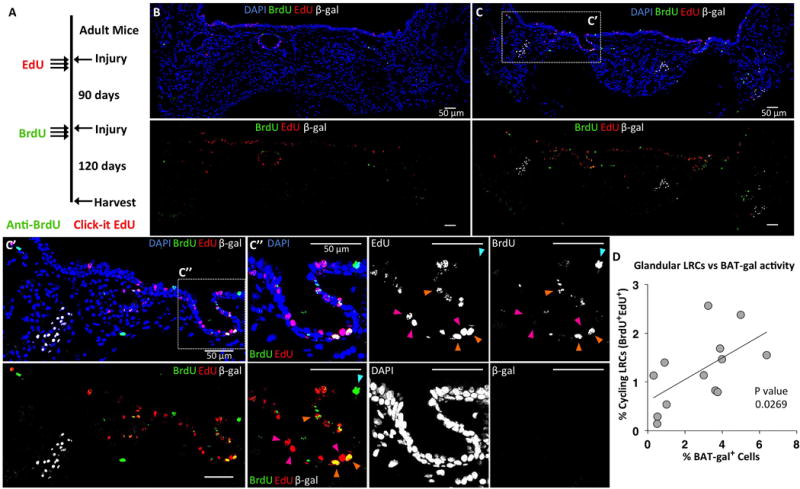
(A): BAT-gal mice were injured with naphthalene and pulsed with EdU three times during the first week following injury. Mice were then re-injured 90 days later and pulsed with BrdU three times during the first week following injury. At 120 days following the second injury, sections of tracheal tissues were stained for β-Gal, EdU, and BrdU. (B): Tracheal cross sections with few clusters of BAT-gal+ cells also had few double-positive LRCs (i.e., EdU+BrdU+). (C): Sections with large clusters of BAT-gal+ cells had many more EdU+BrdU+ LRCs. A higher power image of the boxed region in panel C, (C′) shows that BAT-gal+ cells are not LRCs, but several double-positive LRCs can be seen near an area of BAT-gal+ cells. A higher power image of the boxed region in C′, (C″) shows a region of LRCs that are EdU+ (magenta arrowheads), BrdU+ (cyan arrowhead), and EdU+BrdU+ (orange arrowheads). (D): There is a significant correlation (P=0.0269) between the number of EdU+BrdU+ LRCs and BAT-gal+ cells within a tracheal cross section. Correlation was tested using Spearman’s rank correlation coefficient from data quantified from each of N=4 mice and multiple serial sections separated by at least 60 μm. The average count from each animal was used to calculate the SEM.
Following airway injury SMGs are enriched with slowly cycling stem/progenitor cells that have greater capacity for expansion in vitro than LRCs from the SAE
Utilizing double transgenic Rosa26-rtTA/TetON:H2B-GFP mice, which express a doxycycline-inducible Histone-2B-eGFP (H2B-GFP) fusion protein ubiquitously in airway epithelia [46], we asked whether slowly cycling stem/progenitors capable of retaining a H2B-GFP label following injury were enriched in SMGs. Results from these studies demonstrated a significant (P<0.0001, Two-way ANOVA) enrichment of LRCs in the proximal tracheal epithelial regions (including the SMGs) following injury as compared to distal regions of the SAE (Supporting Information Fig. S7). Direct comparisons between the SMGs and the SAE at regions along the trachea from CC to C9, indicated that LRCs were significantly enriched in SMGs at all time points out to 120 days (Supporting Information Fig. S7B,C). Furthermore, the significance of this glandular enrichment increased with distance of the SAE from the proximal trachea. These data indicate that a gradient of slowly cycling stem/progenitors is produced proximally to distally in the trachea following injury with the most significant enrichment in the SMGs.
To examine whether LRCs in the SMGs and SAE had different proliferative capacities, we performed colony formation efficiency (CFE) assays with LRCs isolated from SMGs or the SAE from distal trachea (C6-13). LRCs were isolated 120 days following H2B-GFP induction and naphthalene injury and were mixed with ROSA-tdTomato epithelial cells. Polarized cultures were maintained for 21 days at ALI and then treated with doxycycline (Fig. 5A–D). Consistent with our hypothesis that SMGs harbor a greater number of slowly cycling SCs in the trachea, SMG epithelial cells generated significantly more colonies than cells isolated from the SAE (P=0.0096). SMG/LRC-enriched cultures also generated significantly more colonies than SMG/LRC-depleted or SAE/LRC-enriched cultures (P<0.05) (Fig. 5E). Moreover, LRC-enriched cultures generated colonies with significantly more cells than LRC-depleted cultures (P=0.0026) (Fig. 5F). A notable pattern in the distribution of colony sizes for each group (Fig. 5G) demonstrated that only SMG/LRC-enriched cultures generated very large colonies containing more than 200 cells. This data demonstrates that LRCs from the SMGs are a highly proliferative pool of tracheal epithelial stem/progenitor cells with a higher capacity for expansion in vitro than LRCs from the SAE.
Figure 5. Glandular LRCs have a higher colony formation efficiency than LRCs from the surface airway epithelium.
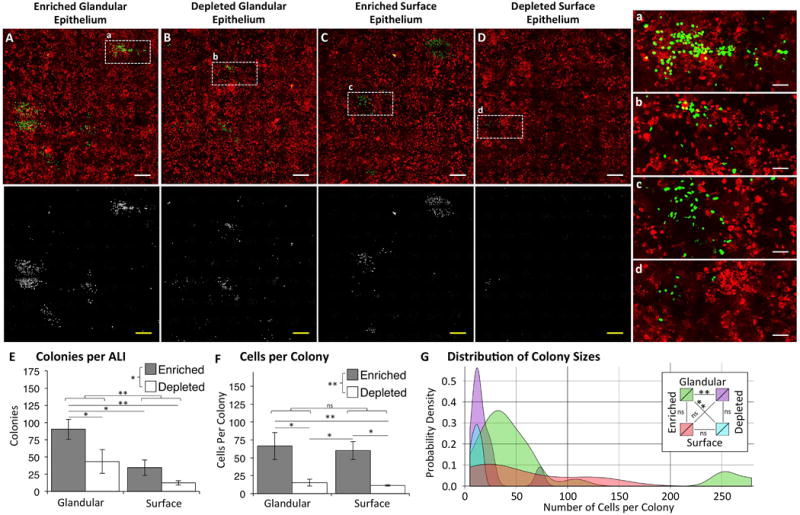
Doxycycline-inducible H2B-GFP retention after naphthalene injury was used to establish label-retaining cells (LRCs) in transgenic mice. 120 days after injury, ALI cultures were established with cells isolated from glandular and surface airway epithelium that were enriched or depleted of H2B-GFP LRCs. Cells were mixed with airway epithelial cells harvested from tdTomato-expressing mice at a 1:100 (H2B-GFP:tdTomato) ratio to interrogate colony formation efficiency. (A-D): En face fluorescent photomicrographs of (A) glandular LRC-enriched cultures, (B) glandular LRC-depleted cultures, (C) surface LRC-enriched cultures, and (D) surface LRC-depleted cultures. (E): Total number of colonies per ALI for each group. (F): Number of cells per colony for each group. (E,F): Data are shown as mean ± SEM of N=3 cultures. Brackets reflect comparisons between variables: LRC-enriched compared to LRC-depleted and glandular compared to surface (Two-Way ANOVA), and lines reflect all significant direct comparisons between individual groups (Fisher’s LSD test). (G): Shown is a probability density plot displaying the frequency at which colony sizes are observed within each group. Lines connecting the legend labels reflect comparisons between the frequency distribution of colony sizes for each group (Two-sample Anderson-Darling test). Asterisks denote significance levels: * P<0.05, ** P<0.01.
Glandular epithelia generate gland-like epithelial colonies in 3-dimensional cultures
To further interrogate the proliferative potential of stem/progenitor cells isolated from the SMG or SAE, glandular epithelial (GE) or surface epithelial (SE) cells were isolated and cultured in matrigel (Fig. 6). Because regeneration of the SAE with glandular progenitors likely involves crosstalk between the two compartments, we also tested whether co-culture of GE cells and SE cells impacted CFE. Interestingly, colony formation by progenitor cells was most efficient in cultures seeded with 90% GE cells and 10% SE cells, giving rise to a greater number of colonies than 100% SE cells or 90% SE cells (P=0.0060 and P=0.0186, respectively) (Fig. 6A). Additionally, the morphologies of colonies that formed included gland-like tubuloacinar colonies or spherical colonies with a pseudostratified epithelium (Fig. 6B) and the abundance of these colony types were impacted by the composition of cells seeded (Fig. 6C). Cultures containing GE cells predominantly generated tubuloacinar colonies, while colonies were predominantly spherical in cultures containing 100% SE cells (Fig. 6C). The generation of round colonies was not impacted by differences in the compositional cell types (P=0.37); however, glandular cells significantly increased the abundance of tubular colonies (P=0.0003) (Fig. 6C). In addition, colonies contained mucous-secreting cells (Muc5AC+), basal-like cells (CK5+), and myoepithelial cells (αSMA+), and αSMA staining was more intense in tubuloacinar colonies (Fig. 6D). These data suggest that both glandular and surface progenitors are equally capable of generating a pseudostratified epithelium found in spherical colonies, but glandular progenitors have a greater ability to generate gland-like tubuloacinar colonies.
Figure 6. Phenotypic differences in colony formation and morphology with SMG- and SAE-derived progenitors in 3-dimensional cultures.
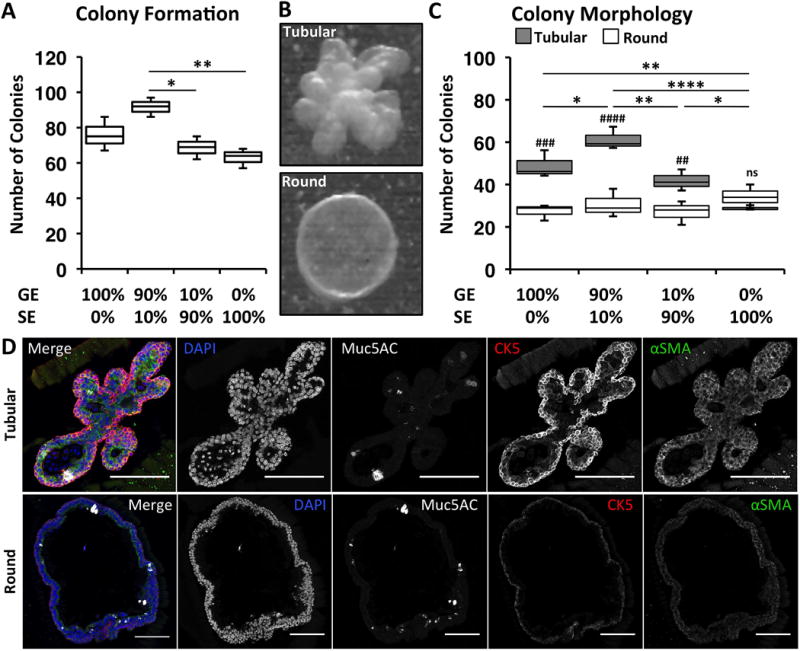
Glandular epithelial (GE) or surface epithelial (SE) cells were isolated and cultured in matrigel to interrogate possible differences in their proliferative potential and phenotypes. Cultures were seeded with pure GE cells, pure SE cells, mixtures at a 9:1 (GE:SE) ratio, or mixtures at a 1:9 (GE:SE) ratio. (A): Number of colonies per culture. Lines reflect all significant comparisons (Holm-Sidak’s multiple comparisons test). (B): Tracheal epithelial cells formed colonies with either tubuloacinar (Tubular) or spherical (Round) morphologies. (C): Number of tubular or round colonies per culture condition. Comparisons in the abundance of tubular or round colonies within each group are shown with hash marks with significance levels: ## P<0.01, ### P<0.001, #### P<0.0001, and ns P>0.05 (Holm-Sidak’s multiple comparisons test). Lines reflect all significant comparisons in the number of tubular colonies between groups. There were no significant differences in number of round colonies between groups (Holm-Sidak’s multiple comparisons test). Asterisks in (A) and (C) denote significance levels: * P<0.05, ** P<0.01, and **** P<0.0001. (D): Immunofluorescent staining of tubular and round colonies for Muc5AC, CK5, and αSMA. Scale bars indicate 50 μms for all images.
Glandular-derived progenitors have a greater regenerative capacity than SAE-derived progenitors and a unique ability to generate gland-like structures in tracheal xenografts
We compared the capacity of SMG-derived and SAE-derived epithelial cells for expansion and differentiation following seeding into denuded rat tracheal xenografts (Fig. 7). Using in vitro expanded primary SMG and SAE cells harvested from wild type (WT) and tdTomato-expressing mice, we seeded denuded tracheal xenografts with cell mixtures of either 90% WT SAE and 10% tdTomato SMG progenitors or 90% WT SMG and 10% tdTomato SAE progenitors (Fig. 7 and Supporting Information Fig. S8). Supporting our hypothesis that SMG-derived progenitor cells are highly proliferative, xenograft epithelium was predominantly tdTomato− in xenografts seeded with 90% WT SMG-derived cells (Supporting Information Fig. S8A) and predominantly tdTomato+ in xenografts seeded with 10% tdTomato-expressing SMG cells (Fig. 7 and Supporting Information Fig. S8B). While SAE-derived progenitors did engraft in the SAE, these cells produced smaller clones than those derived from SMG progenitors, even in grafts seeded with 10-fold fewer SMG cells (Fig. 7A and Supporting Information Fig. S8B). In addition, SMG-derived progenitors generated both surface and glandular epithelium in xenografts (Fig. 7 and Supporting Information Fig. S8). Importantly, gland-like structures were often clonally derived from, or primarily composed of, SMG-derived progenitors and no gland-like structures were composed completely of SAE-derived progenitors. SMG-derived progenitors were also capable of differentiating into α-tubulin+ ciliated cells and CK5+ and integrin β4+ basal cells (Fig. 7C–D). These results demonstrate that SMG-derived progenitors have a greater regenerative capacity than SAE-derived progenitors and can generate both SAE and SMG epithelium. By contrast, SAE-derived progenitors have a more limited capacity for regeneration and formation of SMGs.
Figure 7. SMG-derived cells are capable of generating glandular and surface epithelium in denuded rat tracheal xenografts.
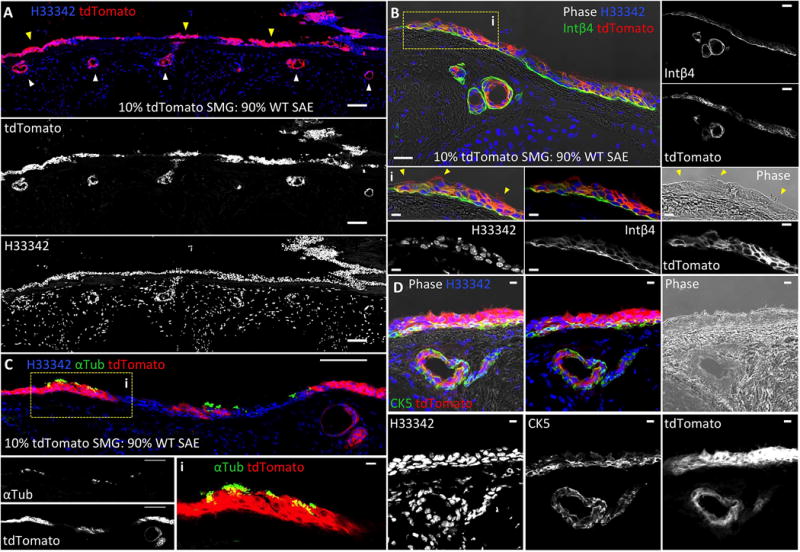
Denuded rat tracheal xenografts were seeded with epithelial cell mixtures derived from tdTomato-expressing cells isolated from tracheal SMGs and combined with non-transgenic cells isolated from the SAE at a 1:10 ratio, respectively. (A): tdTomato-marked SMG-derived cells were capable of generating both surface airway epithelial clones (yellow arrowheads) and gland-like epithelial-derived structures (white arrowheads). (B): SMG-derived progenitors gave rise to a pseudostratified columnar epithelium that resembled normal tracheal SAE by Integrin β4 (Intβ4) expression and the presence of ciliated cells seen by phase contrast (Bi, indicated by yellow arrowheads). (C-D): tdTomato-marked SMG-derived cells also generated acetylated α-tubulin (αTub) positive cilia (C) and a cytokeratin 5 (CK5) expressing basal cell layer (D). Scale bars represent 100 μm in lower magnification panels and 10 μm in higher magnification panels.
Discussion and Conclusion
Regeneration within a complex tissue often involves replication of SCs from several discrete niches [47]. We currently lack a precise knowledge of how various SC niches in the lung coordinate repair following injury through unique and overlapping signals that originate from their biologically distinct microenvironments. The murine trachea is a good model to examine how epithelial SCs from neighboring niches (i.e., the SAE and SMGs) are regulated after injury. However, because glandular and surface epithelia are contiguous at glandular ducts and SCs within these two niches share many phenotypic characteristics, dissection of the unique properties that regulate each of these niches has been difficult.
Because developmental processes are often partly conserved with those that regulate adult SCs, we evaluated whether Wnt signals important for the commitment of primordial glandular SCs during tracheal development might be conserved in adult glandular SC niches. Using two Wnt-reporter transgenic lines, we discovered that Wnt signals function within defined microenvironments of adult glandular serous acini and ducts, as well as the SAE. Phenotypic analysis of Wnt-active BAT-gal+ cells within SMGs demonstrated that they are not monotypic, but are primarily a subset of serous cells with overlapping but distinct marker expression of SAE basal cells. Surprisingly, while both BAT-gal and TCF/Lef:H2B-GFP reporters demonstrate overlapping expression patterns in primordial glandular SCs (i.e., those contained within glandular placodes), these reporters demonstrated non-overlapping patterns of tracheal expression in adult mice. Given that these Wnt-reporters index signals that act in concert to coordinate proliferation and commitment of primordial glandular SCs, we hypothesized that these reporters could also be used to dissect Wnt regulation of glandular SCs and their niche following injury.
Several findings from this study support the hypothesis that Wnt signaling plays an important role in the tracheal regenerative response. First, the abundance of TCF/Lef-1 reporter positive surface and glandular epithelial cells rose concordantly with proliferation following injury (Fig. 2D), while the opposite trend was observed for BAT-gal positive epithelial cells (i.e., expression was reduced during the peak proliferative phase) (Fig. 2E). These findings suggest that the two reporters mark different phases during epithelial regeneration. Second, the earliest appearing glandular progenitors (at 1 day following injury) displayed a TCF/Lef-1 and BAT-gal double reporter-positive phenotype similar to primordial glandular SCs, despite an overall decline in epithelial BAT-gal levels (Fig. 2F–H). Lastly, glandular BAT-gal clusters were spatially associated with nearby groups of slowly cycling stem/progenitor cells that retained multiple nucleotide labels pulsed during sequential injuries (i.e., were cycling label-retaining cells [LRCs]) (Fig. 4). Since LRCs did not express BAT-gal at homeostasis, we favor a model where BAT-gal+ serous tubules regulate glandular slowly cycling stem/progenitor cells as part of the Wnt-responsive SC niche.
The finding of BAT-gal clusters within rare subsets of serous acini suggests that these unique secretory cells may act as a Wnt-responsive SC niche. Previous studies have linked activation of SMG secretions with regeneration after tracheal injury [10, 48]. Furthermore, genetic impairment of SMG secretions results in a reduction of glandular slowly cycling LRCs in cystic fibrosis mice [10, 48]. Thus, it is plausible that BAT-gal active secretory acini could control quiescence and/or proliferation in nearby slowly cycling SCs through injury-induced secretions that impart local changes in Wnt signaling.
We hypothesized that Wnt1 and Wnt3a were likely candidates for influencing injury repair processes of the SAE and SMGs given that both Wnts induce Lef-1 in airway epithelia [21] and Wnt3a is necessary to induce Lef-1-dependent proliferation in primordial SMG SCs during glandular morphogenesis [24]. Indeed, studies evaluating ectopic Wnt3a expression using adenoviral infection of the SAE and tracheal explants cultured in the presence of Wnt1/Wnt3a supported the hypothesis that these Wnts induce proliferation in both the SAE and SMGs (Supporting Information Fig. S5 and S6). Interestingly, Wnt1/Wnt3a activation had a greater effect on SMG progenitor proliferation than the SAE (Supporting Information Fig. S6G) and more significantly induced the BAT-gal reporter than the TCF/Lef:H2B-GFP reporter (Supporting Information Fig. S6D,E). Furthermore, RNA expression of both Wnt3a and Dvl1 were upregulated in the proximal (gland-containing) trachea following injury (Fig. 3L,O) and both factors are known to induce Lef-1 activity [24, 49–51]. Thus, Wnt3a may have an endogenous role in regenerative responses of glandular regions of the trachea.
Previously, studies have shown that severe injuries to the tracheal epithelium are able to engage multiple regenerative pathways [52]. In addition, the proximal tracheal epithelium harbors at least two stem/progenitor cell niches (in the SMGs and SAE), and it is unknown how these niches are engaged during regeneration. We demonstrate that regeneration following naphthalene exposure initiates in the glandular region of the trachea and progresses distally with time following injury (Supporting Information Fig. S4). This suggests the glandular SC niche is engaged early on during SAE regeneration, and led us to hypothesize that the SMGs are enriched with slowly cycling SCs with a high proliferative potential. Several findings from the present study support this hypothesis. First, Tet-inducible H2B-GFP retention (i.e., LRCs) was significantly greater in SMGs and the overlying surface airway epithelium at 120 days after injury (Supporting Information Fig. S7), consistent with previous reports evaluating pulsed nucleotide analogs [10, 14, 31, 53]. Second, H2B-GFP+ LRCs isolated from SMGs generated significantly more and larger colonies than H2B-GFP+ SAE LRCs in CFE assays, demonstrating that glandular LRCs have a greater capacity for proliferation (Fig. 5). However, LRC enrichment from both cellular compartments significantly correlated with greater colony formation and number of cells per colony, demonstrating that LRCs from both compartments are more proliferative than non-LRCs. These studies demonstrate that nuclear label-retention marks progenitors within glands with the greatest proliferative capacity and provide strong support that SMGs harbor slowly cycling SC niches. Our findings extend on previous work demonstrating that nucleotide label-retention marks a basal stem cell population with a high proliferative capacity [32, 53].
Isolated SMG cells also generated gland-like colonies in 3-dimensional culture with αSMA, CK5, and Muc5AC expressing cells. While both SMG and SAE progenitors produced equivalent numbers of spherical colonies containing a pseudostratified epithelium, SMG-derived progenitors produced a greater number of tubuloacinar colonies (Fig. 6). SMG-derived progenitors also demonstrated a much greater regenerative capacity in xenografts where glandular progenitors clonally generated both surface and glandular epithelia, while SAE-derived progenitors only established clones within the surface epithelium (Fig. 7 and Supporting Information Fig. S8). Furthermore, multipotent SMG-derived progenitors reconstituted basal cells, ciliated cells and non-ciliated columnar cells (Fig. 7). These data indicate that glandular SCs have a unique multipotency to regenerate both the glandular and surface airway epithelia.
In the current study, we determined that stem/progenitor cells from SMGs and the SAE have overlapping but distinct properties that respond to Wnt signals following injury. We have identified 31 Wnt-related genes that are differentially expressed in the trachea following injury (Fig. 3). For example, seven Wnt ligands, six Wnt receptors and seven Wnt modulators were differentially regulated following injury (Fig. 3). Other significant changes included those of the Notch, BMP, and TGF-beta signaling pathways (Dll1, Hes1, Jag2, Bmpr1a, Bmpr1b, Bmpr2), which also can modulate Wnt signaling [42, 43, 54]. Interestingly, many of these genes demonstrated small but significant changes in expression (Supplementary Table S2), suggesting that multiple factors likely act in concert to promote regeneration and/or that the cell types influencing these expression changes are low in abundance. More detailed studies are needed to further characterize the cellular patterns of expression of these Wnt pathway genes and their relationship to Wnt-reporter active SC niches in the trachea.
Several overlapping Wnt-pathway genes demonstrated changes in expression that were temporally different in the proximal (gland-containing) and distal (gland-absent) trachea following injury (Fig. 3V). For example, Wnt3a expression was largely confined to the proximal trachea and was increased following injury, while Wnt2, Wnt5a, and Wnt6 were upregulated in the distal trachea to a greater extent than in the proximal trachea (Fig. 3V). Furthermore, several Wnt receptors (Fzd1, Fzd7, LRP6, and Lrp5) and Wnt inhibitors (Dkk2 and Sfrp2) changed differently in the proximal and distal trachea following injury (Fig. 3V). While the mechanism behind these changes remains to be determined, they provide support to our findings that regeneration following severe tracheal injury occurs in a proximal to distal fashion (Supporting Information Fig. S4B).
Of interest to the molecular pathways indexed by the two Wnt-reporters, BAT-gal RNA expression following injury was broadly associated with increased expression of 12 Wnt-modulating genes, while TCF/Lef:H2B-GFP RNA expression tracked most closely with a smaller set of genes that intersect Notch/Wnt signaling. While further work is required to understand the molecular and cellular details of how these factors differentially affect activity of the two Wnt-reporters, by analogy to the phenotype of primordial glandular SCs in development, adult glandular SCs may respond to injury through the activation of similar pathways [10, 21, 22, 24]. The establishment of BAT-CreERT2 and TCF/Lef-CreERT2 transgenic mice capable of lineage tracing the stem/progenitor cells that first respond to Wnt signals following injury may be needed to fully understand Wnt-related biology of the SMG stem cell niche.
In summary, our research has also further defined the SMG niche-specific properties of LRCs and demonstrates that label-retention marks a subpopulation of glandular progenitors with the highest proliferative capacity. Future studies defining the Wnt signals that regulate these LRCs at homeostasis and following injury may have important implications for regenerative medicine.
Supplementary Material
Tracheal sections from a mouse positive for BAT-gal and TCF/Lef:H2B-GFP transgenes were immunofluorescently stained for the β-gal, GFP, αSMA, and/or CK5. (A): Wnt reporter expression is active in cells within SMG ducts (i) and in the surface airway epithelium (SAE) surrounding gland ducts (ii). Gland ducts lack alpha-smooth muscle actin (αSMA) (white) and are positive for cytokeratin 5 (CK5) (blue) expression. (B): Wnt-active clusters of cells are observed in the proximal SAE (i and ii), SMG ducts (iii), glandular acini (iv), and mesenchyme surrounding the glands (v). αSMA-expressing cells (white) outline the glandular tubules (B, iv, and v) and vessels (iii). (C): In the tracheal SAE TCF/Lef:H2B-GFP expression is relatively evenly distributed along the length of the trachea (i), but BAT-gal expressing cells cluster together and are predominantly CK5+ basal cells (ii). Interestingly, Wnt-active cells predominantly express either BAT-gal or TCF/Lef:H2B-GFP exclusively and show no overlap in expression in the adult mouse tracheal epithelium. Hoechst 33342 (H33342) was used to stain nuclei. Scale bars indicate 50 μms for all images unless otherwise indicated.
(A): Representative image of a primordial glandular placode in a newborn dual Wnt-reporter tracheal section immunofluorescently stained for β-Gal, GFP, and activated β-catenin (dephosphorylated on Ser37 and Thr41). Monochromatic images showing each channel separately are shown in gray scale. (B-C): Mean fluorescence intensity of nuclear localized β-Gal, H2B-GFP, and β-catenin was quantified in primordial glandular placodes using Hoechst 33342 to define nuclei and the Multi Wavelength Cell Scoring Application Module of Metamorph software. (B): Fluorescence intensity scatter plot of nuclear TCF/Lef:H2B-GFP (x-axis) vs. BAT-gal (y-axis) with point color indicating intensity of nuclear β-catenin. The Metamorph fluorescence intensity thresholds were set to define four classes of Wnt-reporter expressing cells and are indicated by the four quadrants: i, Wnt-reporter negative cells; ii, BAT-gal+ cells, iii, TCF/Lef:H2B-GFP+ cells, and iv, BAT-gal+ TCF/Lef:H2B-GFP+ double positive cells. (C): Average fluorescence intensity of nuclear β-catenin for the cell populations within the TCF/Lef:H2B-GFP and BAT-gal gating thresholds defined by the graph on the right depicting the classification of cell phenotypes from panel (B). Statistical comparisons between groups were determined by One-Way ANOVA and Bonferroni’s multiple comparison test: *** P<0.001 and **** P<0.0001. The dataset include analysis of 13 glandular placodes from four mice. (D): Representative image of an adult dual Wnt-reporter tracheal section immunofluorescently stained for β-Gal, GFP, and β-catenin. Monochromatic images showing each channel separately are shown in gray scale. Scale bars indicate 20 μms for all images.
Several phenotypic markers were used to characterize glandular BAT-gal+ cells by immunofluorescent staining for β-gal and the indicated makers. (A-E): Basal cell type markers cytokeratin 5 (CK5) (A), cytokeratin 14 (CK14) (B), integrin α-6 (Intα6) (C), Integrin β-4 (Intβ4) (D), and neuronal growth factor receptor (Ngfr) (E). (F-H): Additional markers included the myoepithelial cell marker α-smooth muscle actin (αSMA) (F), the mucous tubule marker Muc5AC (G), and the serous tubule marker lysozyme (Lyz) (H). (I): Quantitation of the % β-gal positive cells for each of the markers. Fluorescent micrographs (A through H) show maximum intensity projections of confocal z-stack images. Cells were scored using z-stack images in ImageJ to compile the graph in I. Data are shown as mean ± SEM of N=4 mice from multiple sections. White arrowheads show examples of cells that were scored as positive for CK5 (A), CK14 (B), or αSMA (F). Scale bars indicate 50 μms for all images.
Mice were injured with naphthalene and pulsed with BrdU 1 hr prior to harvesting tracheae on days 1, 3, 4, 5, or 6. Uninjured controls were also labeled with BrdU. (A): Tracheal sections immunofluorescently stained for cytokeratin 14 (CK14) and BrdU. (B): Quantification of BrdU+ proliferating cells as a percentage of total cells using DAPI nuclear counts. This quantification included proliferating epithelial cells only in the surface airway epithelium for regions of the trachea confined to cartilage ring C1-C2, C3-C4, and C5-C6. The midpoint between cartilage rings was used to draw the boundaries for quantification. There was a significant negative correlation in the abundance of BrdU+ cells with time post-injury for the proximal C1-C2 region of the trachea (Pearson correlation r=−0.52, P=0.0037). By contrast, there was a significant positive correlation in the abundance of BrdU+ cells with time post-injury for the distal C5-C6 region of the trachea (Pearson r=0.65, P=0.0001). Data are shown as mean ± SEM of N=6-8 mice per group. Cartilage rings are marked by C. Scale bars indicate 200 μms for all images.
(A,B): Double transgenic mice possessing the BAT-gal and Rosa26-flxtdTomatoStopflx-eGFP alleles were intranasally inoculated with recombinant Cre-expressing (Ad.Cre) adenovirus mixed with either recombinant Wnt3a-expressing adenovirus (Ad.Wnt3a) or a control transgene-negative adenovirus (Ad.Control). Tracheae were harvested at 5 days post-infection and sections were immunostained for β-gal, GFP and/or Ki67. Expression of eGFP was observed only in the tracheal SAE. (C): Adenoviral infection efficiency was determined by analyzing Cre mediated conversion of the Rosa26-flxtdTomatoStopflx-eGFP allele. There was no significant difference in the % eGFP positive signal in mice given Ad.Wnt3a or Ad.Control virus, indicating the efficiency of infection was similar in the two groups. (D): Mice inoculated with Ad.Wnt3a showed significantly greater activity of the BAT-gal reporter allele in the SAE as measured by the % of cells positive for β-gal (Two-way student’s t-test, *** P=0.0009). (E): Ad.Wnt3a infection led to significantly more proliferation in the SAE as measured by the % of cells positive for Ki67 (Two-way student’s t-test, ** P=0.0030). Data are shown as mean ± SEM of N=3-4 mice per group from multiple serial sections separated by at least 60 μm. The average count from each animal was used to calculate the SEM.
(A): Tracheae from mice harboring both BAT-gal and TCF/Lef:H2B-GFP reporter alleles were excised and bisected length-wise down the ventral/dorsal axis. Tracheal halves were placed on a surgifoam support with the airway lumen exposed to air and cultured in the presence of EdU to mark proliferating cells. Tracheal halves were treated with media supplemented with bovine serum albumin (BSA), Dkk1, or Wnt1 and Wnt3a. (B, C): Representative fluorescent staining of tracheal explant sections for EdU, β-Gal, and GFP at 3 days post-stimulation. Dashed lines indicate the surface airway epithelial basement membrane or the border of cricoid cartilage (CC). (D-F): Morphometric quantification of the % of epithelial cells in the SAE or SMGs positive for (D) Bat-gal, (E) TCF/Lef:H2B-GFP, or (F) EdU in explants treated with Wnt1/Wnt3a or Dkk1. (G): The fold change in % of proliferative cells (EdU+) between Wnt1/Wnt3a or Dkk1 treatment groups. (H-J): Morphometric quantification of the % of epithelial cells in the SAE or SMGs positive for (D) Bat-gal, (E) TCF/Lef:H2B-GFP, or (F) EdU in explants treated with Wnt1/Wnt3a or BSA. (K): The fold change in % of proliferative cells (EdU+) between Wnt1/Wnt3a or BSA treatment groups. Data in D-K are the mean ± SEM of N=4-7 explants. D-F and H-J utilized a two-tailed paired student’s t-test for statistical analysis. G and K utilized a Mann-Whitney U test for statistical analysis. * P<0.05, ** P<0.01. Scale bars represent 100 μm.
Double transgenic mice harboring Rosa26-rtTA/TetON:H2B-GFP alleles were induced with 5 days of doxycycline treatment followed by naphthalene injury at 1 week following the last doxycycline injection. (A): H2B-GFP label retention in the tracheal epithelium was visualized by immunofluorescent detection of GFP at the indicated days post-injury. (B,C): Quantification of the % of H2B-GFP positive cells (B) and absolute number of H2B-GFP cells (C) in the SMGs and SAE at various cartilage ring regions of the trachea. Percent epithelial H2B-GFP label retention changed significantly over time (Two-Way ANOVA, P<0.0001), and the regional differences in the percentage of cells retaining H2B-GFP label was significant (Two-Way ANOVA, P<0.0001), indicating that label retention significantly decreased from proximal epithelial regions (including the SMGs) to distal epithelial regions. These trends in H2B-GFP label retention were even more pronounced for the absolute total number of LRCs, but both time and regional significance remained the same. Statistical comparisons between groups are marked by colored lines and represent results from Holm-Sidak’s multiple comparisons post-test; * P<0.05, ** P<0.01, *** P<0.001, **** P<0.0001. Data are shown as mean ± SEM of N=3-8 mice from multiple serial sections separated by at least 60 μm. The average count from each animal was used to calculate the SEM. CC, cricoid cartilage; C1-C6, cartilage ring. Scale bars indicate 200 μms for all images.
Isolated glandular- and SAE-derived primary cultures of epithelial progenitor cells were established from ROSA-tdTomato or transgene negative (WT) mice in the presence of Rho-kinase inhibitor and expanded for several passages. Denuded tracheal xenografts were seeded with mixtures of epithelial cells derived from the SMG or SAE tracheal compartments. (A): Xenografts that were seeded with 90% WT SMG progenitors and 10% tdTomato SAE progenitors generated primarily WT (dtTomato negative) epithelium. (B): Xenografts that were seeded with 90% WT SAE cells and 10% tdTomato SMG cells generated primarily tdTomato epithelium, which included the SAE and gland-like epithelial structures. (C): An enlarged image of the boxed region in panel A showing a tdTomato negative gland-like structure generated from WT SMG cells. (D): An enlarged image of the boxed region in panel B showing a tdTomato positive gland-like structure generated from tdTomato SMG cells. Scale bars represent 50 μm.
Acknowledgments
We owe a special thank you to Dr. Jay Rajagopal and his lab for their help in developing the explant model and for advice in expanding primary epithelial cells in vitro. This work was supported by NIH grants DK047967 (to J.F.E), HL051670 (to J.F.E), the University of Iowa Center for Gene Therapy (DK54759) (to J.F.E), and the Carver Chair in Molecular Medicine (to J.F.E). We gratefully acknowledge the support of the University of Iowa Central Microscopy Research Facility (CMRF).
Footnotes
Author contributions:
Thomas J. Lynch: Conception and design, collection and assembly of data, data analysis and interpretation, manuscript writing.
Preston Anderson: Conception and design, collection and assembly of data, data analysis and interpretation, editing and review of manuscript and data.
Weiliang Xie: Conception and design, data analysis and interpretation.
Adrianne Crooke: Collection and assembly of data.
Xiaoming Liu: Conception and design, collection and assembly of data.
Scott R. Tyler: Conception and design, data analysis and interpretation.
Meihui Luo: Collection and assembly of data.
David M Kusner: Collection and assembly of data.
Yulong Zhang: Collection and assembly of data.
Traci Neff: Collection and assembly of data.
Daniel C. Burnette: Collection and assembly of data.
Katharine S. Walters: Data analysis and interpretation.
Michael J. Goodheart: Conception and design, collection and assembly of data, editing and review of manuscript and data.
Kalpaj R. Parekh: Conception and design, editing and review of manuscript and data.
John F. Engelhardt: Conception and design, data analysis and interpretation, manuscript writing.
Competing interests
The authors declare that there is no competing interest.
References
- 1.Liu X, Engelhardt JF. The glandular stem/progenitor cell niche in airway development and repair. Proc Am Thorac Soc. 2008;5:682–688. doi: 10.1513/pats.200801-003AW. [DOI] [PMC free article] [PubMed] [Google Scholar]
- 2.Wansleeben C, Barkauskas CE, Rock JR, et al. Stem cells of the adult lung: their development and role in homeostasis, regeneration, and disease. Wiley Interdiscip Rev Dev Biol. 2013;2:131–148. doi: 10.1002/wdev.58. [DOI] [PubMed] [Google Scholar]
- 3.Hong KU, Reynolds SD, Watkins S, et al. In vivo differentiation potential of tracheal basal cells: evidence for multipotent and unipotent subpopulations. American journal of physiology Lung cellular and molecular physiology. 2004;286:L643–649. doi: 10.1152/ajplung.00155.2003. [DOI] [PubMed] [Google Scholar]
- 4.Hajj R, Baranek T, Le Naour R, et al. Basal cells of the human adult airway surface epithelium retain transit-amplifying cell properties. Stem Cells. 2007;25:139–148. doi: 10.1634/stemcells.2006-0288. [DOI] [PubMed] [Google Scholar]
- 5.Hackett TL, Shaheen F, Johnson A, et al. Characterization of side population cells from human airway epithelium. Stem Cells. 2008;26:2576–2585. doi: 10.1634/stemcells.2008-0171. [DOI] [PMC free article] [PubMed] [Google Scholar]
- 6.Rock JR, Onaitis MW, Rawlins EL, et al. Basal cells as stem cells of the mouse trachea and human airway epithelium. Proc Natl Acad Sci U S A. 2009;106:12771–12775. doi: 10.1073/pnas.0906850106. [DOI] [PMC free article] [PubMed] [Google Scholar]
- 7.McQualter JL, Yuen K, Williams B, et al. Evidence of an epithelial stem/progenitor cell hierarchy in the adult mouse lung. Proc Natl Acad Sci U S A. 2010;107:1414–1419. doi: 10.1073/pnas.0909207107. [DOI] [PMC free article] [PubMed] [Google Scholar]
- 8.Ghosh M, Ahmad S, Jian A, et al. Human Tracheobronchial Basal Cells: Normal Versus Remodeling/Repairing Phenotypes in vivo and in vitro. American Journal of Respiratory Cell and Molecular Biology. 2013;49 doi: 10.1165/rcmb.2013-0049OC. [DOI] [PMC free article] [PubMed] [Google Scholar]
- 9.Ghosh M, Brechbuhl HM, Smith RW, et al. Context-Dependent Differentiation of Multipotential Keratin 14–Expressing Tracheal Basal Cells. American Journal of Respiratory Cell and Molecular Biology. 2011;45:403–410. doi: 10.1165/rcmb.2010-0283OC. [DOI] [PMC free article] [PubMed] [Google Scholar]
- 10.Lynch TJ, Engelhardt JF. Progenitor cells in proximal airway epithelial development and regeneration. J Cell Biochem. 2014;115:1637–1645. doi: 10.1002/jcb.24834. [DOI] [PMC free article] [PubMed] [Google Scholar]
- 11.Hegab AE, Ha VL, Gilbert JL, et al. Novel stem/progenitor cell population from murine tracheal submucosal gland ducts with multipotent regenerative potential. Stem Cells. 2011;29:1283–1293. doi: 10.1002/stem.680. [DOI] [PMC free article] [PubMed] [Google Scholar]
- 12.Hegab AE, Nickerson DW, Ha VL, et al. Repair and regeneration of tracheal surface epithelium and submucosal glands in a mouse model of hypoxic-ischemic injury. Respirology. 2012;17:1101–1113. doi: 10.1111/j.1440-1843.2012.02204.x. [DOI] [PMC free article] [PubMed] [Google Scholar]
- 13.Hegab AE, Ha VL, Bisht B, et al. Aldehyde Dehydrogenase Activity Enriches for Proximal Airway Basal Stem Cells and Promotes Their Proliferation. Stem Cells and Development. 2014;23:664–675. doi: 10.1089/scd.2013.0295. [DOI] [PMC free article] [PubMed] [Google Scholar]
- 14.Borthwick D, Shahbazian M, Krantz QT, et al. Evidence for stem-cell niches in the tracheal epithelium. American Journal of Respiratory Cell and Molecular Biology. 2001;24:662–670. doi: 10.1165/ajrcmb.24.6.4217. [DOI] [PubMed] [Google Scholar]
- 15.Engelhardt JF. Stem cell niches in the mouse airway. American Journal of Respiratory Cell and Molecular Biology. 2001;24:649–652. doi: 10.1165/ajrcmb.24.6.f206. [DOI] [PubMed] [Google Scholar]
- 16.Engelhardt JF, Schlossberg H, Yankaskas JR, et al. Progenitor cells of the adult human airway involved in submucosal gland development. Development. 1995;121:2031–2046. doi: 10.1242/dev.121.7.2031. [DOI] [PubMed] [Google Scholar]
- 17.Filali M, Liu X, Cheng N, et al. Mechanisms of submucosal gland morphogenesis in the airway. Novartis Found Symp. 2002;248:38–45. discussion 45-50, 277-282. [PubMed] [Google Scholar]
- 18.Liu X, Driskell RR, Engelhardt JF. Airway glandular development and stem cells. Current topics in developmental biology. 2004;64:33–56. doi: 10.1016/S0070-2153(04)64003-8. [DOI] [PubMed] [Google Scholar]
- 19.Wine JJ, Joo NS. Submucosal glands and airway defense. Proc Am Thorac Soc. 2004;1:47–53. doi: 10.1513/pats.2306015. [DOI] [PubMed] [Google Scholar]
- 20.Duan D, Yue Y, Zhou W, et al. Submucosal gland development in the airway is controlled by lymphoid enhancer binding factor 1 (LEF1) Development. 1999;126:4441–4453. doi: 10.1242/dev.126.20.4441. [DOI] [PubMed] [Google Scholar]
- 21.Xie W, Lynch TJ, Liu X, et al. Sox2 modulates Lef-1 expression during airway submucosal gland development. American journal of physiology Lung cellular and molecular physiology. 2014;306:L645–L660. doi: 10.1152/ajplung.00157.2013. [DOI] [PMC free article] [PubMed] [Google Scholar]
- 22.Liu X, Luo M, Xie W, et al. Sox17 modulates Wnt3A/beta-catenin-mediated transcriptional activation of the Lef-1 promoter. Am J Physiol Lung Cell Mol Physiol. 2010;299:L694–710. doi: 10.1152/ajplung.00140.2010. [DOI] [PMC free article] [PubMed] [Google Scholar]
- 23.Driskell RR, Liu X, Luo M, et al. Wnt-responsive element controls Lef-1 promoter expression during submucosal gland morphogenesis. Am J Physiol Lung Cell Mol Physiol. 2004;287:L752–763. doi: 10.1152/ajplung.00026.2004. [DOI] [PubMed] [Google Scholar]
- 24.Driskell RR, Goodheart M, Neff T, et al. Wnt3a regulates Lef-1 expression during airway submucosal gland morphogenesis. Developmental Biology. 2007;305:90–102. doi: 10.1016/j.ydbio.2007.01.038. [DOI] [PMC free article] [PubMed] [Google Scholar]
- 25.Hegab AE, Ha VL, Darmawan DO, et al. Isolation and In Vitro Characterization of Basal and Submucosal Gland Duct Stem/Progenitor Cells from Human Proximal Airways. Stem Cells Translational Medicine. 2012;1:719–724. doi: 10.5966/sctm.2012-0056. [DOI] [PMC free article] [PubMed] [Google Scholar]
- 26.Hegab AE, Kubo H, Fujino N, et al. Isolation and characterization of murine multipotent lung stem cells. Stem Cells Dev. 2010;19:523–536. doi: 10.1089/scd.2009.0287. [DOI] [PubMed] [Google Scholar]
- 27.Liu X, Ory V, Chapman S, et al. ROCK inhibitor and feeder cells induce the conditional reprogramming of epithelial cells. Am J Pathol. 2012;180:599–607. doi: 10.1016/j.ajpath.2011.10.036. [DOI] [PMC free article] [PubMed] [Google Scholar]
- 28.Wang X, Zhang Y, Amberson A, et al. New models of the tracheal airway define the glandular contribution to airway surface fluid and electrolyte composition. Am J Respir Cell Mol Biol. 2001;24:195–202. doi: 10.1165/ajrcmb.24.2.3918. [DOI] [PubMed] [Google Scholar]
- 29.Filali M, Zhang Y, Ritchie TC, et al. Xenograft model of the CF airway. Methods Mol Med. 2002;70:537–550. doi: 10.1385/1-59259-187-6:537. [DOI] [PubMed] [Google Scholar]
- 30.Engelhardt JF, Yankaskas JR, Wilson JM. In vivo retroviral gene transfer into human bronchial epithelia of xenografts. J Clin Invest. 1992;90:2598–2607. doi: 10.1172/JCI116155. [DOI] [PMC free article] [PubMed] [Google Scholar]
- 31.Liu X, Driskell RR, Engelhardt JF. Stem cells in the lung. Methods Enzymol. 2006;419:285–321. doi: 10.1016/S0076-6879(06)19012-6. [DOI] [PMC free article] [PubMed] [Google Scholar]
- 32.Ghosh M, Helm KM, Smith RW, et al. A single cell functions as a tissue-specific stem cell and the in vitro niche-forming cell. Am J Respir Cell Mol Biol. 2011;45:459–469. doi: 10.1165/rcmb.2010-0314OC. [DOI] [PMC free article] [PubMed] [Google Scholar]
- 33.Chernaya O, Shinin V, Liu Y, et al. Behavioral heterogeneity of adult mouse lung epithelial progenitor cells. Stem Cells Dev. 2014;23:2744–2757. doi: 10.1089/scd.2013.0631. [DOI] [PMC free article] [PubMed] [Google Scholar]
- 34.Shelton DN, Fornalik H, Neff T, et al. The role of LEF1 in endometrial gland formation and carcinogenesis. PLoS One. 2012;7:e40312. doi: 10.1371/journal.pone.0040312. [DOI] [PMC free article] [PubMed] [Google Scholar]
- 35.Shtutman M, Zhurinsky J, Simcha I, et al. The cyclin D1 gene is a target of the beta-catenin/LEF-1 pathway. Proceedings of the National Academy of Sciences of the United States of America. 1999;96:5522–5527. doi: 10.1073/pnas.96.10.5522. [DOI] [PMC free article] [PubMed] [Google Scholar]
- 36.Grunberg JR, Hammarstedt A, Hedjazifar S, et al. The Novel Secreted Adipokine WNT1-inducible Signaling Pathway Protein 2 (WISP2) Is a Mesenchymal Cell Activator of Canonical WNT. J Biol Chem. 2014;289:6899–6907. doi: 10.1074/jbc.M113.511964. [DOI] [PMC free article] [PubMed] [Google Scholar]
- 37.Frewer KA, Sanders AJ, Owen S, et al. A role for WISP2 in colorectal cancer cell invasion and motility. Cancer Genomics Proteomics. 2013;10:187–196. [PubMed] [Google Scholar]
- 38.Mann B, Gelos M, Siedow A, et al. Target genes of beta-catenin-T cell-factor/lymphoid-enhancer-factor signaling in human colorectal carcinomas. Proc Natl Acad Sci U S A. 1999;96:1603–1608. doi: 10.1073/pnas.96.4.1603. [DOI] [PMC free article] [PubMed] [Google Scholar]
- 39.Malinauskas T, Aricescu AR, Lu W, et al. Modular mechanism of Wnt signaling inhibition by Wnt inhibitory factor 1. Nat Struct Mol Biol. 2011;18:886–893. doi: 10.1038/nsmb.2081. [DOI] [PMC free article] [PubMed] [Google Scholar]
- 40.Galli LM, Barnes T, Cheng T, et al. Differential inhibition of Wnt-3a by Sfrp-1, Sfrp-2, and Sfrp-3. Dev Dyn. 2006;235:681–690. doi: 10.1002/dvdy.20681. [DOI] [PMC free article] [PubMed] [Google Scholar]
- 41.Caldwell GM, Jones CE, Taniere P, et al. The Wnt antagonist sFRP1 is downregulated in premalignant large bowel adenomas. Br J Cancer. 2006;94:922–927. doi: 10.1038/sj.bjc.6602967. [DOI] [PMC free article] [PubMed] [Google Scholar]
- 42.Katoh Y, Katoh M. WNT antagonist, SFRP1, is Hedgehog signaling target. Int J Mol Med. 2006;17:171–175. [PubMed] [Google Scholar]
- 43.Shi Y, Shu B, Yang R, et al. Wnt and Notch signaling pathway involved in wound healing by targeting c-Myc and Hes1 separately. Stem Cell Res Ther. 2015;6:120. doi: 10.1186/s13287-015-0103-4. [DOI] [PMC free article] [PubMed] [Google Scholar]
- 44.Peake JL, Reynolds SD, Stripp BR, et al. Alteration of pulmonary neuroendocrine cells during epithelial repair of naphthalene-induced airway injury. Am J Pathol. 2000;156:279–286. doi: 10.1016/S0002-9440(10)64728-1. [DOI] [PMC free article] [PubMed] [Google Scholar]
- 45.Van Winkle LS, Johnson ZA, Nishio SJ, et al. Early events in naphthalene-induced acute Clara cell toxicity: comparison of membrane permeability and ultrastructure. Am J Respir Cell Mol Biol. 1999;21:44–53. doi: 10.1165/ajrcmb.21.1.3630. [DOI] [PubMed] [Google Scholar]
- 46.Tumbar T, Guasch G, Greco V, et al. Defining the epithelial stem cell niche in skin. Science. 2004;303:359–363. doi: 10.1126/science.1092436. [DOI] [PMC free article] [PubMed] [Google Scholar]
- 47.Donati G, Watt FM. Stem Cell Heterogeneity and Plasticity in Epithelia. Cell Stem Cell. 2015;16:465–476. doi: 10.1016/j.stem.2015.04.014. [DOI] [PubMed] [Google Scholar]
- 48.Xie W, Fisher JT, Lynch TJ, et al. CGRP induction in cystic fibrosis airways alters the submucosal gland progenitor cell niche in mice. J Clin Invest. 2011;121:3144–3158. doi: 10.1172/JCI41857. [DOI] [PMC free article] [PubMed] [Google Scholar]
- 49.Lee YN, Gao Y, Wang HY. Differential mediation of the Wnt canonical pathway by mammalian Dishevelleds-1, -2, and -3. Cell Signal. 2008;20:443–452. doi: 10.1016/j.cellsig.2007.11.005. [DOI] [PMC free article] [PubMed] [Google Scholar]
- 50.Li L, Yuan H, Xie W, et al. Dishevelled proteins lead to two signaling pathways. Regulation of LEF-1 and c-Jun N-terminal kinase in mammalian cells. J Biol Chem. 1999;274:129–134. doi: 10.1074/jbc.274.1.129. [DOI] [PubMed] [Google Scholar]
- 51.Filali M, Cheng N, Abbott D, et al. Wnt-3A/beta-catenin signaling induces transcription from the LEF-1 promoter. J Biol Chem. 2002;277:33398–33410. doi: 10.1074/jbc.M107977200. [DOI] [PubMed] [Google Scholar]
- 52.Hogan BL, Barkauskas CE, Chapman HA, et al. Repair and regeneration of the respiratory system: complexity, plasticity, and mechanisms of lung stem cell function. Cell Stem Cell. 2014;15:123–138. doi: 10.1016/j.stem.2014.07.012. [DOI] [PMC free article] [PubMed] [Google Scholar]
- 53.Ghosh M, Smith RW, Runkle CM, et al. Regulation of Trachebronchial Tissue-Specific Stem Cell Pool Size. Stem cells (Dayton, Ohio) 2013;31:2767–2778. doi: 10.1002/stem.1440. [DOI] [PMC free article] [PubMed] [Google Scholar]
- 54.Basson MA. Signaling in cell differentiation and morphogenesis. Cold Spring Harb Perspect Biol. 2012;4 doi: 10.1101/cshperspect.a008151. [DOI] [PMC free article] [PubMed] [Google Scholar]
Associated Data
This section collects any data citations, data availability statements, or supplementary materials included in this article.
Supplementary Materials
Tracheal sections from a mouse positive for BAT-gal and TCF/Lef:H2B-GFP transgenes were immunofluorescently stained for the β-gal, GFP, αSMA, and/or CK5. (A): Wnt reporter expression is active in cells within SMG ducts (i) and in the surface airway epithelium (SAE) surrounding gland ducts (ii). Gland ducts lack alpha-smooth muscle actin (αSMA) (white) and are positive for cytokeratin 5 (CK5) (blue) expression. (B): Wnt-active clusters of cells are observed in the proximal SAE (i and ii), SMG ducts (iii), glandular acini (iv), and mesenchyme surrounding the glands (v). αSMA-expressing cells (white) outline the glandular tubules (B, iv, and v) and vessels (iii). (C): In the tracheal SAE TCF/Lef:H2B-GFP expression is relatively evenly distributed along the length of the trachea (i), but BAT-gal expressing cells cluster together and are predominantly CK5+ basal cells (ii). Interestingly, Wnt-active cells predominantly express either BAT-gal or TCF/Lef:H2B-GFP exclusively and show no overlap in expression in the adult mouse tracheal epithelium. Hoechst 33342 (H33342) was used to stain nuclei. Scale bars indicate 50 μms for all images unless otherwise indicated.
(A): Representative image of a primordial glandular placode in a newborn dual Wnt-reporter tracheal section immunofluorescently stained for β-Gal, GFP, and activated β-catenin (dephosphorylated on Ser37 and Thr41). Monochromatic images showing each channel separately are shown in gray scale. (B-C): Mean fluorescence intensity of nuclear localized β-Gal, H2B-GFP, and β-catenin was quantified in primordial glandular placodes using Hoechst 33342 to define nuclei and the Multi Wavelength Cell Scoring Application Module of Metamorph software. (B): Fluorescence intensity scatter plot of nuclear TCF/Lef:H2B-GFP (x-axis) vs. BAT-gal (y-axis) with point color indicating intensity of nuclear β-catenin. The Metamorph fluorescence intensity thresholds were set to define four classes of Wnt-reporter expressing cells and are indicated by the four quadrants: i, Wnt-reporter negative cells; ii, BAT-gal+ cells, iii, TCF/Lef:H2B-GFP+ cells, and iv, BAT-gal+ TCF/Lef:H2B-GFP+ double positive cells. (C): Average fluorescence intensity of nuclear β-catenin for the cell populations within the TCF/Lef:H2B-GFP and BAT-gal gating thresholds defined by the graph on the right depicting the classification of cell phenotypes from panel (B). Statistical comparisons between groups were determined by One-Way ANOVA and Bonferroni’s multiple comparison test: *** P<0.001 and **** P<0.0001. The dataset include analysis of 13 glandular placodes from four mice. (D): Representative image of an adult dual Wnt-reporter tracheal section immunofluorescently stained for β-Gal, GFP, and β-catenin. Monochromatic images showing each channel separately are shown in gray scale. Scale bars indicate 20 μms for all images.
Several phenotypic markers were used to characterize glandular BAT-gal+ cells by immunofluorescent staining for β-gal and the indicated makers. (A-E): Basal cell type markers cytokeratin 5 (CK5) (A), cytokeratin 14 (CK14) (B), integrin α-6 (Intα6) (C), Integrin β-4 (Intβ4) (D), and neuronal growth factor receptor (Ngfr) (E). (F-H): Additional markers included the myoepithelial cell marker α-smooth muscle actin (αSMA) (F), the mucous tubule marker Muc5AC (G), and the serous tubule marker lysozyme (Lyz) (H). (I): Quantitation of the % β-gal positive cells for each of the markers. Fluorescent micrographs (A through H) show maximum intensity projections of confocal z-stack images. Cells were scored using z-stack images in ImageJ to compile the graph in I. Data are shown as mean ± SEM of N=4 mice from multiple sections. White arrowheads show examples of cells that were scored as positive for CK5 (A), CK14 (B), or αSMA (F). Scale bars indicate 50 μms for all images.
Mice were injured with naphthalene and pulsed with BrdU 1 hr prior to harvesting tracheae on days 1, 3, 4, 5, or 6. Uninjured controls were also labeled with BrdU. (A): Tracheal sections immunofluorescently stained for cytokeratin 14 (CK14) and BrdU. (B): Quantification of BrdU+ proliferating cells as a percentage of total cells using DAPI nuclear counts. This quantification included proliferating epithelial cells only in the surface airway epithelium for regions of the trachea confined to cartilage ring C1-C2, C3-C4, and C5-C6. The midpoint between cartilage rings was used to draw the boundaries for quantification. There was a significant negative correlation in the abundance of BrdU+ cells with time post-injury for the proximal C1-C2 region of the trachea (Pearson correlation r=−0.52, P=0.0037). By contrast, there was a significant positive correlation in the abundance of BrdU+ cells with time post-injury for the distal C5-C6 region of the trachea (Pearson r=0.65, P=0.0001). Data are shown as mean ± SEM of N=6-8 mice per group. Cartilage rings are marked by C. Scale bars indicate 200 μms for all images.
(A,B): Double transgenic mice possessing the BAT-gal and Rosa26-flxtdTomatoStopflx-eGFP alleles were intranasally inoculated with recombinant Cre-expressing (Ad.Cre) adenovirus mixed with either recombinant Wnt3a-expressing adenovirus (Ad.Wnt3a) or a control transgene-negative adenovirus (Ad.Control). Tracheae were harvested at 5 days post-infection and sections were immunostained for β-gal, GFP and/or Ki67. Expression of eGFP was observed only in the tracheal SAE. (C): Adenoviral infection efficiency was determined by analyzing Cre mediated conversion of the Rosa26-flxtdTomatoStopflx-eGFP allele. There was no significant difference in the % eGFP positive signal in mice given Ad.Wnt3a or Ad.Control virus, indicating the efficiency of infection was similar in the two groups. (D): Mice inoculated with Ad.Wnt3a showed significantly greater activity of the BAT-gal reporter allele in the SAE as measured by the % of cells positive for β-gal (Two-way student’s t-test, *** P=0.0009). (E): Ad.Wnt3a infection led to significantly more proliferation in the SAE as measured by the % of cells positive for Ki67 (Two-way student’s t-test, ** P=0.0030). Data are shown as mean ± SEM of N=3-4 mice per group from multiple serial sections separated by at least 60 μm. The average count from each animal was used to calculate the SEM.
(A): Tracheae from mice harboring both BAT-gal and TCF/Lef:H2B-GFP reporter alleles were excised and bisected length-wise down the ventral/dorsal axis. Tracheal halves were placed on a surgifoam support with the airway lumen exposed to air and cultured in the presence of EdU to mark proliferating cells. Tracheal halves were treated with media supplemented with bovine serum albumin (BSA), Dkk1, or Wnt1 and Wnt3a. (B, C): Representative fluorescent staining of tracheal explant sections for EdU, β-Gal, and GFP at 3 days post-stimulation. Dashed lines indicate the surface airway epithelial basement membrane or the border of cricoid cartilage (CC). (D-F): Morphometric quantification of the % of epithelial cells in the SAE or SMGs positive for (D) Bat-gal, (E) TCF/Lef:H2B-GFP, or (F) EdU in explants treated with Wnt1/Wnt3a or Dkk1. (G): The fold change in % of proliferative cells (EdU+) between Wnt1/Wnt3a or Dkk1 treatment groups. (H-J): Morphometric quantification of the % of epithelial cells in the SAE or SMGs positive for (D) Bat-gal, (E) TCF/Lef:H2B-GFP, or (F) EdU in explants treated with Wnt1/Wnt3a or BSA. (K): The fold change in % of proliferative cells (EdU+) between Wnt1/Wnt3a or BSA treatment groups. Data in D-K are the mean ± SEM of N=4-7 explants. D-F and H-J utilized a two-tailed paired student’s t-test for statistical analysis. G and K utilized a Mann-Whitney U test for statistical analysis. * P<0.05, ** P<0.01. Scale bars represent 100 μm.
Double transgenic mice harboring Rosa26-rtTA/TetON:H2B-GFP alleles were induced with 5 days of doxycycline treatment followed by naphthalene injury at 1 week following the last doxycycline injection. (A): H2B-GFP label retention in the tracheal epithelium was visualized by immunofluorescent detection of GFP at the indicated days post-injury. (B,C): Quantification of the % of H2B-GFP positive cells (B) and absolute number of H2B-GFP cells (C) in the SMGs and SAE at various cartilage ring regions of the trachea. Percent epithelial H2B-GFP label retention changed significantly over time (Two-Way ANOVA, P<0.0001), and the regional differences in the percentage of cells retaining H2B-GFP label was significant (Two-Way ANOVA, P<0.0001), indicating that label retention significantly decreased from proximal epithelial regions (including the SMGs) to distal epithelial regions. These trends in H2B-GFP label retention were even more pronounced for the absolute total number of LRCs, but both time and regional significance remained the same. Statistical comparisons between groups are marked by colored lines and represent results from Holm-Sidak’s multiple comparisons post-test; * P<0.05, ** P<0.01, *** P<0.001, **** P<0.0001. Data are shown as mean ± SEM of N=3-8 mice from multiple serial sections separated by at least 60 μm. The average count from each animal was used to calculate the SEM. CC, cricoid cartilage; C1-C6, cartilage ring. Scale bars indicate 200 μms for all images.
Isolated glandular- and SAE-derived primary cultures of epithelial progenitor cells were established from ROSA-tdTomato or transgene negative (WT) mice in the presence of Rho-kinase inhibitor and expanded for several passages. Denuded tracheal xenografts were seeded with mixtures of epithelial cells derived from the SMG or SAE tracheal compartments. (A): Xenografts that were seeded with 90% WT SMG progenitors and 10% tdTomato SAE progenitors generated primarily WT (dtTomato negative) epithelium. (B): Xenografts that were seeded with 90% WT SAE cells and 10% tdTomato SMG cells generated primarily tdTomato epithelium, which included the SAE and gland-like epithelial structures. (C): An enlarged image of the boxed region in panel A showing a tdTomato negative gland-like structure generated from WT SMG cells. (D): An enlarged image of the boxed region in panel B showing a tdTomato positive gland-like structure generated from tdTomato SMG cells. Scale bars represent 50 μm.