Abstract
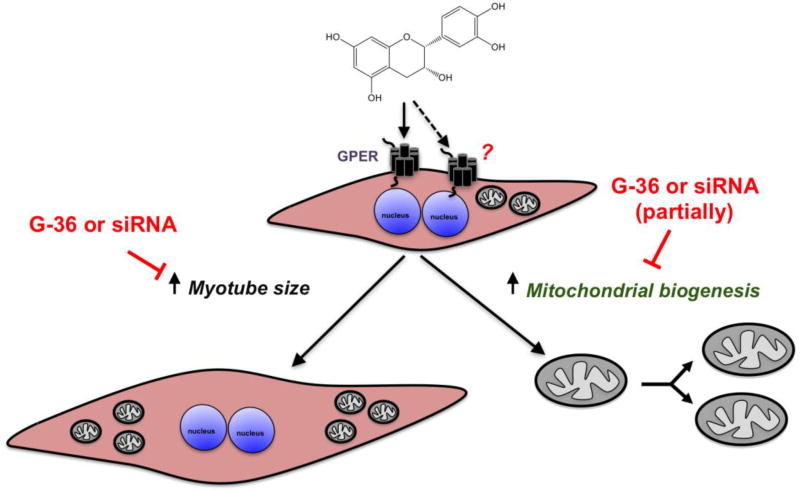
We have reported on the capacity of (−)-epicatechin ((−)-EPI) to stimulate mitochondrial biogenesis (MiB) in mouse skeletal muscle (SkM). However, the mechanisms mediating the effects of (−)-EPI are not fully understood. We previously identified a role of the G-protein coupled estrogen receptor (GPER) in modulating the vascular effects of (−)-EPI. We therefore tested the hypothesis that GPER mediates (at least in part) the stimulatory effects of (−)-EPI on MiB in SkM cells. As an in vitro model, we employed mouse SkM-derived C2C12 myoblasts differentiated into myotubes. Using confocal microscopy, we detected GPER at the cell surface and cytoplasm in C2C12 myotubes. Treatment with (−)-EPI (3 and 10 µM) resulted in the stimulation of MiB as per increases in mitochondrial inner (MitoTracker Red FM fluorescence staining) and outer membrane (porin protein levels) markers, transcription factors involved in MiB stimulation (i.e., nuclear respiratory factor-2 [NRF-2] and mitochondrial transcription factor A [TFAM] protein levels) and citrate synthase (CS) activity levels. (−)-EPI-treated myotubes were longer and wider compared to vehicle-treated myotubes. The effects of (−)-EPI on myotube mitochondria and cell size were larger in magnitude to those observed with the GPER agonist G-1. The chemical blockade and down-regulation (siRNA) of GPER evidenced a partial and complete blockade of measured endpoints following (−)-EPI- or G-1-treatment, respectively. Altogether, results indicate that GPER is expressed in muscle cells and appears to mediate to a significant extent, the stimulatory effects of (−)-EPI on MiB. Thus, GPER activation may account for the stimulatory effects of (−)-EPI on SkM structure/function.
Keywords: (−)-Epicatechin, GPER, mitochondrial biogenesis, skeletal muscle, C2C12
Graphical Abstract
1. Introduction
There is great interest in identifying compounds present in natural products that may aid in preserving and/or enhancing skeletal muscle (SkM) structure and function (Craig et al., 2015; Handschin, 2016). In this regard, our research group has provided evidence as to how a natural, small molecule present in high concentrations in cocoa that belongs to the family of flavanols, (−)-epicatechin ((−)-EPI) (Bhagwat, 2014), is capable of augmenting or restoring exercise capacity in mice (Nogueira et al., 2011) and humans (Ramirez-Sanchez et al., 2013; Taub et al., 2016). Such effects are linked to the stimulation of mitochondrial biogenesis (MiB) and function (Nogueira et al., 2011) via upstream activation of key inducers for both processes, including the AMP activated protein kinase (AMPK) (Papadimitriou et al., 2014; Si et al., 2011) and endothelial (e) and neuronal (n) nitric oxide synthases (eNOS, nNOS) (Moreno-Ulloa et al., 2013; Moreno-Ulloa et al., 2015a; Moreno-Ulloa et al., 2014; Ramirez-Sanchez et al., 2010). We demonstrated that (−)-EPI stimulates the activation of eNOS triggered by cell-surface receptors in endothelial cells (Moreno-Ulloa et al., 2015a). Furthermore, using in silico, in vitro and ex vivo approaches we provided evidence for the G-protein coupled estrogen receptor (GPER) acting as a candidate receptor for the vascular effects of (−)-EPI (Moreno-Ulloa et al., 2015a).
GPER is expressed in multiple tissues including SkM. However, its role in mediating changes in SkM structure and function is poorly understood (Prossnitz and Barton, 2011). Interestingly, the activation of GPER by the selective agonist, G-1 and natural estrogen 17β-estradiol, stimulates MiB in cardiac muscle and cultured cardiomyocytes, (Sbert-Roig et al., 2016). We therefore hypothesized, that (−)-EPI stimulates MiB in SkM cells (at least in part) via the activation of GPER. To address this issue mouse SkM-derived C2C12 myoblasts differentiated into myotubes were used as well as selective GPER agonists, antagonists and receptor (gene) silencing approaches.
2. Materials and Methods
2.1 Materials and reagents
Fetal bovine serum (FBS) was purchased from Biowest (México), antibiotic-antimitotic solution and Dulbecco’s Modified Eagle’s Media (DMEM)/Ham’s F12 (DMEM/F-12) (50/50 mix) with glutamine, HEPES and phenol red were from Mediatech Cellgro, Inc. (Herndon, VA, USA). BSA was from Amresco (Solon, OH). Hank's Balanced Salt Solution (HBSS) without phenol red, horse serum (HS), Halt™ protease and phosphatase inhibitor cocktail, DAPI (4’, 6-Diamidino-2-Phenylindole, Dihydrochloride), Lab-Tek II chamber slides, MitoTracker® Red FM, ActinGreen™ 488 ReadyProbes® reagent, Hoechst 33258, Pentahydrate (bis-Benzimide)-FluoroPure™ Grade, Opti-MEM I Reduced Serum Media, DMEM/F-12 (with glutamine and HEPES) without phenol red, and methanol-free formaldehyde (16 % in solution) were from Thermo Fisher Scientific (Waltham, MA, USA). Endo-porter transfection reagent was from Gene Tools (Philomath, OR, USA). Corning® CellBIND cell culture multiwell (6, 12 and 24 wells) plates, (−)-EPI, MISSION® siRNA Universal Negative Control #1, protease inhibitor cocktail, Thiazolyl Blue Tetrazolium Bromide (MTT) and dimethyl sulfoxide (DMSO) were obtained from Sigma Aldrich (St. Louis, MO, USA). Anti-GPER, GPER (mouse) specific siRNA and siRNA dilution buffer were from Santa Cruz Biotechnology (Santa Cruz, CA, USA). Primary antibodies, mouse anti-voltage-dependent anion-selective channel 1 (VDAC-1)/porin, rabbit anti-nuclear respiratory factor 2 (NRF-2) and rabbit anti-transcription factor A, mitochondrial (TFAM), MitoBiogenesis™ In-Cell ELISA Kit (colorimetric), secondary donkey anti-rabbit IgG conjugated to Alexa Fluor 594 were from Abcam (Cambridge, MA, USA). Rabbit anti-GAPDH primary antibody and anti-rabbit and -mouse horseradish peroxidase (HRP)-conjugated secondary antibodies were from Cell Signaling (Danvers, MA, USA). VECTASHIELD mounting medium with DAPI was from Vector Laboratories Inc. (Burlingame, CA, USA). Immobilon-P Membrane, PVDF transfer membrane was from EMD Millipore (Bedford, MA, USA). Enhanced chemiluminescence Plus Western blot detection kit was from Amersham Biosciences (Piscataway, NJ, USA). G-36 and G-1 were from Cayman Chemical (Ann Harbor, MI, USA). Citrate synthase (CS) activity kit was from Science Cell-Research Laboratories (Carlsbad, CA, USA).
2.2. Cell culture
Mouse C2C12 myoblasts were purchased from the American Type Culture Collection (ATCC, VA, USA). Cells were maintained at 37 °C in an incubator with humidified atmosphere of 5% CO2 and cultured in DMEM/F12 medium supplemented with 10% FBS and 1% antibiotic and antimitotic solution. Undifferentiated myoblasts were kept under sub-confluent conditions to avoid differentiation. In order to differentiate myoblasts into myotubes, FBS was replaced by 2% HS when myoblasts reached ≥ 80% confluence. Corning® CellBIND® tissue culture plates were used for experiments due to improved differentiation rate on this surfaces. The differentiation medium was replaced every day and myotube formation was monitored by transmitted-light microscopy (EVOS® XL Imaging System). Treatments were applied when myotube formation was ≥ 80%. We used cells between passages 6–8 for all experiments.
2.3. Immunofluorescence
C2C12 myoblasts were seeded onto glass slides pre-coated with 0.1% gelatin, and incubated for 24 h in growth medium and differentiated accordingly. When ready for visualization, myotubes were washed with PBS and then fixed with a freshly-prepared cold 4% formaldehyde in PBS solution for 10 min. Cells were permeabilized by washing them 3 × 5 min in PBS containing 0.1% Triton X-100, at room temperature. Thereafter, cells were blocked with 3% BSA and 0.3 M glycine (to quench free aldehydes from fixation) in PBS solution for 1 h. Next, slides were incubated with a polyclonal antibody against the GPER N-terminal domain (Moreno-Ulloa et al., 2015a) (1:100, 3 % BSA in PBS) overnight at 4°C and thereafter washed 3× with PBS. Alexa Fluor 594-labeled anti-rabbit (1:400, PBS) was then used as secondary antibody for 1 h at room temperature and washed 3× with PBS. Finally, slides were dried vertically for 10 min and framed on VECTASHIELD mounting medium with DAPI. Cells were imaged with an LSM 800 with Airyscan (ZEISS) super-resolution confocal microscope at 4096 × 4096 pixel resolution with a 63× oil, N.A. 1.4 objective. Additionally, images were collected using an Olympus FV1000 Inverted Confocal IX81 Microscope at 1024 × 1024 pixel resolution with a 60× oil objective lens. Images were processed with either Photoshop CS6 (Adobe version 13.0.6. ×64) or ImageJ software (1.48 version).
2.4. Down-regulation of GPER by siRNA
C2C12 myoblasts were grown on 12-well plates and allowed to differentiate into myotubes until 60–70% confluence. Thereafter, cells were incubated with 0.5 ml/well Opti-MEM 1 medium (no phenol red) containing Endo-porter (final concentration 6 µM, according to the manufacturer’s instructions) and either non-targeting siRNA or GPER specific siRNA (final concentration 0.1 µM) for 6 h. Next, media-containing Endo-porter was removed and fresh DMEM/F-12 (no phenol red) differentiation medium was added to each well and cells were incubated for an additional 48 h. Cells were then collected and proteins extracted as described in section 2.10. GPER knockdown efficiency was assessed by Western blot analysis as described in section 2.11.
2.5. Cell treatment
Compounds were usually applied to wells containing ≥ 80% myotubes in DMEM/F-12 media without phenol red using 6-well, 12-well or 96-well plates. Drugs were used as follows (concentration, preincubation [inhibitors] or incubation times [agonists]): G-36 (0.1 and1 µM, 30 min), (−)-EPI (3 and 10 µM, 48 h), and G-1 (0.1–1 µM, 48 h). The 48 h treatment time point was selected based on a previous study, whereby (−)-EPI significantly stimulated MiB (Moreno-Ulloa et al., 2013). The GPER antagonist, G-36, was present during ligand stimulation. G-36 and G-1 were dissolved in DMSO and (−)-EPI in water. Accordingly, all wells contained an equal amount of DMSO (<0.5%) as vehicle during ligand stimulation and thereof, titled as control in all plots. Media and compounds were replaced every 24 h. For siRNA based experiments, myotubes were treated with either DMSO (<0.5%) as vehicle, 10 µM (−)-EPI or 0.1 µM G-1 for 48 h after transfection (6 h)+growth time points (48 h) as stated in section 2.5. Media and compounds were replaced every 24 h. Accordingly, all wells contained Endo-porter transfection reagent.
2.6. Cell viability
In order to assess the potential toxicity or proliferative effects of ligands on C2C12 myotubes, we performed a cell viability test (MTT) with different concentrations of the compounds used. Ten thousand cells were seeded into clear 96-well flat bottom plates (previously coated with 0.1% gelatin), allowed to grow for 24 h and then differentiated as stated above. After 48 h of treatment, medium was aspirated from plates, cells washed once with 100 µl HBSS and subsequently 100 µl of 0.5 mg/ml MTT in HBSS were added to each well. Plates were incubated for 1 h at 37°C, followed by aspiration of MTT solution, addition of 100 µl DMSO per well (to dissolve formazan crystals) and incubation at 37°C for 15 min. Cell viability was evaluated by changes in absorbance at 570 nm using an Epoch™ Microplate Spectrophotometer.
2.7. Cell morphology
Two types of image analysis were performed using ImageJ software (1.48 version) in order to assess for changes in cell morphology after cell treatment with ligands: myotube width and length. Myotubes were identified as elongated cells with at least two well-defined nuclei by means of transmitted-light microscopy using 10×, 20× and 40× air objectives (EVOS™ XL Cell Imaging System) and fluorescence microscopy (EVOS® FLoid® Cell Imaging Station) using a fixed 20× air objective. For visualization of myotubes cytoskeleton morphology and cell perimeter, cells were fixed with a freshly-prepared cold 4% formaldehyde in PBS solution for 10 min, washed with PBS and blocked with 3% BSA and 0.3 M glycine (to quench free aldehydes from fixation) in PBS solution for 1 h. Next, cells were stained with ActinGreen™ 488 reagent (fluorescently-labeled phalloidin) and Hoechst 33258 (2 µg/ml) for 20 min at RT to visualize F-actin filaments and nuclei, respectively. In each image (using 3 different random fields), up to 20 representative measurements of myotubes width and length were collected. Cell length and width were calculated by tracing lines (calibrated by image scale) along the cell long axis and across the wider portion of the myotubes, respectively. All images were analyzed by two subjects blinded with respect to allocation of treatments.
2.8. Assessment of MiB
As a means to evaluate the effects of (−)-EPI on MiB, we employed a MitoBiogenesis™ In-Cell ELISA kit (MitoSciences Inc., Eugene, OR, USA) as per the manufacturer’s instructions with minor modifications. This kit relies on the simultaneous detection of SDH-A, a subunit of the succinate dehydrogenase or mitochondrial Complex II (nuclear DNA [nDNA]-encoded protein) and COX-I, a subunit of the cytochrome c oxidase or mitochondrial complex IV (mitochondrial DNA [mtDNA]-encoded subunit), whereby an increase in the ratio of COX-I/SDH-A indicates stimulation of MiB. Briefly, C2C12 myoblast were seeded (10,000 cells/well) in 96-well plates (coated with gelatin 0.1%) and allowed to grow until they reached 70–80% confluence. Next, cells were switched to differentiation medium for 3–5 d (when ≥ 80 % myotubes were observed per field). Cells were treated accordingly as stated in the section of 2.4. Thereafter, media were removed and cells washed with PBS, and subsequently fixed with freshly prepared 4% formaldehyde in PBS solution for 20 min. After cell fixation, the permeabilization, blocking, and antibody incubation processes were done according to the manufacturer’s instructions. Protein levels of SDH-A and COX-I were measured at 405 nm and 600 nm wavelengths, respectively. Additionally, in order to assess for differences in cell density, cell nuclei were stained with DAPI for 30 min at RT, and images were taken using an EVOS® FLoid® Cell Imaging Station. ImageJ software (1.48 version) was used for the analysis of cell density by counting the number of nuclei in each well. The ratios of COX-I/DAPI, SDH-A/DAPI and COX-I/SDH-A/DAPI were calculated.
2.9. Assessment of inner mitochondrial mass
Mitochondrial inner mass was evaluated by fluorescence microscopy (EVOS® FLoid® Cell Imaging Station) in myotubes stained with MitoTracker Red FM (Presley et al., 2003). Briefly, C2C12 myoblast cells were seeded onto 12-well plates (coated with 0.1% gelatin) at a density of 20,000–50,000 cells per well and allowed to grow until they reached 70–80% confluence. Myoblasts were differentiated until ≥80% myotubes were formed and treated as described in section 2.4. Next, cells were washed with PBS and stained with 200 nM MitoTracker Red FM for 30 min at 37 °C. Cells were washed with PBS and images (i.e. transmitted-light and red fluorescent channels) immediately taken by a subject unaware (blinded) of treatment allocation within the culture plates. Subsequently, two subjects blinded with respect to the corresponding relationship between image and treatment, calculated the corrected total cell fluorescence (CTCF) tool from Image J software (version 1.48) using the following equation: CTCF = Integrated density-(Area of selected cell × mean fluorescence of background readings). At least 15 myotubes per field were recorded.
2.10. Total protein extraction
Cells were seeded onto 6-well plates at a density of 300,000 cells/well and allowed to achieve 80% confluence. Cells were differentiated and treated as stated above in section 2.4, and at the end of treatment, cells were washed 3× with cold HBSS (0.5 ml/well) and lysed in 200 µl of ice cold buffer (140 mmol/l NaCl, 2 mmol/l EDTA, 1% Triton X-100 and 0.1% SDS, 1 mmol/l PMSF, 2 mmol/l Na3VO4 and 1 mmol/l NaF in 50 mmol/l Tris-HCl solution) supplemented with protease and phosphatase inhibitor cocktails. Homogenates were sonicated for 10 min at 4°C, and centrifuged (20 817 × g) for 10 min to remove cell debris. The supernatant was recovered and total protein concentration was measured using the Bradford method.
2.11. Western blot
From the protein extraction step, 30 µg of protein was loaded onto a Bolt™ 4–12% Bis-Tris Plus gel (10 wells), electrotransferred, incubated for 1 h in blocking solution (5% nonfat dry milk [NFM] or 5% BSA in TBS [tris-buffered saline solution] plus 0.1% Tween 20 [TBS-T]), and followed by either 1 h incubation at room temperature or overnight incubation at 4 °C with primary antibodies. Primary antibodies were typically diluted 1:1,000 or 1:2,000 in TBS-T plus 5% BSA or 5 % NFM. Membranes were washed (3× for 5 min) in TBS-T and incubated 1 h at room temperature in the presence of HRP-conjugated secondary antibodies diluted 1:5,000 in blocking solution. Membranes were again washed 3× in TBS-T and the immunoblots were developed using an ECL detection kit by means of digital imaging (ChemiDoc™ XRS+System, BIO-RAD) or X-ray film. The band intensities were digitally quantified and proteins normalized against GAPDH levels.
2.12. Assessment of CS activity
From the protein extraction step, 10 µg of protein was used for CS activity assessment. This amount of protein yielded a linear response of CS activity (as per changes in absorbance) over time (data not shown). CS activity was determined using the citrate synthase kit (ScienceCell-Research Laboratories) according to manufacturer’s instructions as described previously (Moreno-Ulloa et al., 2013).
2.13. Statistical analysis
Select data was normalized to the respective control mean values and is expressed as means ± S.E.M. (unless otherwise stated) derived from at least 3 independent experiments performed each in quadruplicate. Statistical analysis of data was performed by either using one-way ANOVA followed by the Tukey/Dunnett’s post hoc tests or Kruskal-Wallis test followed Dunn’s multiple comparisons test, as appropriate. A P≤0.05 was considered statistically significant. ****P≤0.0001, ***P≤0.001, **P≤0.01, *P≤0.05, #P>0.05 (non significant). Graphs were created and analyzed using Prism 3.0 (GraphPad Software, San Diego, CA).
3. Results
3.1. Differentiation of C2C12 myoblasts into myotubes
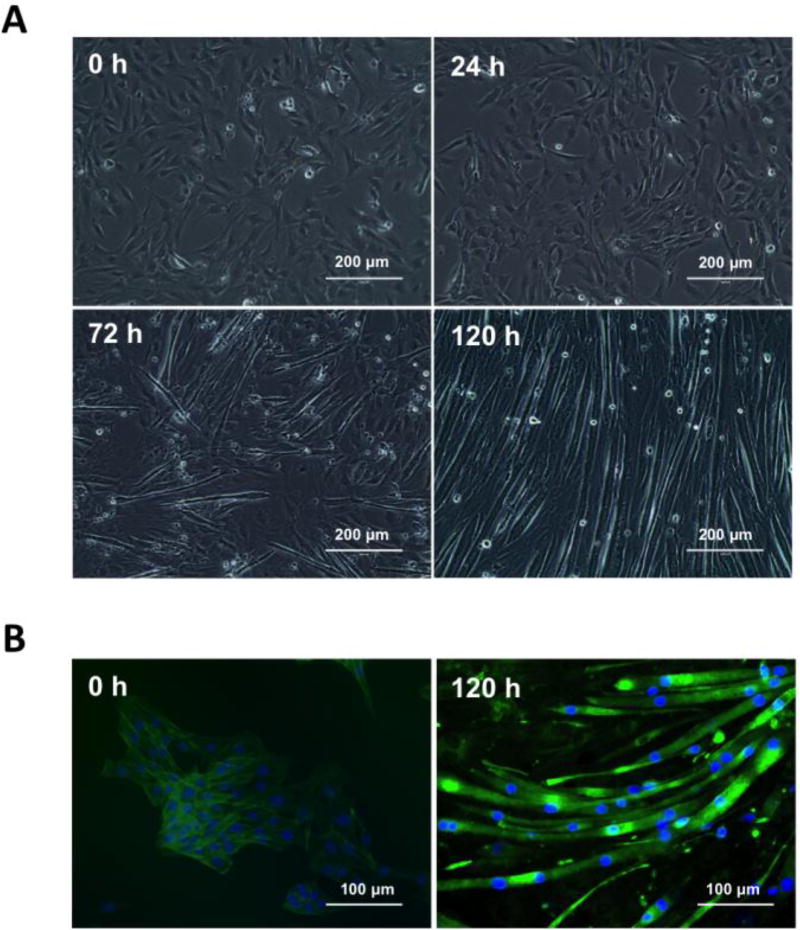
The differentiation rate of C2C12 myoblast at 24, 72 and 120 h time points is shown in Fig. 1A and include a representative set of images obtained from cells cultured in 12-well plates. The number of myotubes per field increased as a function of time in all different culture plates tested (6-, 12- or 96-well plates, data not shown). Typically, the acquisition of a myotube phenotype became noticeable > 72 h as per the presence of elongated, multinucleated cells (Burattini et al., 2004). By > 120 h, we obtained ≥ 80% myotube confluence (as calculated by the ratio of total myotubes/myotubes+undifferentiated cells) and a fusion index of 76.8 ± 2.4 (as calculated by the ratio of nuclei number in myotubes with two or more nuclei/total number of nuclei) (Bajaj et al., 2011). As reported by others, differentiated myotubes also denoted higher fluorescence levels and filament actin bundles when compared to undifferentiated myoblasts (Fig. 1B) (Yamamoto et al., 2008).
Figure 1. Live and fixed cells imaging of C2C12 differentiation.
(A) Representative images obtained from C2C12 cells seeded onto 12-well culture dishes illustrating their differentiation rate at 24, 72 and 120 h post incubation in DMEM with 2% horse serum (HS) (differentiation media). Images were recorded by transmitted-light microscopy using a 20× air objective (EVOS® XL Imaging System). Scale bar = 200 µm. (B) Representative images derived from C2C12 non-differentiated (day 0) and differentiated (day 5) cells cultured onto 12-well culture dishes. For visualization of cytoskeleton (F-actin filaments) and nuclei, formaldehyde fixed cells were stained with fluorescently-labeled phalloidin and Hoechst 33258 for 20 min at room temperature. Cell images were recorded by fluorescence microscopy (EVOS® FLoid® Cell Imaging Station). Scale bar = 100 µm.
3.2. GPER localization in C2C12 myotubes
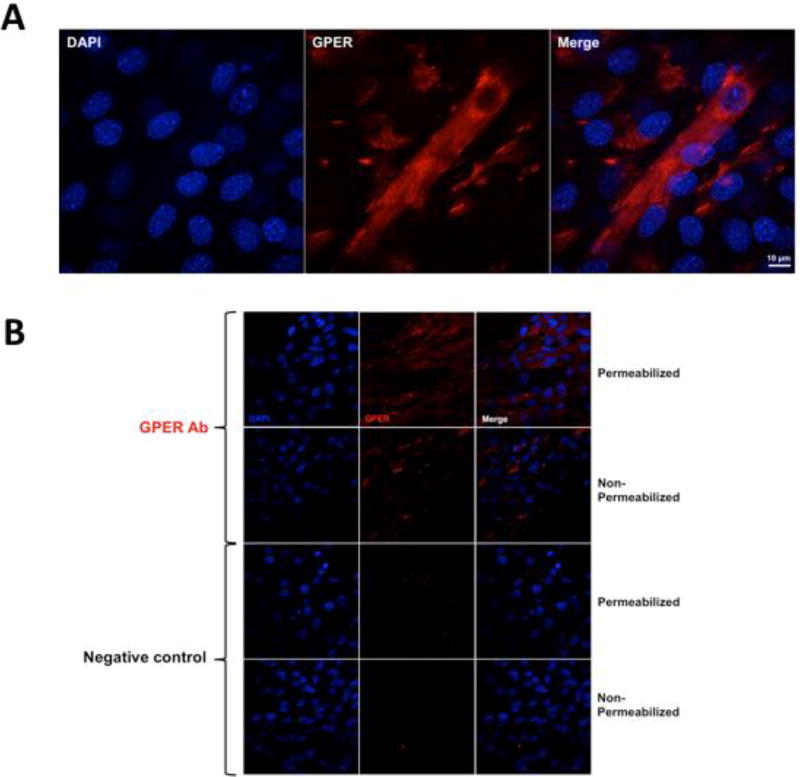
To evaluate the presence of GPER in myotubes, we used immunofluorescence detection by super-resolution and regular confocal microscopy using a polyclonal antibody against the receptor N-terminal domain. Fig. 2A illustrates the presence and cytoplasmic distribution of GPER (red fluorescence) in a representative permeabilized myotube. As controls, we performed a set of experiments using fixed permeabilized and non-permeabilized myotubes that were only incubated with secondary antibody (conjugated to Alexa Fluor 594-labeled anti-rabbit), whereby no significant fluorescence levels were detected when compared to cells incubated with GPER antibody (Fig. 2B). GPER immunostaining of non-permeabilized cells shows increased red fluorescence signals vs. control cells, suggesting the presence of this receptor at the cell membrane (Fig. 2B) (Ronda and Boland, 2016). Cell nuclei are shown in blue.
Figure 2. Localization of GPER in C2C12 myotubes.
(A) Representative confocal images derived from permeabilized and non-permeabilized C2C12 myotubes. A polyclonal antibody against the GPER N-terminal domain and secondary donkey anti-rabbit IgG conjugated to Alexa Fluor 594 (red signals) was used. As a negative control, cells were only incubated with secondary antibody. DAPI was used to stain nuclei (blue). Images were collected using an Olympus FV1000 Inverted Confocal IX81 Microscope at 1024 × 1024 pixel resolution with a 60× oil objective lens. (B) Representative confocal super-resolution microscopy images derived from a Z-stack of fixed and permeabilized C2C12 myotubes using a polyclonal antibody against the GPER N-terminal domain and secondary donkey anti-rabbit IgG conjugated to Alexa Fluor 594 (red signal). DAPI was used to stain nuclei (blue signal). Images were collected with an LSM 800 with Airyscan (ZEISS) using a 63×, N.A. 1.4 objective. Scale bar = 10 µm.
3.3. Effects of ligands on C2C12 myotubes viability
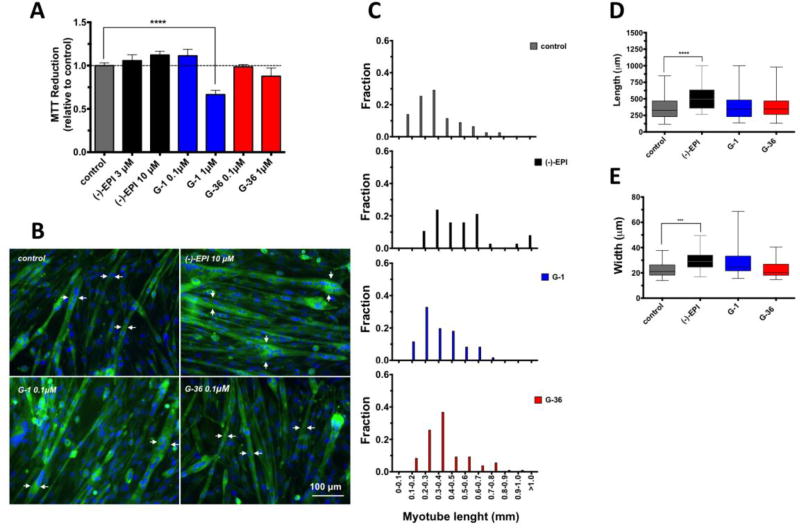
We tested the effects of the GPER antagonist (G-36), the agonist (G-1) and that of (−)-EPI on cell viability by means of the MTT reduction assay. The concentrations and incubation times chosen for the ligands and (−)-EPI were based on previous studies performed by others (Dennis et al., 2011; Meyer et al., 2014) and us (Moreno-Ulloa et al., 2013; Moreno-Ulloa et al., 2015a) in which, significant stimulatory and inhibitory effects (with a lack of apparent toxicity) were observed for G-1 and G-36, respectively. As shown in Fig. 3A, treatment with 1 µM of G-1 for 48 h (right blue column) decreased C2C12 myotube viability as denoted by a decrease in MTT reduction vs. control cells (gray column). There also appears to be a tendency for cell viability reduction with G-36 at 1 µM (right red column) vs. control cells. No significant changes were observed in (−)-EPI-treated myotubes. Thus, for subsequent experiments, G-1 and G-36 were both used at 0.1 µM, a concentration that did not affect C2C12 myotube viability.
Figure 3. Effects of ligands on C2C12 myotube viability and morphology.
(A) Cells were treated with ligands at different concentrations or vehicle for 48 h. Cell viability was evaluated by MTT reduction. Data is expressed as mean ± S.E.M. derived from at least 3 independent experiments performed each in quadruplicate. ****P ≤ 0.0001 vs. control as analyzed by one-way ANOVA followed by the Dunnett’s post hoc test. (B) Length and width was visualized by fluorescence microscopy (EVOS® FLoid® Cell Imaging Station) in myotubes (cells with ≥2 nuclei) treated with (a) vehicle, (b) (−)-EPI 10 µM, (c) G-1 0.1µM and (d) G-36 0.1µM for 48 h. For visualization of cell morphology cells were stained with fluorescently-labeled phalloidin (cytoskeleton) and Hoechst 33258 (nuclei) for 20 min at room temperature. White arrows denote representative myotubes width. Scale bar = 100 µm. (C) Histograms of myotubes lengths (mm) in cells treated with either vehicle or ligands. (D) Quantification of myotubes length (µm). Data is expressed as median and interquartile range derived from at least 3 independent experiments performed each in quadruplicate. ****P ≤ 0.0001 vs. control as analyzed by Kruskal-Wallis test followed Dunn’s multiple comparisons test. (E) Quantification of myotubes width (µm). Data is expressed as median and interquartile range derived from at least 3 independent experiments performed each in quadruplicate. ***P ≤ 0.001 vs. control as analyzed by Kruskal-Wallis test followed Dunn’s multiple comparisons test.
3.4. Effects of ligands on C2C12 myotubes morphology
We investigated the effects of ligands on myotube length and width (morphology) 48 h after treatment. Since select (−)-EPI-treated cells (Fig. 3B) were longer than the field imaged with a low-power objective, we ranked myotube’s length into groups (as per fractions) and applied a statistical analysis on ranks as described by others (Bettadapur et al., 2016). As shown in Fig. 3B, 3C, 3D and 3E, (−)-EPI treatment resulted in longer and wider myotubes vs. vehicle- or G-1-treated cells. There was a trend towards an increase in myotube width in G-1-treated cells (Fig. 3E). As a negative control we used G-36, which did not affect myotube length or width.
3.5. Concentration response of (−)-EPI on MiB related endpoints
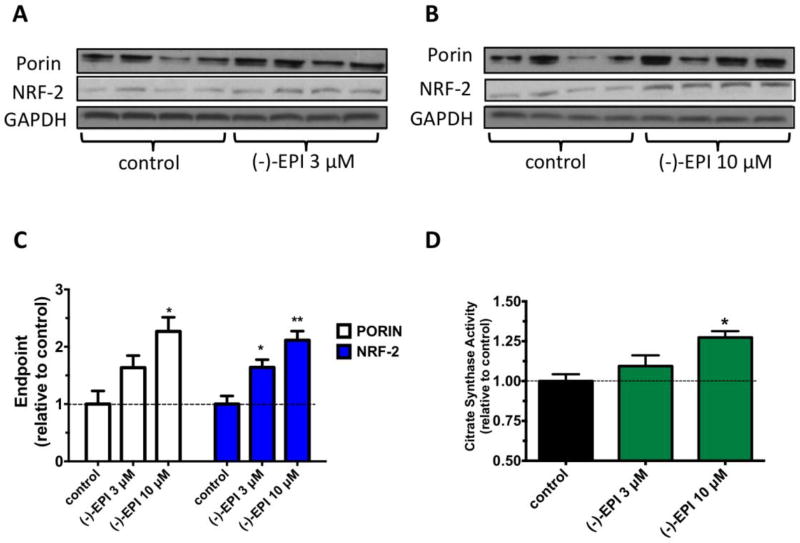
To evaluate (−)-EPI effects on MiB, we examined protein levels of porin (VDAC; a marker of the outer mitochondrial membrane) (Krimmer et al., 2001) and NRF-2 (a transcription factor activated by the peroxisome proliferator-activated receptor-γ coactivator-1α, the “master regulator” of MiB) (Scarpulla, 2008). The effects of (−)-EPI on porin and NRF-2 were concentration-dependent, whereby 10 µM (−)-EPI resulted in a significantly higher increase on both protein levels (Figs. 4B and Fig. 4C) vs. 3 µM (Figs. 4A and Fig. 4C). CS is a key regulatory enzyme of the tricarboxylic acid cycle and the measurement of its activity is used as a marker of SkM mitochondrial function (Larsen et al., 2012). Fig. 4D shows that (−)-EPI at 10 µM led to a significant increase in CS activity vs. control (0.52±0.01 vs. 0.41±0.01 unit/mg protein, **P ≤0.01). (−)-EPI was not tested at concentrations > 10 µM due to the fact that such concentrations were seen as less physiologically relevant (Barnett et al., 2015; Monahan et al., 2011). Hence, for subsequent experiments (−)-EPI was used at 10 µM, as this concentration is easily achieved in plasma after the oral/intraperitoneal administration of pure (−)-EPI in humans (Barnett et al., 2015) and animals (Chen and Hsu, 2009; Piskula and Terao, 1998).
Figure 4. Effects of (−)-epicatechin ((−)-EPI) on markers of mitochondrial biogenesis (MiB).
Representative immunoblots of porin (also known as voltage dependent anion channel) and nuclear respiratory factor-2 (NRF-2) protein levels after treatment with either (A and B) vehicle, (A) (−)-EPI 3 µM or (B) (−)-EPI 10 µM for 48 h. As a loading control GAPDH was used. (C) Quantification of porin and NRF-2 protein levels by densitometric analysis. (D) Citrate synthase activity levels were measured in the supernatant of cell’s lysates treated with either vehicle, 3 µM (−)-EPI or 10 µM (−)-EP and values normalized by protein content. Data was normalized to the mean values of control (vehicle group) and expressed as mean ± S.E.M. derived from 4 independent experiments each in quadruplicate. *P≤ 0.05 vs. control, **P≤ 0.01 vs. control as analyzed by one-way ANOVA followed by the Tukey post hoc test. Black horizontal intermittent line indicates the adjusted mean (1) of control (vehicle group) across all groups.
3.6. Inhibitory effects of G-36 and GPER down-regulation on (−)-EPI-induced MiB endpoints
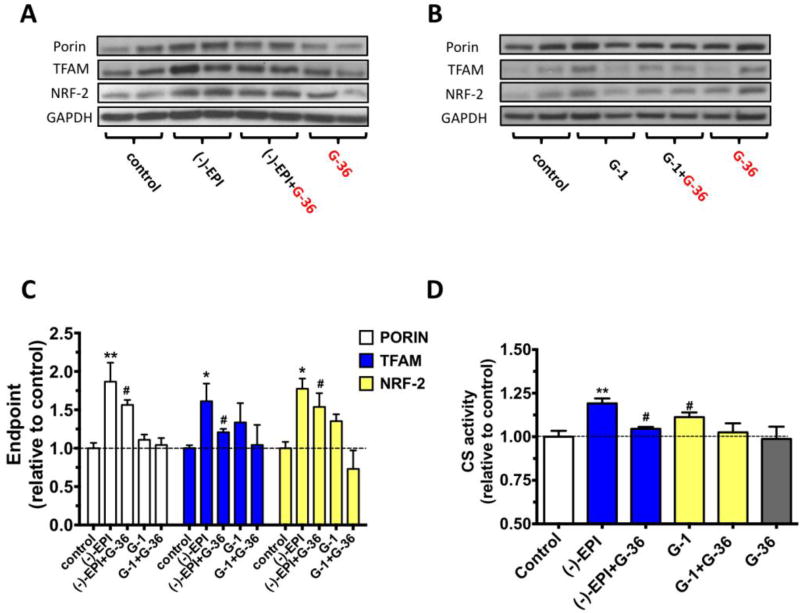
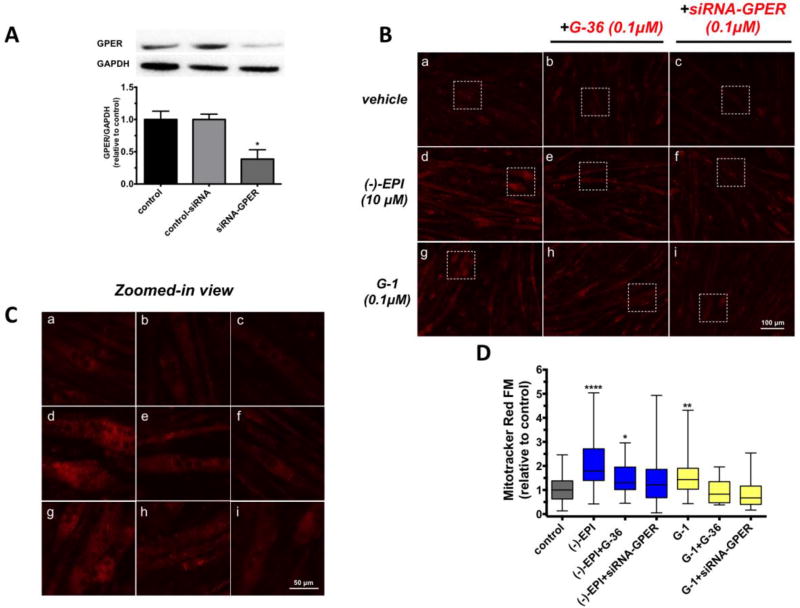
We analyzed the effects of G-36 on (−)-EPI-induced increases in porin, NRF-2 and TFAM (a mitochondrial transcription factor essential for mitochondrial DNA transcription and replication) protein levels (Picca and Lezza, 2015; Virbasius and Scarpulla, 1994). As shown in Figs. 5A and 5C, G-36 attenuated (−)-EPI induced increases in porin ((−)-EPI ~1.9-fold increase vs. control, **P≤0.01; (−)-EPI+G-36 ~1.6-fold increase vs. control, #P>0.05) TFAM ((−)-EPI ~1.7-fold increase vs. control, *P≤0.05; (−)-EPI+G-36 ~1.2-fold increase vs. control, #P>0.05) and NRF-2 ((−)-EPI ~1.8-fold increase vs. control, *P≤0.05; (−)-EPI+G-36 1.5-fold increase vs. control, #P>0.05) proteins levels as well as those of CS activity ((−)-EPI ~1.2-fold increase vs. control, **P≤0.01; (−)-EPI+G-36 vs. control, #P>0.05). The effects of the GPER agonist G-1 were also evaluated. Data from Figs. 5B and 5C evidenced trends towards increases in TFAM (~1.3-fold increase vs. control) and NRF-2 (~1.3-fold increase vs. control) protein levels, as well as its stimulatory effects on CS activity (~1.12-fold increase vs. control) by G-1 treatment, whereby G-36 completely blocked such trends towards increased levels. To further assess the role of GPER in mediating the effects of (−)-EPI on MiB, we first knocked-down GPER expression by using a specific siRNA targeting mouse GPER sequence. Western blot analysis revealed a reduction of ~62% in GPER protein levels in myotubes treated with siRNA targeting GPER when compared to myotubes transfected with a non-targeting siRNA (Fig. 6A).
Figure 5. Effect of chemical blockade of GPER on (−)-epicatechin ((−)-EPI) induction of markers of mitochondrial biogenesis (MiB).
Representative immunoblots of porin, mitochondrial transcription factor A (TFAM) and nuclear respiratory factor-2 (NRF-2) protein levels after treatment with either 10 µM (−)-EPI (A) or 0.1 µM G-1 (B) (GPER agonist) for 48 h with or without 0.1 µM G-36 (GPER antagonist). (C) Quantification of porin, TFAM and NRF-2 protein levels by densitometric analysis. (D) Citrate synthase activity levels were measured in the supernatant of cell’s lysates treated with either vehicle, 10 µM (−)-EPI or 0.1 µM G-1 with or without 0.1 µM G-36 and values normalized by protein content. Data was normalized to the mean values of control (vehicle group) and expressed as mean ± S.E.M. derived from 4 independent experiments each in quadruplicate. *P≤ 0.05 vs. control, #P> 0.05 vs. control as analyzed by one-way ANOVA followed by the Dunnett’s post hoc test. Black horizontal intermittent line indicates the adjusted mean (1) of control (vehicle group) across all groups.
Figure 6. Effect of chemical blockade and down-regulation of GPER on (−)-epicatechin ((−)-EPI) induction of mitochondrial mass.
(A) Representative immunoblots of C2C12 myotubes treated with either 6 µM Endo-porter transfection reagent (control), transfection reagent+0.1 µM non-targeting siRNA (control-siRNA) or transfection reagent+0.1 µM siRNA targeting GPER (siRNA-GPER) for 6 h. Cells were then allowed to grow for an additional 48 h and proteins extracted for Western blot analysis. (B) Representative fluorescence images from C2C12 myotubes treated with either vehicle, 10 µM (−)-EPI or 0.1 µM G-1 (GPER agonist) with or without 0.1 µM G-36 (GPER antagonist) and 0.1 µM siRNA targeting GPER (see methods section for knockdown conditions). Live cell imaging of inner mitochondrial mass was performed by staining myotubes with 200 nM MitoTracker Red FM (Presley et al., 2003) for 30 min and visualized using fluorescence microscopy with a 20× air objective (EVOS® FLoid® Cell Imaging Station). (C) Zoomed-in view of representative fields (white squares) of images in B. (D) Quantification of data derived from MitoTracker Red staining. Fluorescence levels per myotubes were assessed by analysis of the corrected total cell fluorescence (CTCF) tool from Image J software (version 1.48) using the following equation: CTCF = Integrated density-(Area of selected cell × mean fluorescence of background readings). At least 10 myotubes per field were recorded. Data is expressed as median and interquartile range derived from at least 3 independent experiments performed each in quadruplicate. Data was normalized to the median values of control (set as 1). ****P≤ 0.0001 vs. control, **P≤ 0.01 vs. control, as analyzed by Kruskal-Wallis test followed Dunn’s multiple comparisons test.
As an endpoint of MiB, we evaluated changes in fluorescence levels of a selective dye (MitoTracker Red FM) targeting the inner mitochondrial membrane (Presley et al., 2003) in myotubes transfected with siRNA and treated with (−)-EPI. As illustrated in Fig. 6B, 6C and 6D (−)-EPI-treated myotubes show a significant increase in CTCF median values vs. control ((−)-EPI ~1.8-fold increase vs. control, ****P≤0.0001), an effect that is attenuated by G-36 (~62% reduction) and blocked by siRNA targeting GPER. To a lesser degree than (−)-EPI, G-1 significantly increased CTCF levels vs. control (G-1 ~1.4-fold increase vs. control, *P≤0.001), an effect that was completely blocked by G-36 and siRNA targeting GPER (Fig. 6B, 6C and 6D).
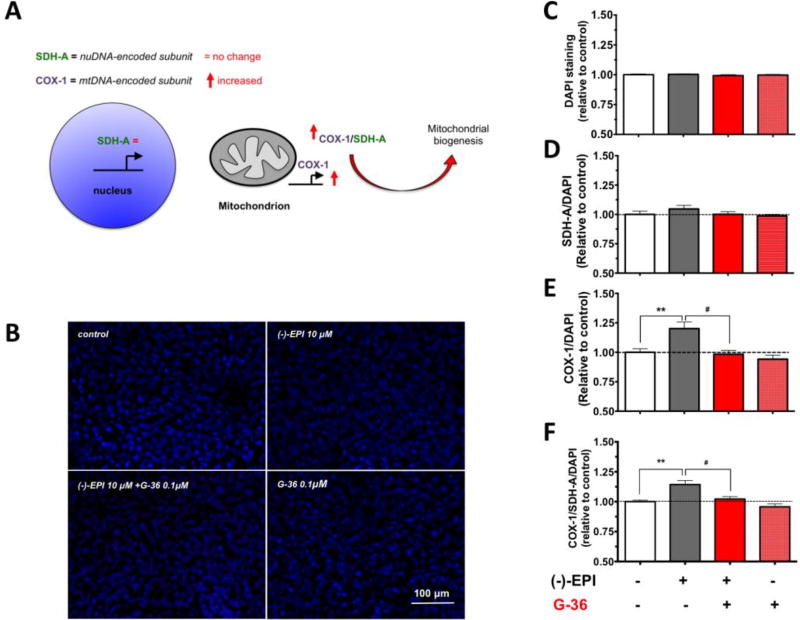
In addition to Western blot and fluorescence imaging data, we employed an In-cell ELISA kit that allows the simultaneously assessment of changes in the electron transport chain constituents codified by nDNA (SDH-A) or mtDNA (COX-I), whereby an increase in the ratio of COX-I/SDH-A is suggestive of MiB (Fig. 7A). The changes in SDH-A and COX-I protein levels were normalized by cell density according to the analysis of DAPI (nuclei) staining. As shown in Fig. B and Fig. C, no significant differences were found in nuclei abundance after treatment with ligands. On the other hand, (−)-EPI augmented mtDNA-codified protein levels (Figs. 7E and 7F) (~20% increase over control, **P≤0.001) without changing the nDNA-codified protein levels vs. control (Fig. 7D) an effect that was blocked by G-36. Thus, the COX-I/SDH-A ratio (normalized by cell density) was significantly increased indicating the stimulation of MiB by (−)-EPI.
Figure 7. (−)-Epicatechin ((−)-EPI) stimulates mitochondrial biogenesis (MiB) via GPER activation.
C2C12 myotubes were obtained on 96-well plates and treated with either vehicle or 10 µM (−)-EPI with or without 0.1 µM G-36 (GPER antagonist) for 48 h. (A) Relative rates of MiB were assessed using an In-cell ELISA assay detecting simultaneous protein levels of a nuDNA-encoded protein (SDH-A) and mtDNA-encoded protein (COX-I) in each group. The ratio of COX-I and SDH-A protein levels reflects the rate of MiB. (B) To assess for changes in cell density, nuclei was stained with DAPI and (C) quantified in each group. The ratios between (D) SDH-A/DAPI, (E) COX-I/DAPI, and (F) COX-I/SDH-A/DAPI were calculated. Data was normalized to the mean values of control (vehicle group) and expressed as mean ± S.E.M. derived from 4 independent experiments each in quadruplicate **P≤0.01, #P>0.05 as analyzed by one-way ANOVA followed by the Tukey post hoc test. Black horizontal intermittent line indicates the adjusted mean (1) of control (vehicle group) across all groups.
3.7. Inhibitory effects of G-36 and GPER down-regulation on (−)-EPI-induced myotube growth
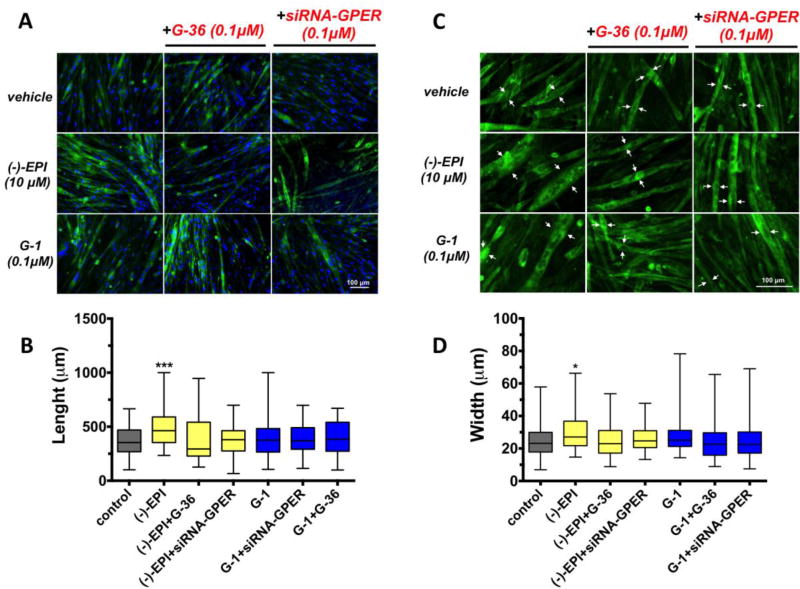
We evaluated the involvement of GPER in mediating the stimulation of myotube growth by (−)-EPI using G-36 and siRNA targeting GPER. Representative fluorescence images (cytoskeleton in green) are shown in Fig. 8A and Fig. 8C (images with higher magnification). The chemical blockade and down-regulation of GPER blocked (−)-EPI-induced increases in myotube length (Figs. 8A and Fig. 8B) and width (Figs. 8C and 8D). G-1 had no significant effect on myotubes growth. White arrows denote myotube width (from 2 representative cells in the field) from the wider part of the myotubes in each condition (Fig. 8C).
Figure 8. (−)-Epicatechin ((−)-EPI) stimulates C2C12 myotube growth via GPER activation.
Cell length and width was visualized by fluorescence microscopy (EVOS® FLoid® Cell Imaging Station) in formaldehyde fixed myotubes (cells with ≥2 nuclei). For visualization of cytoskeleton (F-actin filaments) and nuclei cells were stained with fluorescently-labeled phalloidin and Hoechst 33258 for 20 min at room temperature, respectively. (A) Representative fluorescence images corresponding to cells treated with either DMSO vehicle (control), 10 µM (−)-EPI or 0.1 µM G-1 (GPER agonist) with or without 0.1 µM G-36 (GPER antagonist) and 0.1 µM siRNA targeting GPER (see methods section for knockdown conditions). Scale bar = 100 µm. (B) Representative set (same treatments as in A) of fluorescence images zoomed-in. Nuclei staining were omitted for better visualization. Scale bar = 100 µm. (C) Quantification of myotubes length (µm). Data is expressed as median and interquartile range derived from at least 3 independent experiments performed each in quadruplicate. ***P≤ 0.001 vs. control as analyzed by Kruskal-Wallis test followed Dunn’s multiple comparisons test. (D) Quantification of myotubes width (µm). Data is expressed as median and interquartile range derived from at least 3 independent experiments performed each in quadruplicate. *P≤ 0.05 vs. control as analyzed by Kruskal-Wallis test followed Dunn’s multiple comparisons test. White arrows denote representative myotubes width at the wider portion of the cell.
4. Discussion
There is great interest in identifying safe and effective natural compounds that may aid in preserving and/or enhancing SkM structure and function so as to treat conditions and diseases such as sarcopenia and muscular dystrophy. Recently, our research group has generated evidence regarding the capacity of (−)-EPI to preserve or stimulate SkM structure and/or function using either (−)-EPI-enriched dark chocolate/cocoa or pure (−)-EPI in either animals (Gutierrez-Salmean et al., 2014; Moreno-Ulloa et al., 2015b; Nogueira et al., 2011; Ramirez-Sanchez et al., 2014) or humans (McDonald, 2017; Ramirez-Sanchez et al., 2013; Taub et al., 2012; Taub et al., 2016) including heart failure and type 2 diabetes patients. The modulatory effects of (−)-EPI on SkM structure and function are associated to its unique capacity to stimulate MiB (Nogueira et al., 2011). Although the exact mechanism linked to (−)-EPI effects on MiB is not fully understood, there is indirect evidence for a possible role mediated by GPER (Moreno-Ulloa et al., 2015a). GPER activation by selective ligands has been shown to trigger MiB in vitro and in vivo (Sbert-Roig et al., 2016) and can enhance SkM function in vivo (Wang et al., 2016). Results generated in this study suggest that: (i) (−)-EPI, at physiologically relevant concentrations, increases the length and width of C2C12 myotubes; (ii) (−)-EPI stimulates MiB as per increases in endpoints linked to mitochondrial structure and biogenesis; (iii) GPER is involved in the stimulation of MiB and myotube growth by (−)-EPI treatment and; (iv) (−)-EPI induces a higher response than G-1 in stimulating MiB and myotube growth when both ligands are compared at concentrations eliciting their individual maximal attainable effect.
(−)-EPI is a small molecule with a molecular weight below the 300 g/mol units, that has been shown to elicit a variety of beneficial effects on different organs/tissues from animals and humans, including but not limited to the heart (Ramirez-Sanchez et al., 2012), brain (Moreno-Ulloa et al., 2015b), kidney (Tanabe et al., 2012), endothelium (Schroeter et al., 2006), SkM (Nogueira et al., 2011) and others. The mechanisms by which (−)-EPI exerts its beneficial effects on such tissues/organs are not fully understood. We previously documented that GPER partiality mediates (−)-EPI vasodilatory effects in accordance with data derived from in vitro and ex vivo studies (Moreno-Ulloa et al., 2015a). GPER is a transmembrane receptor that binds its physiological ligand 17β-estradiol (agonist) (Revankar et al., 2005) and synthetic ones including G-1 (agonist) (Bologa et al., 2006) and G-36 (antagonist) (Dennis et al., 2011). In SkM, GPER activation has been shown to improve exercise capacity and SkM strength (Wang et al., 2016). Thus, based on evidence suggesting increases on MiB in SkM cells by either (−)-EPI treatment or GPER activation as well as on our endothelial cell data, we hypothesized that GPER is (at least in part) involved in mediating the effects of (−)-EPI on MiB in muscle cells. In order to test our hypothesis, we employed a well-characterized in vitro model of SkM cells, C2C12 myotubes (Burattini et al., 2004). In agreement with Ronda et al., we confirmed the presence of GPER in C2C12 myotube cytoplasm (Ronda and Boland, 2016) in addition to the cell membrane, being more abundantly present in cytoplasm. Noteworthy, Cheng et al., using HEK-293 cells stably expressing hemagglutinin-tagged GPER (i.e. via forced expression) demonstrated that this receptor traffics from the cell membrane to the trans-Golgi network and that its residence in the cell membrane is relative short (t1/2 <1 h) (Cheng et al., 2011). Whereas we did not assess for receptor trafficking in C2C12 myotubes it is possible that a similar trafficking process is occurring, thereby explaining the relative lower receptor abundance in the cell membrane vs. cytoplasm in C2C12 myotubes. In addition to these sites, Ronda et al., using C2C12 myotubes, demonstrated that GPER is localized in mitochondria, which may suggest possible roles for GPER in modulating mitochondrial function. Although GPER has been documented in several cellular compartments, its precise functional location(s) remains to be solved.
Based on studies demonstrating aging-associated declines on SkM function and mitochondrial abundance and replication (Carter et al., 2015), as well as on studies showing improvements on SkM function by stimulation of MiB with exercise or pharmacological agents (Hepple, 2014), it appears that SkM health is intrinsically linked to mitochondrial abundance and/or replication. In this study, we document the ability of (−)-EPI to stimulate MiB. Our results evidence increases in markers of mitochondrial mass/structure (porin and MitoTracker Red FM fluorescence levels) that were accompanied by increases in transcription factors linked to organelle replication including NRF-2 (nuDNA-encoded protein), which regulates the expression of multiple nuclear genes encoding mitochondrial proteins from the oxidative phosphorylation system (OXPHOS) as well as other proteins (Bruni et al., 2010). (−)-EPI treatment also increased TFAM protein levels, a downstream transcription factor for NRF-2, implicated in mtDNA maintenance and replication (Picca and Lezza, 2015). In accordance with these observed in vitro increases on transcription factors, we previously reported on the in vivo capacity of (−)-EPI to stimulate MiB via the activation of TFAM which was associated with enhanced fatigue resistance and oxidative capacity in 1 year old male mice orally treated with (−)-EPI (Nogueira et al., 2011). Similarly, using a senile mouse model (26-month-old), we reported on reduced proteins levels for MiB mediators including NRF-2, TFAM and porin in SkM from these animals vs. 6-month-old cohorts. In this study, we demonstrated that (−)-EPI treatment attenuated such decrements (Moreno-Ulloa et al., 2015b). Hence, our in vitro data correlates with data generated using young and senile mouse models.
Furthermore, the stimulatory effects of (−)-EPI noted in C2C12 CS activity are also in accordance with our previous published in vivo results (Nogueira et al., 2011). Altogether, our data strongly suggest myotube stimulation of MiB by using physiological concentrations of (−)-EPI.
Given the high-energy demand that SkM can attain, a relatively higher density of mitochondria (~3–8% volume occupied per cell) is evident vs. other cell types (Park et al., 2014). In consequence, an increase in mitochondrial density in SkM cells may require a concomitant increase in cell size. Here, we report on the stimulatory effect of (−)-EPI on myotube size as per increases in cell length and width, which may support the notion that an increase in mitochondrial content is accompanied by a concomitant increase in cell size. Indeed, Posakony et al., demonstrated that the mitochondrial content of HeLa cells changes in proportion to cell size throughout its cell cycle (i.e., a constant mitochondrial volume/cytoplasmic volume ratio is maintained) (Posakony et al., 1977). Kitami et al., also reported on proportional changes (increase or decrease) between mitochondrial content and cell size in human umbilical vein endothelial cells treated with various small molecules, thereby suggesting a mechanism that tightly controls the relationship between cell size and mitochondrial density (Kitami et al., 2012). Recently, Lee et al. reported that treatment of C2C12 myoblasts with (−)-EPI promoted early myoblast differentiation and also stimulated myotube growth (as per increases in myotubes diameter), although authors did not evaluate changes in mitochondria content (Lee et al., 2017). Thus, results are in agreement with our data evidencing increases in myotube size with (−)-EPI treatment.
Results from this study also show that co-treatment with the GPER antagonist G-36 partially attenuated the effects of (−)-EPI on the majority of MiB endpoints evaluated. Likewise, siRNA knockdown of GPER also partially blocked the increases in mitochondrial abundance (in accordance with MitoTracker Red analysis) by (−)-EPI treatment.
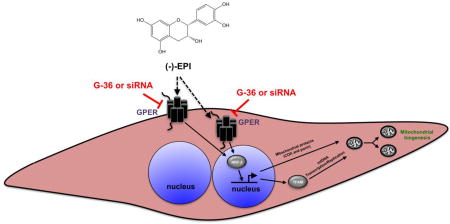
Noteworthy, we previously reported that GPER also partially mediates the production of nitric oxide (an inducer of MiB (Nisoli and Carruba, 2006)) via eNOS activation by (−)-EPI in endothelial cells and isolated aortic rings (Moreno-Ulloa et al., 2015a). The partial blockade of effects on endothelial cells and myotubes suggests that receptor entities other than GPER may be involved in mediating the mitochondrial effects of (−)-EPI (Fig. 9). Currently there is no evidence to indicate that (−)-EPI can bind to classical estrogen receptors (i.e., α and β) as noted for 17β-estradiol (Breinholt and Larsen, 1998). Nonetheless, there is in vivo evidence that indicates that other G-protein coupled receptors, such as the δ-opioid receptor may mediate the effects of (−)-EPI on isolated cardiac mitochondria respiration (Panneerselvam et al., 2013). Thus, other receptors likely participate in mediating (−)-EPI mitochondrial effects and await further characterization.
Figure 9. Proposed mechanism of (−)-epicatechin ((−)-EPI) induced stimulation of mitochondrial biogenesis in C2C12 myotubes.
GPER, G-protein coupled estrogen receptor; mtDNA, mitochondrial DNA; siRNA, small interfering RNA; TFAM, mitochondrial transcription factor A; NRF-2, nuclear respiratory factor-2; G-36, GPER antagonist. The black arrow with dashed line suggests the presence of another type of receptor activated by (−)-EPI.
Our data also suggest an involvement of GPER in mediating the stimulatory effects of (−)-EPI on myotube growth (Fig. 9). Interestingly, Wu et al., demonstrated that the extracellular signal-regulated kinase (ERK) 1/2 is involved in the hypertrophic growth of C2C12 myotubes (Wu et al., 2000). Even though we did not evaluate the role of GPER-ERK 1/2 axis in mediating the effects of (−)-EPI on myotube growth, it is highly plausible that ERK 1/2 is involved in such process. In support to this hypothesis, we have shown previously that (−)-EPI is capable of triggering ERK 1/2 activation in endothelial cells and that the use of either G-15 (GPER antagonist) or siRNA against GPER totally blocked ERK 1/2 activation (Moreno-Ulloa et al., 2015a).
The role of GPER in mediating SkM cell structure and function is poorly understood as there are few reports addressing this issue. Sbert-Roig et al., using rat H9c2 cardiomyocytes differentiated into myotubes showed that 1µM G-1 treatment for 24 h (without signs of cell toxicity as per crystal violet nuclear staining assay) increased COX-I and PGC-1α gene expression and PGC-1α and COX-IV protein levels, although the authors did not use a GPER antagonist (in G1-treated myotubes) to corroborate the role of GPER in mediating such effects (Sbert-Roig et al., 2016).
Contrary to Sbert et al., we observed trends towards increases on MiB endpoints (except for MitoTracker Red staining which was significant) as well as on myotube growth endpoints in cells treated with 0.1 µM G-1 (a concentration that did not reduce cell viability) and, as expected, such effects were blocked by G-36. The reduced maximal attainable effect of G-1 when compared to (−)-EPI in stimulating both MiB and myotube growth further supports the notion that both processes are related as suggested by Posakony et al., and Kitami et al (Kitami et al., 2012; Posakony et al., 1977). Our data also suggest that (−)-EPI, partially acting through GPER, induces a higher response in stimulating MiB vs. G-1 when both ligands are compared at their maximal attainable response. This may imply that the activation of receptors other than GPER by (−)-EPI is required to achieve a full effect of the flavanol on MiB stimulation.
Altogether, using selective GPER ligands and gene silencing approaches we evidenced the involvement of GPER in mediating the effects of (−)-EPI on mitochondrial biogenesis and myotube growth in skeletal muscle cells. These results are of high relevance as they provide evidence as to how the flavanol favorably impacts SkM function (i.e. increases in fatigue resistance and oxidative capacity). Nonetheless, our in vitro results require further in vivo validation in order to support the participation of GPER in mediating the effects of (−)-EPI on SkM mitochondria.
Supplementary Material
Acknowledgments
This work was supported by NIH grant DK 98717 to F. Villarreal and by an internal project to C. Álvarez-Delgado (CICESE #685-106). Adriana Miranda-Cervantes has a scholarship from CONACyT (CVU 689499). We thank Angel Flores (Carl ZEISS México) for his technical assistance provided with the Confocal LSM 800 equipment. We also thank Diego Delgado-Álvarez (Unidad de Microscopía Avanzada del CICESE [UMAC]) and Germán Bazaldúa (Soluciones Tecnobiomedica S. de RL de CV) for the valuable advanced microscopy course given.
Dr. Villarreal is a co-founder and stockholder of Cardero Therapeutics Inc.
Footnotes
Publisher's Disclaimer: This is a PDF file of an unedited manuscript that has been accepted for publication. As a service to our customers we are providing this early version of the manuscript. The manuscript will undergo copyediting, typesetting, and review of the resulting proof before it is published in its final citable form. Please note that during the production process errors may be discovered which could affect the content, and all legal disclaimers that apply to the journal pertain.
Conflict of interest
The authors declare no conflict of interest.
References
- Bajaj P, Reddy B, Jr, Millet L, Wei C, Zorlutuna P, Bao G, Bashir R. Patterning the differentiation of C2C12 skeletal myoblasts. Integr Biol (Camb) 2011;3:897–909. doi: 10.1039/c1ib00058f. [DOI] [PubMed] [Google Scholar]
- Barnett CF, Moreno-Ulloa A, Shiva S, Ramirez-Sanchez I, Taub PR, Su Y, Ceballos G, Dugar S, Schreiner G, Villarreal F. Pharmacokinetic, partial pharmacodynamic and initial safety analysis of (−)-epicatechin in healthy volunteers. Food Funct. 2015;6:824–833. doi: 10.1039/c4fo00596a. [DOI] [PMC free article] [PubMed] [Google Scholar]
- Bettadapur A, Suh GC, Geisse NA, Wang ER, Hua C, Huber HA, Viscio AA, Kim JY, Strickland JB, McCain ML. Prolonged Culture of Aligned Skeletal Myotubes on Micromolded Gelatin Hydrogels. Sci Rep. 2016;6:28855. doi: 10.1038/srep28855. [DOI] [PMC free article] [PubMed] [Google Scholar]
- Bhagwat S, Haytowitz DB, Holden JM. In: Database for the Flavonoid Content of Selected Foods, Release 3.1. U.S. Department of Agriculture, A.R.S, editor. 2014. (Ret.) [Google Scholar]
- Bologa CG, Revankar CM, Young SM, Edwards BS, Arterburn JB, Kiselyov AS, Parker MA, Tkachenko SE, Savchuck NP, Sklar LA, Oprea TI, Prossnitz ER. Virtual and biomolecular screening converge on a selective agonist for GPR30. Nat Chem Biol. 2006;2:207–212. doi: 10.1038/nchembio775. [DOI] [PubMed] [Google Scholar]
- Breinholt V, Larsen JC. Detection of weak estrogenic flavonoids using a recombinant yeast strain and a modified MCF7 cell proliferation assay. Chem Res Toxicol. 1998;11:622–629. doi: 10.1021/tx970170y. [DOI] [PubMed] [Google Scholar]
- Bruni F, Polosa PL, Gadaleta MN, Cantatore P, Roberti M. Nuclear respiratory factor 2 induces the expression of many but not all human proteins acting in mitochondrial DNA transcription and replication. J Biol Chem. 2010;285:3939–3948. doi: 10.1074/jbc.M109.044305. [DOI] [PMC free article] [PubMed] [Google Scholar]
- Burattini S, Ferri P, Battistelli M, Curci R, Luchetti F, Falcieri E. C2C12 murine myoblasts as a model of skeletal muscle development: morpho-functional characterization. Eur J Histochem. 2004;48:223–233. [PubMed] [Google Scholar]
- Carter HN, Chen CC, Hood DA. Mitochondria, muscle health, and exercise with advancing age. Physiology (Bethesda) 2015;30:208–223. doi: 10.1152/physiol.00039.2014. [DOI] [PubMed] [Google Scholar]
- Chen YA, Hsu KY. Pharmacokinetics of (−)-epicatechin in rabbits. Arch Pharm Res. 2009;32:149–154. doi: 10.1007/s12272-009-1129-x. [DOI] [PubMed] [Google Scholar]
- Cheng SB, Quinn JA, Graeber CT, Filardo EJ. Down-modulation of the G-protein-coupled estrogen receptor, GPER, from the cell surface occurs via a trans-Golgi-proteasome pathway. J Biol Chem. 2011;286:22441–22455. doi: 10.1074/jbc.M111.224071. [DOI] [PMC free article] [PubMed] [Google Scholar]
- Craig DM, Ashcroft SP, Belew MY, Stocks B, Currell K, Baar K, Philp A. Utilizing small nutrient compounds as enhancers of exercise-induced mitochondrial biogenesis. Front Physiol. 2015;6:296. doi: 10.3389/fphys.2015.00296. [DOI] [PMC free article] [PubMed] [Google Scholar]
- Dennis MK, Field AS, Burai R, Ramesh C, Petrie WK, Bologa CG, Oprea TI, Yamaguchi Y, Hayashi S, Sklar LA, Hathaway HJ, Arterburn JB, Prossnitz ER. Identification of a GPER/GPR30 antagonist with improved estrogen receptor counterselectivity. J Steroid Biochem Mol Biol. 2011;127:358–366. doi: 10.1016/j.jsbmb.2011.07.002. [DOI] [PMC free article] [PubMed] [Google Scholar]
- Gutierrez-Salmean G, Ciaraldi TP, Nogueira L, Barboza J, Taub PR, Hogan MC, Henry RR, Meaney E, Villarreal F, Ceballos G, Ramirez-Sanchez I. Effects of (−)-epicatechin on molecular modulators of skeletal muscle growth and differentiation. J Nutr Biochem. 2014;25:91–94. doi: 10.1016/j.jnutbio.2013.09.007. [DOI] [PMC free article] [PubMed] [Google Scholar]
- Handschin C. Caloric restriction and exercise “mimetics”: Ready for prime time? Pharmacol Res. 2016;103:158–166. doi: 10.1016/j.phrs.2015.11.009. [DOI] [PMC free article] [PubMed] [Google Scholar]
- Hepple RT. Mitochondrial involvement and impact in aging skeletal muscle. Front Aging Neurosci. 2014;6:211. doi: 10.3389/fnagi.2014.00211. [DOI] [PMC free article] [PubMed] [Google Scholar]
- Kitami T, Logan DJ, Negri J, Hasaka T, Tolliday NJ, Carpenter AE, Spiegelman BM, Mootha VK. A chemical screen probing the relationship between mitochondrial content and cell size. PLoS One. 2012;7:e33755. doi: 10.1371/journal.pone.0033755. [DOI] [PMC free article] [PubMed] [Google Scholar]
- Krimmer T, Rapaport D, Ryan MT, Meisinger C, Kassenbrock CK, Blachly-Dyson E, Forte M, Douglas MG, Neupert W, Nargang FE, Pfanner N. Biogenesis of porin of the outer mitochondrial membrane involves an import pathway via receptors and the general import pore of the TOM complex. J Cell Biol. 2001;152:289–300. doi: 10.1083/jcb.152.2.289. [DOI] [PMC free article] [PubMed] [Google Scholar]
- Larsen S, Nielsen J, Hansen CN, Nielsen LB, Wibrand F, Stride N, Schroder HD, Boushel R, Helge JW, Dela F, Hey-Mogensen M. Biomarkers of mitochondrial content in skeletal muscle of healthy young human subjects. The Journal of physiology. 2012;590:3349–3360. doi: 10.1113/jphysiol.2012.230185. [DOI] [PMC free article] [PubMed] [Google Scholar]
- Lee SJ, Leem YE, Go GY, Choi Y, Song YJ, Kim I, Kim DY, Kim YK, Seo DW, Kang JS, Bae GU. Epicatechin elicits MyoD-dependent myoblast differentiation and myogenic conversion of fibroblasts. PLoS One. 2017;12:e0175271. doi: 10.1371/journal.pone.0175271. [DOI] [PMC free article] [PubMed] [Google Scholar]
- McDonald C, Henricson E, Oskarsson B, Aguilar C, Nicorici A, Joyce N, Reddy D, Wagner A, DeBie E, Goude E, Abresch R, Villareal F, Perkins G, Hathout Y, Dugar S, Schreiner G. Epicatechin enhances mitochondrial biogenesis, increases dystrophin and utrophin, increases follistatin while decreasing myostatin, and improves skeletal muscle exercise response in adults with Becker muscular dystrophy (BMD) Neuromuscular Disorders. 2017;25:S314–S315. [Google Scholar]
- Meyer MR, Fredette NC, Howard TA, Hu C, Ramesh C, Daniel C, Amann K, Arterburn JB, Barton M, Prossnitz ER. G protein-coupled estrogen receptor protects from atherosclerosis. Sci Rep. 2014;4:7564. doi: 10.1038/srep07564. [DOI] [PMC free article] [PubMed] [Google Scholar]
- Monahan KD, Feehan RP, Kunselman AR, Preston AG, Miller DL, Lott ME. Dose-dependent increases in flow-mediated dilation following acute cocoa ingestion in healthy older adults. J Appl Physiol (1985) 2011;111:1568–1574. doi: 10.1152/japplphysiol.00865.2011. [DOI] [PMC free article] [PubMed] [Google Scholar]
- Moreno-Ulloa A, Cid A, Rubio-Gayosso I, Ceballos G, Villarreal F, Ramirez-Sanchez I. Effects of (−)-epicatechin and derivatives on nitric oxide mediated induction of mitochondrial proteins. Bioorg Med Chem Lett. 2013;23:4441–4446. doi: 10.1016/j.bmcl.2013.05.079. [DOI] [PMC free article] [PubMed] [Google Scholar]
- Moreno-Ulloa A, Mendez-Luna D, Beltran-Partida E, Castillo C, Guevara G, Ramirez-Sanchez I, Correa-Basurto J, Ceballos G, Villarreal F. The effects of (−)-epicatechin on endothelial cells involve the G protein-coupled estrogen receptor (GPER) Pharmacol Res. 2015a;100:309–320. doi: 10.1016/j.phrs.2015.08.014. [DOI] [PMC free article] [PubMed] [Google Scholar]
- Moreno-Ulloa A, Nogueira L, Rodriguez A, Barboza J, Hogan MC, Ceballos G, Villarreal F, Ramirez-Sanchez I. Recovery of Indicators of Mitochondrial Biogenesis, Oxidative Stress, and Aging With (−)-Epicatechin in Senile Mice. J Gerontol A Biol Sci Med Sci. 2015b;70:1370–1378. doi: 10.1093/gerona/glu131. [DOI] [PMC free article] [PubMed] [Google Scholar]
- Moreno-Ulloa A, Romero-Perez D, Villarreal F, Ceballos G, Ramirez-Sanchez I. Cell membrane mediated (−)-epicatechin effects on upstream endothelial cell signaling: evidence for a surface receptor. Bioorg Med Chem Lett. 2014;24:2749–2752. doi: 10.1016/j.bmcl.2014.04.038. [DOI] [PMC free article] [PubMed] [Google Scholar]
- Nisoli E, Carruba MO. Nitric oxide and mitochondrial biogenesis. J Cell Sci. 2006;119:2855–2862. doi: 10.1242/jcs.03062. [DOI] [PubMed] [Google Scholar]
- Nogueira L, Ramirez-Sanchez I, Perkins GA, Murphy A, Taub PR, Ceballos G, Villarreal FJ, Hogan MC, Malek MH. (−)-Epicatechin enhances fatigue resistance and oxidative capacity in mouse muscle. The Journal of physiology. 2011;589:4615–4631. doi: 10.1113/jphysiol.2011.209924. [DOI] [PMC free article] [PubMed] [Google Scholar]
- Panneerselvam M, Ali SS, Finley JC, Kellerhals SE, Migita MY, Head BP, Patel PM, Roth DM, Patel HH. Epicatechin regulation of mitochondrial structure and function is opioid receptor dependent. Mol Nutr Food Res. 2013;57:1007–1014. doi: 10.1002/mnfr.201300026. [DOI] [PMC free article] [PubMed] [Google Scholar]
- Papadimitriou A, Peixoto EB, Silva KC, Lopes de Faria JM, Lopes de Faria JB. Increase in AMPK brought about by cocoa is renoprotective in experimental diabetes mellitus by reducing NOX4/TGFbeta-1 signaling. J Nutr Biochem. 2014;25:773–784. doi: 10.1016/j.jnutbio.2014.03.010. [DOI] [PubMed] [Google Scholar]
- Park SY, Gifford JR, Andtbacka RH, Trinity JD, Hyngstrom JR, Garten RS, Diakos NA, Ives SJ, Dela F, Larsen S, Drakos S, Richardson RS. Cardiac, skeletal, and smooth muscle mitochondrial respiration: are all mitochondria created equal? Am J Physiol Heart Circ Physiol. 2014;307:H346–352. doi: 10.1152/ajpheart.00227.2014. [DOI] [PMC free article] [PubMed] [Google Scholar]
- Picca A, Lezza AM. Regulation of mitochondrial biogenesis through TFAM-mitochondrial DNA interactions: Useful insights from aging and calorie restriction studies. Mitochondrion. 2015;25:67–75. doi: 10.1016/j.mito.2015.10.001. [DOI] [PubMed] [Google Scholar]
- Piskula MK, Terao J. Accumulation of (−)-epicatechin metabolites in rat plasma after oral administration and distribution of conjugation enzymes in rat tissues. J Nutr. 1998;128:1172–1178. doi: 10.1093/jn/128.7.1172. [DOI] [PubMed] [Google Scholar]
- Posakony JW, England JM, Attardi G. Mitochondrial growth and division during the cell cycle in HeLa cells. J Cell Biol. 1977;74:468–491. doi: 10.1083/jcb.74.2.468. [DOI] [PMC free article] [PubMed] [Google Scholar]
- Presley AD, Fuller KM, Arriaga EA. MitoTracker Green labeling of mitochondrial proteins and their subsequent analysis by capillary electrophoresis with laser-induced fluorescence detection. J Chromatogr B Analyt Technol Biomed Life Sci. 2003;793:141–150. doi: 10.1016/s1570-0232(03)00371-4. [DOI] [PubMed] [Google Scholar]
- Prossnitz ER, Barton M. The G-protein-coupled estrogen receptor GPER in health and disease. Nat Rev Endocrinol. 2011;7:715–726. doi: 10.1038/nrendo.2011.122. [DOI] [PMC free article] [PubMed] [Google Scholar]
- Ramirez-Sanchez I, De los Santos S, Gonzalez-Basurto S, Canto P, Mendoza-Lorenzo P, Palma-Flores C, Ceballos-Reyes G, Villarreal F, Zentella-Dehesa A, Coral-Vazquez R. (−)-Epicatechin improves mitochondrial-related protein levels and ameliorates oxidative stress in dystrophic delta-sarcoglycan null mouse striated muscle. FEBS J. 2014;281:5567–5580. doi: 10.1111/febs.13098. [DOI] [PMC free article] [PubMed] [Google Scholar]
- Ramirez-Sanchez I, Maya L, Ceballos G, Villarreal F. (−)-epicatechin activation of endothelial cell endothelial nitric oxide synthase, nitric oxide, and related signaling pathways. Hypertension. 2010;55:1398–1405. doi: 10.1161/HYPERTENSIONAHA.109.147892. [DOI] [PMC free article] [PubMed] [Google Scholar]
- Ramirez-Sanchez I, Nogueira L, Moreno A, Murphy A, Taub P, Perkins G, Ceballos GM, Hogan M, Malek M, Villarreal F. Stimulatory effects of the flavanol (−)-epicatechin on cardiac angiogenesis: additive effects with exercise. J Cardiovasc Pharmacol. 2012;60:429–438. doi: 10.1097/FJC.0b013e318269ae0d. [DOI] [PMC free article] [PubMed] [Google Scholar]
- Ramirez-Sanchez I, Taub PR, Ciaraldi TP, Nogueira L, Coe T, Perkins G, Hogan M, Maisel AS, Henry RR, Ceballos G, Villarreal F. (−)-Epicatechin rich cocoa mediated modulation of oxidative stress regulators in skeletal muscle of heart failure and type 2 diabetes patients. Int J Cardiol. 2013;168:3982–3990. doi: 10.1016/j.ijcard.2013.06.089. [DOI] [PMC free article] [PubMed] [Google Scholar]
- Revankar CM, Cimino DF, Sklar LA, Arterburn JB, Prossnitz ER. A transmembrane intracellular estrogen receptor mediates rapid cell signaling. Science. 2005;307:1625–1630. doi: 10.1126/science.1106943. [DOI] [PubMed] [Google Scholar]
- Ronda AC, Boland RL. Intracellular Distribution and Involvement of GPR30 in the Actions of E2 on C2C12 Cells. J Cell Biochem. 2016;117:793–805. doi: 10.1002/jcb.25369. [DOI] [PubMed] [Google Scholar]
- Sbert-Roig M, Bauza-Thorbrugge M, Galmes-Pascual BM, Capllonch-Amer G, Garcia-Palmer FJ, Llado I, Proenza AM, Gianotti M. GPER mediates the effects of 17beta-estradiol in cardiac mitochondrial biogenesis and function. Mol Cell Endocrinol. 2016;420:116–124. doi: 10.1016/j.mce.2015.11.027. [DOI] [PubMed] [Google Scholar]
- Scarpulla RC. Transcriptional paradigms in mammalian mitochondrial biogenesis and function. Physiol Rev. 2008;88:611–638. doi: 10.1152/physrev.00025.2007. [DOI] [PubMed] [Google Scholar]
- Schroeter H, Heiss C, Balzer J, Kleinbongard P, Keen CL, Hollenberg NK, Sies H, Kwik-Uribe C, Schmitz HH, Kelm M. (−)-Epicatechin mediates beneficial effects of flavanol-rich cocoa on vascular function in humans. Proc Natl Acad Sci U S A. 2006;103:1024–1029. doi: 10.1073/pnas.0510168103. [DOI] [PMC free article] [PubMed] [Google Scholar]
- Si H, Fu Z, Babu PV, Zhen W, Leroith T, Meaney MP, Voelker KA, Jia Z, Grange RW, Liu D. Dietary epicatechin promotes survival of obese diabetic mice and Drosophila melanogaster. J Nutr. 2011;141:1095–1100. doi: 10.3945/jn.110.134270. [DOI] [PMC free article] [PubMed] [Google Scholar]
- Tanabe K, Tamura Y, Lanaspa MA, Miyazaki M, Suzuki N, Sato W, Maeshima Y, Schreiner GF, Villarreal FJ, Johnson RJ, Nakagawa T. Epicatechin limits renal injury by mitochondrial protection in cisplatin nephropathy. Am J Physiol Renal Physiol. 2012;303:F1264–1274. doi: 10.1152/ajprenal.00227.2012. [DOI] [PMC free article] [PubMed] [Google Scholar]
- Taub PR, Ramirez-Sanchez I, Ciaraldi TP, Perkins G, Murphy AN, Naviaux R, Hogan M, Maisel AS, Henry RR, Ceballos G, Villarreal F. Alterations in skeletal muscle indicators of mitochondrial structure and biogenesis in patients with type 2 diabetes and heart failure: effects of epicatechin rich cocoa. Clinical and translational science. 2012;5:43–47. doi: 10.1111/j.1752-8062.2011.00357.x. [DOI] [PMC free article] [PubMed] [Google Scholar]
- Taub PR, Ramirez-Sanchez I, Patel M, Higginbotham E, Moreno-Ulloa A, Roman-Pintos LM, Phillips P, Perkins G, Ceballos G, Villarreal F. Beneficial effects of dark chocolate on exercise capacity in sedentary subjects: underlying mechanisms. A double blind, randomized, placebo controlled trial. Food Funct. 2016;7:3686–3693. doi: 10.1039/c6fo00611f. [DOI] [PMC free article] [PubMed] [Google Scholar]
- Virbasius JV, Scarpulla RC. Activation of the human mitochondrial transcription factor A gene by nuclear respiratory factors: a potential regulatory link between nuclear and mitochondrial gene expression in organelle biogenesis. Proc Natl Acad Sci U S A. 1994;91:1309–1313. doi: 10.1073/pnas.91.4.1309. [DOI] [PMC free article] [PubMed] [Google Scholar]
- Wang H, Alencar A, Lin M, Sun X, Sudo RT, Zapata-Sudo G, Lowe DA, Groban L. Activation of GPR30 improves exercise capacity and skeletal muscle strength in senescent female Fischer344 × Brown Norway rats. Biochem Biophys Res Commun. 2016;475:81–86. doi: 10.1016/j.bbrc.2016.05.040. [DOI] [PMC free article] [PubMed] [Google Scholar]
- Wu Z, Woodring PJ, Bhakta KS, Tamura K, Wen F, Feramisco JR, Karin M, Wang JY, Puri PL. p38 and extracellular signal-regulated kinases regulate the myogenic program at multiple steps. Mol Cell Biol. 2000;20:3951–3964. doi: 10.1128/mcb.20.11.3951-3964.2000. [DOI] [PMC free article] [PubMed] [Google Scholar]
- Yamamoto DL, Csikasz RI, Li Y, Sharma G, Hjort K, Karlsson R, Bengtsson T. Myotube formation on micro-patterned glass: intracellular organization and protein distribution in C2C12 skeletal muscle cells. J Histochem Cytochem. 2008;56:881–892. doi: 10.1369/jhc.2008.951228. [DOI] [PMC free article] [PubMed] [Google Scholar]
Associated Data
This section collects any data citations, data availability statements, or supplementary materials included in this article.


