Abstract
Background
Fluid management remains a major challenge of hemodialysis (HD) care, with serious implications for morbidity and mortality. Intradialytic fluid management is typically guided by blood pressure, an indirect resultant of hemodynamics status. Direct measurements of hemodynamic parameters may improve cardiovascular outcomes by providing rational bases for intervention. We compare stroke volume (SV) measurements using a non-invasive, regional biompedance cardiography device (NiCaS) with Doppler echocardiography (Echo) in HD setting.
Methods
Stroke volumes were simultaneously measured using the devices in 17 patients receiving maintenance HD. Measurements were made during two weekly HD treatments, and twice within each HD treatment during the first and last hour of each treatment, for a total of 64 SV measurements. Agreement between devices was assessed using linear regression, a Pearson’s correlation coefficient, and a Bland Altman plot all adjusted for repeated measures within patients.
Results
Echo and NiCaS SV mean and 95% CIs were 58.0 (50.1, 65.8) and 56.7 (49.4, 64.0) ml, respectively. NiCaS SV correlated strongly with Echo SV during the first and last hours of treatments (r = 0.93, p<0.001 and r = 0.92, p<0.001, respectively). Linear regression of NiCaS on Echo showed a slope of 0.97, 95% CI (0.91, 1.02) which did not differ from 1, p = 0.20. A Bland-Altman plot and 4-Quadrant plot confirmed that the two methods produced comparable measurements.
Conclusion
NiCaS SV measurements are similar to and strongly correlated with Echo SV measurements. This suggests that noninvasive NiCaS technology may be a practical method for measuring SV during HD.
Keywords: Stroke Volume, Echocardiography, Bioimpedance Cardiography, Hemodialysis
INTRODUCTION
Despite significant technological advances in hemodialysis (HD), morbidity and mortality rates are high in end-stage kidney disease (ESKD) patients undergoing maintenance HD treatments [1]. Depending on the definition used, intradialytic hypotension (IDH) occurs in 15% to 50% of HD sessions, most often in relation to the ultrafiltration (UF) rate [2]. IDH is also associated with increased cardiovascular and neurological morbidity and mortality [3–5]. Specifically, ultrafiltration rates of > 13ml/h/kg are significantly associated with increased all-cause and cardiovascular-related mortality with adjusted hazard ratios of 1.59 and 1.71, respectively [6]. Equally important, though often under-appreciated, is that repeated IDH events can result in nausea, muscle cramps, fainting, and anxiety; while long-term effects of IDH can result in dyspnea, fatigue, cognitive impairment, and exercise intolerance – all negatively affecting quality of life [7]. Recent studies demonstrate that cardiac injury and myocardial “stunning” occur repeatedly during dialysis [7]. Thus, the incidence of IDH events is still high despite major technical advances in HD technology. Consequently, fluid management must become a central concern of HD treatments [8, 9], particularly as the population ages.
The single, most important measurement available to clinicians for guiding fluid management is blood pressure (BP) which is determined by cardiovascular hemodynamics. In patients with healthy kidneys, autonomous and cardiovascular changes occur in order to maintain the BP necessary for adequate organ perfusion in the face of varying blood volumes. However, because several intrinsic control mechanisms tightly regulate BP in response to ultrafiltration-induced blood volume reduction, periodic blood pressure measurements during HD are of little use in predicting IDH. Peripheral vascular and cardiac abnormalities in chronic HD patients are common [7], leading to chronic interdialytic high BP mostly due to hypervolemia and intradialytic hypotension due to hypovolemia. Therefore, routine monitoring during HD treatments that include blood volume monitoring in addition to BP and/or other hemodynamic parameters may improve these poor outcomes [10, 11]. An upper limit of UF rate has been recommended as a Medicare required quality metric since high UF rates are associated with poor outcomes. There are no prospective studies that support this recommendation and likely the epidemiological association is more complicated, and, in addition, individual patient factors need to be taken into account.
Sensors integrated in dialysis machines are able to track the concentration of various blood components, such as hematocrit, with high accuracy and resolution and to derive relative blood volume (RBV) changes [12–17]. However, RBV is an incomplete measure of absolute blood volume (ABV) status. Its clinical value remains controversial and studies have not definitely shown that measuring RBV leads to improved treatment outcomes [18]. The reference technique (the “gold standard”) for ABV measurement is based on radioactive tracer dilution for the two major components of blood (the red blood cells and the plasma). Unfortunately, this technique is invasive, costly, and impractical in routine outpatient dialysis care [19].
Hemodynamic parameters, such as stroke volume (SV) and cardiac output (CO), are an essential component of fluid management in cardiac and intensive critical unit settings. Measurement techniques can be broadly classified as [20]: invasive: pulmonary artery thermodilution, minimally invasive: pulse power or contour analysis, ultrasound dilution, partial gas rebreathing, transesophgeal echocardiography, and non-invasive: photoelectric plethysmography, thoracic bioimpedance, Doppler-based, endotracheal cardiac output monitor, and bioimpedance cardiography. The invasive Swan-Ganz pulmonary artery catheterization (PAC) thermodilution technique is considered the gold standard despite controversies [20].
Consequently, a critical need exists for a non-invasive, inexpensive, reliable, and practical technique for measuring hemodynamic parameters in HD. One such technique is bioimpedance cardiography [21] which was applied in HD as early as 1977 [22]. A regional bioimpedance cardiography device (NiCaS, NI Medical, Israel) has been validated in cardiac care against PAC [21, 23, 24] and Doppler echocardiography [25], and shown to have better accuracy and precision compared with thoracic bioimpedance [21] and modified-Fick [23] techniques. Recent hemodynamic studies in HD settings include baroreceptor sensitivity using Finometer (Finapres Medical Systems) [26], cardiomyopathy using cardiac and aortic MRI [27], and ischemic brain injury using molecular MRI [28]. The aim of this study was to compare NiCaS against the noninvasive and widely available Echocardiography [29] technique in the HD setting.
STUDY DESIGN & METHODS
Patients
Seventeen (17) patients were enrolled in January 2017 at a single outpatient HD facility in the northeast United States. In each patient, we performed simultaneous SV measurements using NiCaS and Echo during two different HD treatments in one week. Simultaneous NiCaS and Echo measurements were taken during the first hour of the HD session and then repeated during the last hour, within each HD treatment. All Echo-SV and NiCaS-SV readings were independently carried out by two technicians who were double blinded to each other. Inclusion criteria included ESKD patients (age ≥ 18) undergoing chronic maintenance HD. Exclusion criteria included severe aortic valve regurgitation and/or aortic stenosis, aortic aneurysm, severe arrhythmia and heart rate > 130 beats/min. The Schulman Institutional Review Board, Cincinnati, OH (IRB #201606285), approved the study. All patients gave written informed consent before enrollment.
Echocardiography Measurements
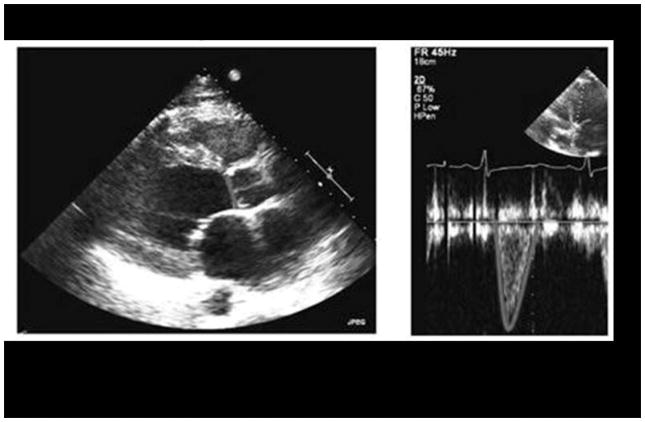
Stroke volume was derived using Philips CX50 CompactXtreme pulsed wave Doppler measuring ventricular outflow tract (LVOT) in either the apical long axis or 5-chamber view and the velocity time integral (VTI). LVOT diameter was measured in the parasternal long axis view in systole, with VTI providing information regarding blood velocity across the duration of systole in units of centimeter (cm). Stroke volume is calculated as the product of cross sectional area times the velocity of blood flow. Thus, SV = (LVOT area) x (LVOT VTI) = (π) x (Diameter/2)2 x (LVOT VTI). See Figure 1 for a representative SV measurement panel.
Figure 1.
Regional Bioimpedance Cardiography (NiCaS) Measurements
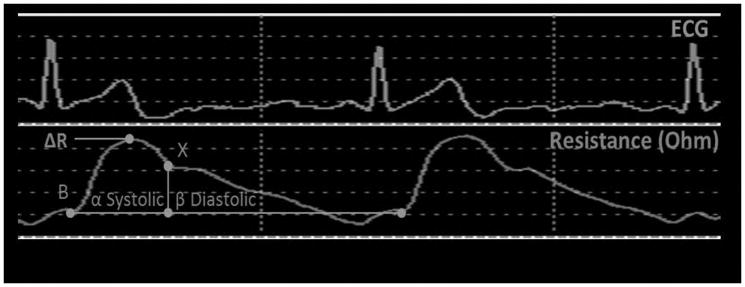
Stroke Volume is measured by applying alternating electrical current of 1.4 mA with a 30 kHz frequency through the patient body via two pairs of tetrapolar sensors, one pair placed on the wrist of the hand without the arteriovenous fistula or graft above the radial pulse and the other pair on the contralateral ankle above the posterior tibial arterial pulse. SV is calculated by Frinerman’s formula [24, 25]:
where dR is impedance change of the arterial system as a result of arterial system expansion during the systole, R is basal resistance, ρ is blood electrical resistance, L is patient’s height, Ri is corrected basal resistance according to gender and age, KW is the correction of weight according to ideal values, HF is a hydration factor which takes into account the body water composition, α+ β is the ECG R-R wave interval, and β is the diastolic time interval. SV is automatically calculated every 20 second and the average of three measurements obtained consecutively during 60 seconds of monitoring (see Figure 2).
Figure 2.
Statistical analysis
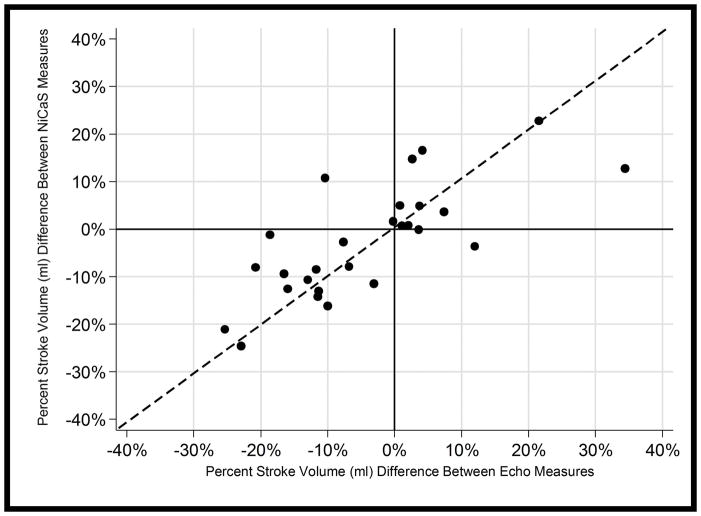
We report descriptive statistics as means with 95% confidence intervals (CI) adjusted for repeated measures at the patient level when appropriate, medians with interquartile ranges (the 25th and 75th percentiles), or counts and frequencies. Pearson’s correlation coefficient evaluated relation between NiCaS and Echo SV measurements. To account for repeated measurements, the Pearson correlation coefficient was calculated as a weighted average correlation coefficient, weighted by the number of repeated measurements observed for each patient. For variables with repeated measurements, a “between patients” correlation coefficient was derived to account for the serial correlation. Comparisons between two correlations were made by a method describe in [30]. P-value was then calculated based on Bland and Altman [31] where p-values <0.05considered to be statistically significant. In addition, a Bland Altman plot was created to assess the agreement between NiCaS and Echo SV measurements, and the limits of agreement were also adjusted for repeated measures within patients as well [32,33]. In addition, we derived differences from the first and last measures of SV with both the NiCaS and Echo devices and plotted the percent change from the first measure as a 4-Quardrant Plot [34, 35].
To compare means, we use a modified version of the paired t-test where we adjust for repeated measures within each patient at multiple time periods using robust variance estimators [36]. A linear regression model with no constant term and standard errors adjusted to take clustering at the patient level into account was developed between the predictor Echo and estimator (dependent variable) NiCaS [36]. An assessment of how the slope (the coefficient of Echo) differed from one (1) was done with a Wald test. Statistical analyses were performed using Stata/MP 13.1 for Windows (StataCorp LP, College Station, TX) and MedCalc Statistical Software version 16.4.3 (MedCalc Software bvba, Ostend, Belgium).
RESULTS
Seventeen (17) patients were measured resulting in a total of 64 observations (33 during the first hour and 31 during the last hour of HD treatment see Table 1). Baseline characteristics of the study population are summarized in Table 1.
Table 1.
Baseline characteristics for the study population
| Variable | All patients (n=17) |
|---|---|
|
| |
| Age, yr; Mean(SD); 95% CI | 69 (12); (63, 75) |
|
| |
| Women (N; %) | 13 (75%) |
|
| |
| White race; non-Hispanic (N, %) | 15 (88%) |
|
| |
| Weight (kg); Mean(SD); 95% CI | 76.9 (17.6); (66.9,86.9) |
|
| |
| Body mass index (kg/m2); Mean(SD); 95% CI | 30.4 (5.6), (27.1, 33.5) |
|
| |
| Body surface area (m2); Mean(SD); 95% CI | 1.8 (0.2), ; (1.7,1.9) |
|
| |
| Dialysis vintage*; Mean(SD); 95% CI | 4.3 ± 4.2, 2.5 (1.4,5.71) |
|
| |
| Access type: | |
| Arteriorvenous Fistula (AVF | 10 (58.8%) |
| Arteriorvenous Graft (AVG) | 6 (35.3%) |
| Left Jugular Catheter | 1 (5.9%) |
|
| |
| ESKD etiology: | |
| Hypertension | 7 (42%) |
| Diabetes mellitus | 7 (42%) |
| Other or unknown | 4 (24%) |
|
| |
| Comorbidities: | |
| Hypertension | 15 (88%) |
| Myocardial infarction/Congestive heart failure | 5 (29%) |
| Diastolic dysfunction | 6 (35%) |
|
| |
| Mean Stroke Volume (ml) in the first hour by the NiCaS device (N = 33 observations); 95% CI | 57.3; (49.2, 65.4) |
|
| |
| Mean Stroke Volume(ml) in the first hour by Echo (N = 33 observations); 95% CI | 59.3; (50.5, 68.1) |
|
| |
| Mean Stroke Volume (ml)in the last hour by the NiCaS device (N = 31 observations); 95% CI | 56.0; (49.3, 62.8) |
|
| |
| Mean Stroke Volume in the last hour by Echo (N = 31 observations); 95% CI | 56.5; (49.5, 63.6) |
|
| |
| Overall Stroke Volume as measured by the NiCaS device (ml); Mean (SD); 95% CI1 | 56.7 (13.6); (49.4, 64.0) |
|
| |
| Overall Stroke Volume over time as measured by Echocardiography (ML); Mean (SD); 95% CI1 | 58.0 (15.3); (50.1, 65.8) |
Categorical data are n (%). Continuous measures are mean(SD) and 95% CI of the mean. The mean and confidence intervals are adjusted for repeated measures within patients except for age which was taken as age at enrollment.
3 patients transferred into current facility without known vintage.
The mean (95% CI) values of measured Echo and NiCaS SV were 58.0 (50.1, 65.8) ml and 56.7 (49.4, 64.0) ml, respectively, p-value = 0.36. Pearson correlation analysis for measurements taken during the first and last hours were r = 0.93, p<0.001 (n = 33) and r = 0.92, p<0.001 (n = 31), respectively. Also, the overall Pearson correlation analysis was r = 0.92, p<0.001. Mean (95% CI) total fluid removed at the time of SV measurements during the first and last hours of HD treatment were 1001 (617, 1384) ml and 2142 (1539, 2745) ml, respectively.
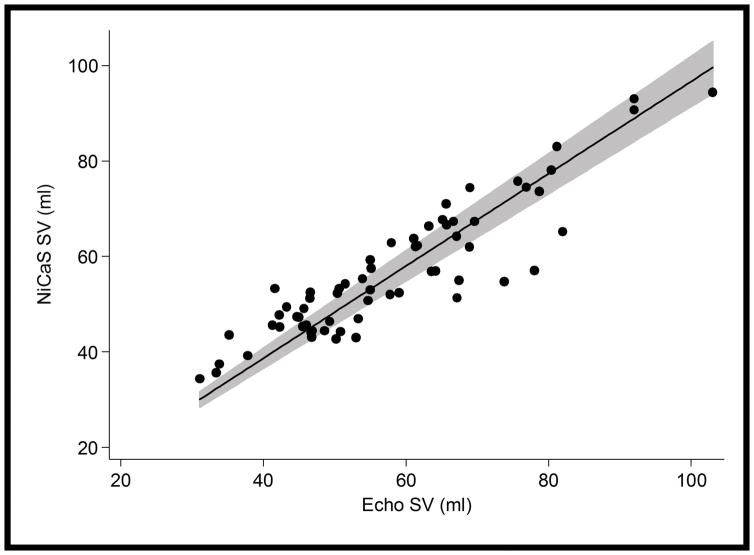
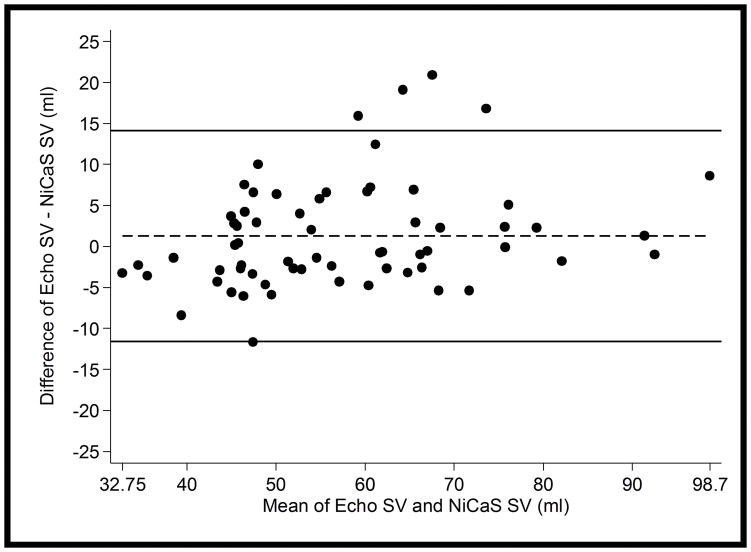
Adjusted linear regression with no constant term gave NiCaS SV = 0.97 x Echo SV, 95% CI = (0.91, 1.02), p<0.001 (See Figure 3). The slope (coefficient) of Echo did not differ from 1 (p= 0.20) which implies that NiCaS and Echo were similar across the observed range of values. The Bland-Altman plot showed similar results (see Figure 4). No visible trend in the differences between measures seemed apparent. The limits of agreement (95% confidence interval) between the NiCaS and Echo SV measurements were (−11.6, 14.1) ml and the mean difference was 1.3 ml (Figure 4). In only 1 patient out of 17 (5.9%) had the majority of the differences between their observations (3 out of 4 differences) fall outside the limits of agreement.
Figure 3.
Figure 4.
The 4-Quadrant plot in Figure 5 shows SV percent change from the first to last hours of treatments for both NiCaS and Echo for 27 observations from 15 patients (observations with a single measurement were excluded). Points falling in the upper left and lower right quadrants are discordant (i.e., one measurement shows a temporal increase while the other shows a decrease or vice versa). Only 2 out of 27 (7.4%) of these observations were in these quadrants. Additionally, the correlation of the percent change between the two methods was high, r = 0.77, p<0.001.
Figure 5.
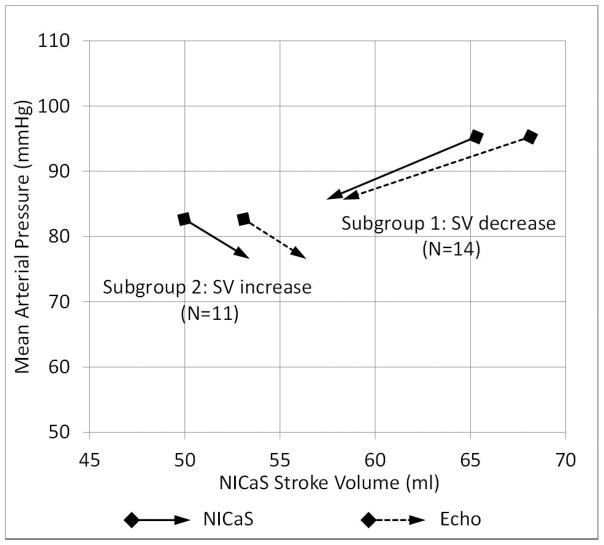
The change in mean arterial pressure (MAP) between first and last hours of treatments were compared with SV change between first and last hours of treatments (see Figure 6). Percent MAP difference was uncorrelated with percent SV difference: r = −0.03, p = 0.93 and r = 0.08, p = 0.79, for NiCaS and Echo, respectively.
Figure 6.
DISCUSSION
The main finding of this study is that the measurement of SV using NiCaS is strongly correlated with SV measured using Echo in ESKD patients undergoing maintenance HD. This correlation remains strong in the sub-group analysis during first-hour observations or last hour observations, suggesting that the degree of ultrafiltration did not have a significant effect on NiCaS measurements. The strong correlation is confirmed and substantiated by a nearly unity relation between the two techniques as seen in the linear regression analysis, and by the general agreement of the two methods in the Bland Altman plot. Furthermore, the 4-Quadrant plot showed that the changes in stroke volume over time as measured by the two devices trended in the same directions (i.e., both showed either increases or decreases over time) and tended to show similar percent changes over time as well.
Echocardiography is a well-established diagnostic tool for assessing cardiovascular status, however, it is operator-dependent and is not considered a practical option for routine assessment of hemodynamic parameters in HD. In contrast, NiCaS provides continuous, noninvasive SV measurement using a patient-friendly configuration in which two sensors are placed in the periphery (wrist and contralateral ankle). The signals measured in thoracic impedance cardiography whose sensors are placed on the thorax, in contrast to sensors that measure signals in the peripheral arterial system, are affected by noise distortion from various sources such as the lungs, vena cava, aorta, and movement of the heart. Note that we compared SV since it is the measured parameter. However, CO which is the product of SV and measured heart rate, is also available to the clinician.
Strengths and limitations of the study warrant comment. Strengths include being the first of its kind validation of NiCaS in an HD setting, study design capturing within-patient SV hemodynamics during an HD treatment, and use of rigorous statistical methods accounting for repeated measures within patients. Limitations include a single-center design and a high percentage of a white race cohort. A larger, multi-center study on a more diverse population should resolve such limitations.
Blood pressure is the only diagnostic tool available during routine HD in the management of hypertension and hypotension. Arguably, blood pressure data alone cannot accurately represent cardiovascular status. This study confirmed that blood pressure changes during first and last hours of treatments are not correlated with SV changes during the same periods. Hence, SV measurements can offer an added diagnostic dimension to that offered by blood pressure data alone. For example, the device permits the calculation of peripheral resistance from cardiac output and blood pressure. Decrease in resistance occurs commonly in the HD treatment, particularly in diabetic patients, and can be managed by cooling the dialysate or by use of adrenergic agonists such as midodrine, therapeutically or prophylactically.
In conclusion, NiCaS technology is well correlated with echocardiography, and offers a practical, noninvasive approach at the bedside for measuring hemodynamic parameters in the ESKD population during HD treatments. This technology has the potential to offer new physiological insights into hemodynamics during HD. This could facilitate the development of personalized intervention which sets optimal dry weight targets and adjusts ultrafiltration rates in reaction to changes in hemodynamic parameters. Thereby, the opportunity exists to improve cardiovascular outcomes in ESKD.
Acknowledgments
Disclosure of grants or other funding: This study was funded by New NI Medical, Israel, to RTANE. MJG has had a consulting relationship with Amgen, Ortho, Akedia, Fibrogen and Rockwell Medical. He has participated in clinical trials for these companies as a PI. YC is supported by award K25 DK096006 from the National Institutes of Health. BHN’s company, OptiStatim, LLC, received consulting fees from RTANE for statistical analysis. DO received consulting fees from RTANE and JJ, an employee of RTANE, were involved in data collection. NWL is a consultant with New NI Medical and Dialyze Direct. New NI Medical staff provided technical assistance in the application of NiCaS technology during the study. None of the entities who provided research support had any role in the study design, analysis and interpretation of results, or writing of the manuscript.
The authors extend thanks to Dr. Joseph Horowitz for statistical review and editorial contributions during manuscript development.
Footnotes
Conflict of Interest: All authors declare that they have no conflict of interest.
References
- 1.United States Renal Data System. 2014 USRDS annual data report: Epidemiology of kidney disease in the United States. National Institutes of Health, National Institute of Diabetes and Digestive and Kidney Diseases; Bethesda, MD: 2014. [Google Scholar]
- 2.Flythe JE, Xue H, Lynch KE, et al. Association of mortality risk with various definitions of intradialytic hypotension. J Am Soc Nephrol. 2015 Mar;26(3):724–34. doi: 10.1681/ASN.2014020222. [DOI] [PMC free article] [PubMed] [Google Scholar]
- 3.Shoji T, Tsubakihara Y, Fujii M, Imai E. Hemodialysis-associated hypotension as an independent risk factor for two-year mortality in hemodialysis patients. Kidney Int. 2004;66:1212–20. doi: 10.1111/j.1523-1755.2004.00812.x. [DOI] [PubMed] [Google Scholar]
- 4.Tisler A, Akócsi K, Borbás B, et al. The effect of frequent or occasional dialysis-associated hypotension on survival of patients on maintenance haemodialysis. Nephrol Dial Transplant. 2003;18:2601–5. doi: 10.1093/ndt/gfg450. [DOI] [PubMed] [Google Scholar]
- 5.Zoccali C, Benedetto FA, Tripepi G, Mallamaci F. Cardiac consequences of hypertension in hemodialysis patients. Semin Dial. 2004;17:299–303. doi: 10.1111/j.0894-0959.2004.17331.x. [DOI] [PubMed] [Google Scholar]
- 6.Flythe JE, Kimmel SE, Brunelli SM. Rapid fluid removal during dialysis is associated with cardiovascular morbidity and mortality. Kidney Int. 2011;79:250–7. doi: 10.1038/ki.2010.383. [DOI] [PMC free article] [PubMed] [Google Scholar]
- 7.McIntyre CW, Odudu A. Hemodialysis-associated cardiomyopathy: a newly defined disease entity. Semin Dial. 2014 Mar;27(2):87–97. doi: 10.1111/sdi.12197. [DOI] [PubMed] [Google Scholar]
- 8.Weiner DE, Brunelli SM, Hunt A, et al. Improving clinical outcomes among hemodialysis patients: a proposal for a “volume first” approach from the chief medical officers of US dialysis providers. Am J Kidney Dis. 2014 Nov;64(5):685–95. doi: 10.1053/j.ajkd.2014.07.003. [DOI] [PubMed] [Google Scholar]
- 9.Dasgupta I, Farrington K, Davies SJ, et al. UK National Survey of Practice Patterns of Fluid Volume Management in Haemodialysis Patients: A Need for Evidence. Blood Purif. 2016;41(4):324–31. doi: 10.1159/000444246. [DOI] [PubMed] [Google Scholar]
- 10.Daugirdas JT. Dialysis hypotension: a hemodynamic analysis. Kidney Int. 1991 Feb;39(2):233–46. doi: 10.1038/ki.1991.28. [DOI] [PubMed] [Google Scholar]
- 11.Thijssen S, Kappel F, Kotanko P. Absolute blood volume in hemodialysis patients: why is it relevant, and how to measure it? Blood Purif. 2013;35(1–3):63–71. doi: 10.1159/000345484. [DOI] [PubMed] [Google Scholar]
- 12.Paganini EP, Fouad F, Tarazi RC, et al. Hemodynamics of isolated ultrafiltration in chronic hemodialysis patients. Trans Am Soc Artif Intern Organs. 1979;25:422–5. doi: 10.1097/00002480-197902500-00081. [DOI] [PubMed] [Google Scholar]
- 13.Steuer RR, Harris DH, Conis JM. A new optical technique for monitoring hematocrit and circulating blood volume: Its application in renal dialysis. Dialysis & Transplant. 1993;22:260–5. [Google Scholar]
- 14.Paolini F, Mancini E, Bosetto A, Santoro A. Hemoscan: a dialysis machine-integrated blood volume monitor. Int J Artif Organs. 1995;18:487–94. [PubMed] [Google Scholar]
- 15.Yoshida I, Ando K, Ando Y, et al. A new device to monitor blood volume in hemodialysis patients. Ther Apher Dial. 2010;14:560–5. doi: 10.1111/j.1744-9987.2010.00845.x. [DOI] [PubMed] [Google Scholar]
- 16.Hemoscan [Internet] Baxter Canada; [cited 2017 Feb 1]. Available from: http://www.baxter.ca/en/healthcare_professionals/therapies/gambro_therapies/hemodialysis/hemoscan/index.html. [Google Scholar]
- 17.Dialysis System DBB-07 [Internet] NIKKISO Europe GmbH; [cited 2017 Feb 1]. Available from: http://www.nikkiso-europe.eu/pr_details.html?&no_cache=1&L=1&tx_ttnews%5BbackPid%5D=289&tx_ttnews%5Btt_news%5D=32157&cHash=97ca5ffb6a7c279ca1217ea55947691f. [Google Scholar]
- 18.Reddan DN, Szczech LA, Hasselblad V, et al. Intradialytic blood volume monitoring in ambulatory hemodialysis patients: a randomized trial. Am Soc Nephrol. 2005 Jul;16(7):2162–9. doi: 10.1681/ASN.2004121053. [DOI] [PubMed] [Google Scholar]
- 19.Armstrong LE. Assessing hydration status: the elusive gold standard. J Amer Col Nutr. 2007;26:575S–84S. doi: 10.1080/07315724.2007.10719661. [DOI] [PubMed] [Google Scholar]
- 20.Lee AJ, Cohn JH, Ranasinghe JS. Cardiac output assessed by invasive and minimally invasive techniques. Anesthesiol Res Pract. 2011;2011:475151. doi: 10.1155/2011/475151. [DOI] [PMC free article] [PubMed] [Google Scholar]
- 21.Cotter G, Schachner A, Sasson L, et al. Impedance cardiography revisited. Physiol Meas. 2006 Sep;27(9):817–827. doi: 10.1088/0967-3334/27/9/005. [DOI] [PubMed] [Google Scholar]
- 22.Handt A, Farber A, Szwed J. Intradialytic measurement of cardiac output by thermodilution and impedance cardiography. Clinical Nephrology. 1977;7(2):61–64. [PubMed] [Google Scholar]
- 23.Paredes OL, Shite J, Shinke T, et al. Impedance Cardiography for Cardiac Output Estimation - Reliability of Wrist-to-Ankle Electrode Configuration. Circulation Journal. 2006;70(9):1164–68. doi: 10.1253/circj.70.1164. [DOI] [PubMed] [Google Scholar]
- 24.Cotter G, Moshkovitz Y, Kaluski E, et al. Accurate, non-invasive, continuous monitoring of cardiac output by whole body electrical bio-impedance. Chest. 2004;125(4):1431–1440. doi: 10.1378/chest.125.4.1431. [DOI] [PubMed] [Google Scholar]
- 25.Leitman L, Sucher E, Kaluski E, et al. Noninvasive measurement of cardiac output by whole-body bio-impedance during dobutamine stress echocardiography: Clinical implications in patients with left ventricular dysfunction and ischaemia. European J Heart Fail. 2006;8(2):136–140. doi: 10.1016/j.ejheart.2005.06.006. [DOI] [PubMed] [Google Scholar]
- 26.Chesterton LJ, Selby NM, Burton JO, et al. Categorization of the hemodynamic response to hemodialysis: the importance of baroreflex sensitivity. Hemodial Int. 2010 Jan;14(1):18–28. doi: 10.1111/j.1542-4758.2009.00403.x. [DOI] [PubMed] [Google Scholar]
- 27.Odudu A, Eldehni MT, McCann GP, et al. Characterisation of cardiomyopathy by cardiac and aortic magnetic resonance in patients new to hemodialysis. Eur Radiol. 2016 Aug;26(8):2749–61. doi: 10.1007/s00330-015-4096-2. [DOI] [PMC free article] [PubMed] [Google Scholar]
- 28.Eldehni MT, Odudu A, McIntyre CW. Randomized clinical trial of dialysate cooling and effects on brain white matter. J Am Soc Nephrol. 2015 Apr;26(4):957–65. doi: 10.1681/ASN.2013101086. [DOI] [PMC free article] [PubMed] [Google Scholar]
- 29.Chiu DY, Green D, Abidin N, et al. Echocardiography in hemodialysis patients: uses and challenges. Am J Kidney Dis. 2014 Nov;64(5):804–16. doi: 10.1053/j.ajkd.2014.01.450. [DOI] [PubMed] [Google Scholar]
- 30.Cohen J, Cohen P. Applied Multiple Regression/Correlation Analysis for the Behavioral Sciences. 2 Hillsdale, NJ: Lawrence Erlbaum Associates; 1983. [Google Scholar]
- 31.Bland JM, Altman D. Statistical methods for assessing agreement between two methods of clinical measurement. The lancet. 1986 Feb 8;327(8476):307–10. [PubMed] [Google Scholar]
- 32.Bland JM, Altman DG. Calculating correlation coefficients with repeated observations: Part 2—correlation between patients. BMJ. 1995b;310:633. doi: 10.1136/bmj.310.6980.633. [DOI] [PMC free article] [PubMed] [Google Scholar]
- 33.Bland JM, Altman DG. Measuring agreement in method comparison studies. Stat methods Med Res. 1999 Apr;8(2):135–60. doi: 10.1177/096228029900800204. [DOI] [PubMed] [Google Scholar]
- 34.Møller-Sørensen H, Cordtz J, Østergaard M, et al. Transesophageal Doppler reliably tracks changes in cardiac output in comparison with intermittent pulmonary artery thermodilution in cardiac surgery patients. Journal of clinical monitoring and computing. J Clin Monit Comput. 2017 Feb;31(1):135–14. doi: 10.1007/s10877-015-9806-4. [DOI] [PubMed] [Google Scholar]
- 35.Saugel B, Grothe O, Wagner JY. Tracking changes in cardiac output: statistical considerations on the 4-quadrant plot and the polar plot methodology. Anesthesia & Analgesia Anesth Analg. 2015 Aug;121(2):514–24. doi: 10.1213/ANE.0000000000000725. [DOI] [PubMed] [Google Scholar]
- 36.Williams RL. A note on robust variance estimation for cluster-correlated data. Biometrics. 2000;56:645–646. doi: 10.1111/j.0006-341x.2000.00645.x. [DOI] [PubMed] [Google Scholar]


