Abstract
Modeling studies suggest that differences in neural responses between polarities might reflect underlying neural health. Specifically, large differences in electrically evoked compound action potential (eCAP) amplitudes and amplitude-growth-function (AGF) slopes between polarities might reflect poorer peripheral neural health, whereas more similar eCAP responses between polarities might reflect better neural health. The interphase gap (IPG) has also been shown to relate to neural survival in animal studies. Specifically, healthy neurons exhibit larger eCAP amplitudes, lower thresholds, and steeper AGF slopes for increasing IPGs. In ears with poorer neural survival, these changes in neural responses are generally less apparent with increasing IPG. The primary goal of this study was to examine the combined effects of stimulus polarity and IPG within and across subjects to determine whether both measures represent similar underlying mechanisms related to neural health. With the exception of one measure in one group of subjects, results showed that polarity and IPG effects were generally not correlated in a systematic or predictable way. This suggests that these two effects might represent somewhat different aspects of neural health, such as differences in site of excitation versus integrative membrane characteristics, for example. Overall, the results from this study suggest that the underlying mechanisms that contribute to polarity and IPG effects in human CI recipients might be difficult to determine from animal models that do not exhibit the same anatomy, variance in etiology, electrode placement, and duration of deafness as humans.
Keywords: cochlear implant, electrically evoked compound action potential, polarity, interphase gap
1. Introduction
1.1. Polarity Effects
Several studies in recent years have demonstrated that the anodic polarity is more effective than the cathodic polarity at stimulating the deafened human auditory system with a cochlear implant (CI; Hughes et al., 2017; Macherey et al., 2008; Undurraga et al., 2010, 2013). More specifically, the anodic phase — either as a pseudomonophasic pulse or the leading phase of a symmetrical biphasic pulse — can produce larger electrically evoked compound action potential (eCAP) amplitudes, shorter N1 eCAP latencies, and steeper slopes of the amplitude growth function (AGF). With monophasic pulses, human auditory nerve modeling suggests that both anodic and cathodic pulses effectively elicit action potentials when peripheral processes are intact, with generally lower thresholds for cathodic stimulation (Rattay et al., 2001a,b). However, in the deafened ear, the model suggests that anodic pulses are more effective than cathodic pulses because the anodic phase directly activates the central axon, whereas the cathodic phase requires more current to overcome the unmyelinated soma. This concept is illustrated in Fig. 1. For the healthy neuron (Fig. 1, top panel), both polarities produce peripheral-to-central propagation at low levels. At higher levels, the anodic phase also yields direct spiking in the central axon, which can produce both orthodromic and antidromic propagation (indicated by bidirectional arrows in Fig. 1; Miller et al., 2004; Rattay et al., 2001a). For the peripherally degenerated neuron (Fig. 1, bottom panel), a 5–6-fold increase in current strength is needed for spike initiation with the cathodic phase, as compared to the anodic phase (Rattay et al., 2001a). Rattay et al. (2001b) reported similar results for symmetrical biphasic pulses, where thresholds were lower for anodic-leading than for cathodic-leading pulses in the degenerated neuron (“short dendrite” in their model).
Fig. 1.
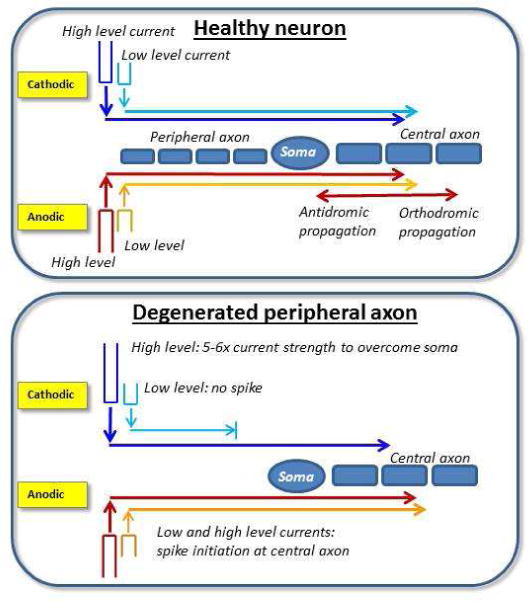
Schematic illustration of polarity effects based on modeling work by Ratty et al. (2001a,b). Top: For the healthy neuron, both anodic and cathodic polarities produce peripheral-to-central propagation at low levels (directional arrows pointing toward the right). At higher levels, the anodic phase also yields direct spiking in the central axon. Bidirectional arrows represent orthdromic and antidromic action potential propagation for high levels. Bottom: For the degenerated neuron with missing peripheral axons, a 5–6-fold increase in current strength is needed for spike initiation with the cathodic phase, as compared to the anodic phase (Rattay et al., 2001a).
Differences in eCAP responses between polarities might provide insight about neural survival patterns within individuals. Because modeling studies show that the cathodic phase requires more current to generate an action potential than the anodic phase in the degenerated neuron, then we might expect large differences in eCAP responses between polarities. Specifically, regions of poorer neural survival are expected to yield smaller eCAP amplitudes and potentially higher thresholds (depending on the degree of degeneration) for cathodic- than for anodic-leading pulses. AGF slopes are expected to be shallower for cathodic-leading pulses due to expected smaller amplitudes and increased current requirements for spike initiation with cathodic than for anodic pulses. Likewise, AGF slopes are expected to be steeper for anodic-leading pulses because the anodic polarity directly stimulates the central axon, where neurons there are more tightly bundled than at the periphery. This should lead to larger amplitudes and a steeper growth of response, either because more neurons are stimulated at a given current level or because they respond more synchronously. Alternatively, regions of better neural survival are expected to yield eCAP amplitudes and slopes that are similar for both polarities, and thresholds that are either similar or potentially lower for cathodic-leading pulses.
1.2. Interphase Gap Effects
A second measure that might provide insight regarding auditory-nerve survival in humans is the degree to which eCAP responses change with increased duration of an interphase gap (IPG). By introducing an IPG between opposing phases, there is an increased probability that the neuron will fire before the charge is removed by the opposing phase (McKay & Henshall, 2003; Ramekers et al., 2014; Rubinstein et al., 2001; Shepherd & Javel, 1999; van den Honert & Mortimer, 1979). For fibers that are just above the threshold of activation, there is a “vulnerable” period where the action potential can be preemptively abolished by the subsequent opposing phase (van den Honert & Mortimer, 1979). This time period is reportedly between 8.7 μsec (modeling data) and 16 μsec (cat data) (Rubinstein et al., 2001). When the IPG exceeds approximately 100 μsec, thresholds for a biphasic pulse approach that of a monophasic pulse, regardless of the polarity of the leading phase (Shepherd & Javel, 1999; van den Honert & Mortimer, 1979). In healthy neurons, data from guinea pigs show an increase in eCAP amplitudes, a decrease in thresholds (Prado-Guitierrez et al., 2006; Ramekers et al., 2014), and an increase in AGF slopes (Ramekers et al., 2014) as IPG increases. In deafened ears with reduced spiral ganglion cell density, amplitude (Prado-Guitierrez et al., 2006; Ramekers et al., 2014) and slope (Ramekers et al., 2014) changes are less apparent with increased IPG. Conflicting results have been reported for eCAP threshold, however. Prado-Guitierrez et al. (2006) reported smaller IPG effects on threshold in deafened ears, similar to the trends observed for amplitude and slope. They attributed this outcome to an increase in the time constant of the neural membrane with greater degrees of demyelination. Longer time constants would require a longer IPG for the demyelinated neuron to reach threshold. In contrast, Ramekers et al. (2014) reported that eCAP thresholds decreased more with increased IPG for ears with greater degrees of degeneration, as compared to normal-hearing ears. They postulated that the reduced spiral ganglion cell packing density in the deafened ears might allow for a lower impedance current path for more direct stimulation of the central axon, resulting in lower eCAP thresholds for longer IPGs. In human CI recipients, eCAP studies that evaluated IPG effects have primarily focused on amplitude and/or AGF slope (Kim et al., 2010; Schvartz-Leyzac et al., 2016). As a result, little is known about IPG effects on eCAP threshold in humans.
1.3. Present Study
The overall goal of this study was to characterize the combined effects of stimulus polarity and IPG within a group of CI recipients to determine whether both measures represent similar underlying patterns of neural health. If eCAP responses change with both stimulus polarity and IPG according to expected trends from animal and modeling studies, then we hypothesize that both measures likely reflect similar aspects of neural health. If, however, polarity and IPG exhibit conflicting trends within an electrode, then we hypothesize that each measure potentially reflects different aspects of neural health, such as site of excitation (potentially reflected in the polarity measures) versus temporal/integrative properties related to the degree of demyelination (potentially reflected in the IPG measures). The present study utilized biphasic pulses because (1) Rattay et al. (2001b) showed similar polarity effects for monophasic pulses and the leading phase of symmetrical biphasic pulses, (2) symmetrical biphasic pulses are the standard stimuli used for IPG studies, and (3) clinical stimulation occurs with symmetrical biphasic pulses.
This study consisted of two experiments. For both experiments, eCAP AGFs were obtained with anodic-leading and cathodic-leading symmetrical biphasic current pulses for a range of IPGs. Both experiments examined the combined effects of polarity and IPG on eCAP AGFs, but each experiment was conducted in a different group of subjects for a slightly different focus. In Exp. 1 (Advanced Bionics subjects), the goal was to examine polarity and IPG effects within a single middle-array electrode for each subject, including the effect of having no IPG (this is the default pulse design for Advanced Bionics devices). This experiment was motivated in part by the results from a recent study in our laboratory (Hughes et al., 2017). In that study, Cochlear recipients demonstrated significantly larger eCAP amplitudes and steeper AGF slopes for anodic-leading pulses versus cathodic-leading symmetrical biphasic pulses using the traditional forward-masking subtraction method to resolve the eCAP. In contrast, the Advanced Bionics recipients showed no significant polarity effects for either outcome measure. Measures for both device types in that study were obtained using the default stimuli used to elicit eCAPs for that particular manufacturer. One of the major differences between manufacturers’ stimuli is that the biphasic pulses used with Cochlear recipients are designed with a 7-μsec IPG (default setting; a no-IPG condition is not possible). In contrast, the default biphasic pulses used with Advanced Bionics subjects do not utilize an IPG. It was proposed in that study that the lack of polarity effects for Advanced Bionics recipients might be caused by the lack of an IPG. Because the IPG allows more time for an action potential to be initiated by the first phase before the charge is removed by the second phase (e.g., Shepherd & Javel, 1999), it is anticipated that the leading phase will have a greater effect for a pulse with an IPG than without. In addition to examining the congruency between polarity and IPG effects, Exp. 1 therefore also aimed to resolve whether the stimulus without an IPG was responsible for the lack of polarity effects observed in Hughes et al. (2017) for Advanced Bionics recipients.
In Exp. 2 (Cochlear subjects), the goal was to examine polarity and IPG effects across four regions of the electrode array (basal, mid-basal, mid-apical, and apical). IPGs ranged from 7–58 μsec, which represents the range available in Cochlear’s clinical Custom Sound EP software. Based on earlier studies that suggest poorer neural survival in the basal turn than in the middle and apical turns (e.g., Nadol, 1997; Nadol et al., 2001), we hypothesized that smaller IPG effects and larger polarity effects would be observed for basal electrodes than for middle or apical electrodes, reflecting poorer neural health in the basal region (Undurraga et al., 2010).
For both experiments, the following three outcome measures were examined: eCAP threshold, amplitude, and AGF slope. Hypotheses for each outcome measure were:
Threshold: eCAP thresholds should be largely unaffected by polarity because polarity effects for physiological measures in CI recipients have primarily been observed only at supra-threshold levels (Hughes et al., 2017). However, for more extreme peripheral degeneration, higher thresholds could be observed for cathodic- than for anodic-leading pulses (see Fig. 1, bottom panel), based on the model of Rattay et al. (2001a), which demonstrates a 5–6-fold increase in current strength needed for the cathodic phase to overcome the unmyelinated soma. For IPG, eCAP thresholds should decrease with increased IPG. Because outcomes for IPG effects in animal studies are conflicting, we cannot make a prediction about the direction of a correlation between polarity and IPG effects on threshold. Larger IPG effects might reflect regions of poorer neural survival, if consistent with Ramekers et al. (2014), or regions of better neural survival, if consistent with Prado-Guitierrez et al. (2006).
Amplitude: Polarity effects for eCAP amplitude should be negatively correlated with IPG effects. That is, larger amplitude differences between polarities should be correlated with smaller amplitude differences across IPGs (reflecting poorer neural health), and smaller polarity effects should be observed for larger IPG effects (reflecting better neural health).
Slope: Polarity effects for AGF slope should be negatively correlated with IPG effects. That is, larger slope differences between polarities should be correlated with smaller slope differences across IPGs (reflecting poorer neural health), and smaller polarity effects should be observed for larger IPG effects (reflecting better neural health).
2. Experiment 1: Polarity and IPG Effects for a Single Electrode (Advanced Bionics)
2.1. Materials and Methods
2.1.1. Participants
eCAP AGFs were obtained for 12 ears in 11 Advanced Bionics (Valencia, CA) recipients. One participant (C8/C47) had bilateral CIs, for which both ears were tested. Demographic details for the participants in Exp. 1 are summarized in the top portion of Table 1. The mean age at implantation for this group was 38.8 years (range: 1.3–70.9). The mean duration of CI use was 10.1 years (range: 1.8–15.3), and the mean duration of deafness was 19.3 years (range: 5.8–59.4). All participants for both experiments signed an informed consent for the study protocol (03-07-XP), which was approved by the Boys Town National Research Hospital Institutional Review Board. Participants were compensated for their time and travel.
Table 1.
Participant demographics for both experiments. Ages and durations are in years, months.
| Subj. | Device | Ear | Age at CI | Age at Test | Dur. CI Use | Dur. Deafness | Etiology/Onset | Test Electrodes |
|---|---|---|---|---|---|---|---|---|
| Experiment 1 | ||||||||
| C8* | CII | L | 55, 7 | 67, 9 | 12, 2 | 15, 7 | Unknown/Progressive | 11 |
| C27 | CII | L | 40, 1 | 53, 10 | 13, 9 | 14, 4 | Unknown/Progressive | 9 |
| C29 | 90K | R | 30, 11 | 40, 0 | 9, 1 | 30, 0 | Meningitis/Sudden | 9 |
| C39 | 90K | L | 63, 0 | 69, 8 | 6, 8 | 7, 2 | Unknown/Sudden SNHL | 8 |
| C40 | CII | L | 59, 5 | 74, 9 | 15, 4 | 36, 10 | Genetic/Progressive | 9 |
| C42 | 90K | R | 70, 11 | 74, 7 | 3, 8 | 5, 10 | Unknown-Familial/Progressive | 9 |
| C43 | CII | L | 1, 6 | 14, 11 | 13, 5 | 14, 11 | Meningitis/Congenital | 9 |
| C47* | 90K | R | 65, 11 | 67, 9 | 1, 10 | 12, 4 | Unknown/Progressive | 11 |
| C69 | CII | R | 1, 4 | 14, 11 | 13, 7 | 14, 9 | Unknown/Progressive | 11 |
| C80 | 90K | L | 4, 1 | 12, 5 | 8, 4 | 11, 7 | Unknown/Congenital | 8 |
| C86 | 90K | R | 24, 6 | 32, 11 | 8, 5 | 9, 0 | Unknown/Progressive | 9 |
| C101 | CII | R | 48, 1 | 63, 5 | 15, 4 | 59, 5 | German measles/Congenital | 9 |
| Experiment 2 | ||||||||
| F1 | CI24RE(CA) | L | 60, 7 | 69, 9 | 9, 2 | 11, 0 | Unknown/Progressive | 1, 8, 15, 22 |
| F2 | CI24RE(CA) | R | 60, 3 | 68, 7 | 8, 4 | 18, 9 | Unknown/Progressive | 3, 9, 12, 15 |
| F10† | CI24RE(CA) | R | 8, 3 | 17, 9 | 9, 6 | 17, 9 | Waardenburg Syndrome/Congenital | 3, 8, 15, 22 |
| F11† | CI24RE(CA) | L | 1, 10 | 17, 9 | 15, 11 | 17, 9 | Waardenburg Syndrome/Congenital | 4, 8, 15, 22 |
| F15 | CI24RE(CA) | L | 14, 6 | 23, 0 | 8, 6 | 28, 10 | Unknown/Congenital | 1, 8, 14, 22 |
| FS20 | CI422 | R | 67, 3 | 69, 9 | 2, 6 | 6, 5 | Unknown-Familial/Progressive | 3, 8, 15, 22 |
| FS22 | CI422 | L | 13, 9 | 16, 0 | 2, 3 | 4, 5 | Meningitis/Congenital | 3, 8, 15, 22 |
| FS26 | CI422 | L | 54, 3 | 55, 5 | 1, 2 | 6, 5 | Unknown/Sudden | 1, 10, 15, 22 |
| F27 | CI24RE(CA) | L | 56, 2 | 57, 2 | 1, 0 | 11, 6 | Otosclerosis/Progressive | 4, 8, 15, 22 |
| FS32 | CI422 | L | 58, 9 | 61, 4 | 2, 7 | 10, 10 | Unknown/Progressive | 3, 8, 15, 22 |
| N1 | CI512 | L | 58, 3 | 64, 11 | 6, 8 | 15, 7 | Unknown-Noise Exposure/Progressive | 3, 8, 15, 22 |
| N11 | CI512 | L | 67, 5 | 71, 5 | 4, 0 | 10, 5 | Unknown-Noise Exposure/Progressive | 1, 9, 15, 22 |
Matched symbols indicate both ears from participants with bilateral CIs. CI, cochlear implant.
2.1.2. Equipment and Stimuli
Data were obtained using the Bionic Ear Data Collection System (BEDCS, v.1.18.337; Advanced Bionics, Valencia, CA). Stimuli were delivered through a Platinum Series Processor (PSP) and clinical programming interface (CPI-II). All stimuli consisted of symmetrical, biphasic, cathodic-leading or anodic-leading current pulses presented in monopolar mode. Pulses were 32.33 μsec/phase with the following four IPGs: 0, 10.78, 26.94, and 53.88 μsec (for brevity, these values are rounded here forth). A single mid-array intracochlear electrode was used for stimulation (see Table 1). eCAPs were recorded from an intracochlear electrode located two positions apical to the stimulating electrode, referenced to the extracochlear monopolar electrode (located on the body of the implant for CII devices; ring electrode for 90K devices). The probe repetition rate was approximately 20 Hz. A gain of 1000 (linear multiplier; equal to 60 dB) was used. The standard four-frame forward-masking subtraction method (Abbas et al., 1999) was used to separate the eCAP from stimulus artifact. These four frames consist of the probe alone (A), the masker and probe (B), the masker alone (C), and a zero-amplitude pulse (D) to obtain a template of the artifact associated with switching on the recording amplifier. The resulting eCAP response is resolved by applying the formula A − B + C − D. For each polarity and IPG condition, the masker and probe both consisted of the same stimulus (i.e., same polarity and same IPG), except that the level of the masker was offset to be higher than that of the probe to ensure adequate masking. eCAP responses were averaged across 100 sweeps over a 2-ms time window, sampled at 56 kHz, and smoothed using a 2-point boxcar filter.
2.1.3. Procedures
First, electrode impedances were measured in the SoundWave commercial programming software (Advanced Bionics, Valencia, CA) for each subject to exclude malfunctioning electrodes and to avoid stimulating beyond voltage compliance limits. Next, participants were asked to rate the loudness of 10 sweeps of the four-frame eCAP stimulus using a 10-point scale (1, just noticeable; 8, loud but comfortable; and 9, upper loudness limit) so that the starting stimulation levels for AGFs could be determined. These loudness estimates were obtained for all four IPG conditions using only the anodic-leading stimulus. This was done so that eCAPs for both polarities (within an IPG) could be compared at equal current levels, and because the anodic-leading stimulus tended to be perceived as louder than the cathodic-leading stimulus. The current level was systematically increased using a step size of 0.41 dB. To obtain the eCAP AGF, the starting stimulation level for the masker was set to equal that for the ‘8’ loudness rating, and the starting probe level was 1.57 dB below that of the masker. The offset current levels for the masker and probe were both systematically decreased by a step size of 0.41 dB. The stimulation was stopped after eCAP responses could no longer be visually identified. The order in which AGFs were obtained (polarity, IPG) was randomized within each subject.
2.1.4. Data Analysis
Data were exported from BEDCS into a custom Matlab program that was used to manually mark the N1 and P2 peaks and then calculate the peak-to-peak amplitudes. Stimulation current from BEDCS was converted to dB (re: 1 μA). Within each subject, all AGFs were normalized to the highest amplitude of the AGF for the clinical default stimulus, which was cathodic-leading with 0 μsec IPG (Cath 0). An example is shown in Fig. 2 for e11 in subject C47. Raw and normalized eCAP amplitudes are shown in the top and bottom panels, respectively. Increasing IPGs are indicated by progressively darker shading, as indicated in the figure legend. AGFs for cathodic- and anodic-leading stimuli are shown with circles and triangles, respectively. Note that the relative differences between functions are preserved with the normalization procedure.
Fig. 2.
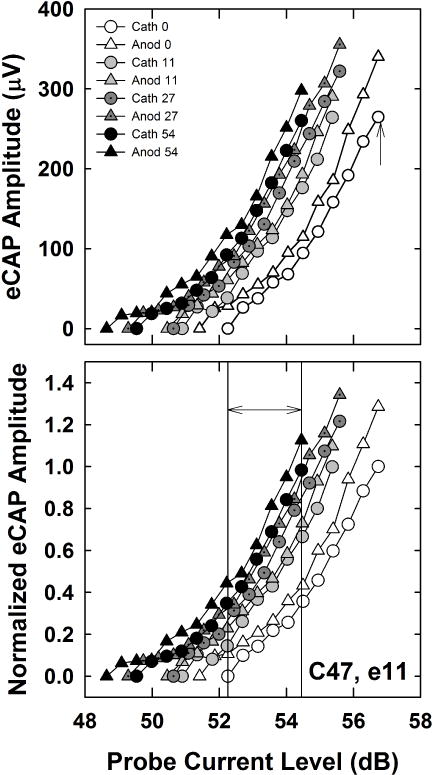
Top: Individual example of raw eCAP AGFs for both polarities (cathodic, circles; anodic, triangles) and all four IPGs (0, 11, 27, and 54 μsec) for Advanced Bionics subject C47, electrode 11. Short (0 μsec) to long (54 μsec) IPGs are indicated by progressively darker shading, as indicated in the figure legend. Bottom: All AGFs were normalized to the highest amplitude of the AGF for the clinical default stimulus, which was cathodic-leading with 0 μsec IPG (Cath 0), indicated by the up-pointing arrow in the top panel. To obtain the average normalized amplitude for each polarity and IPG condition, normalized amplitudes within an AGF were averaged across a range of current levels that yielded eCAPs across all polarity/IPG conditions. This range is indicated by the double arrow between the two vertical lines in the bottom panel.
eCAP threshold was defined as the lowest current level that yielded a visually detectable response above the noise floor (approximately 20–40 μV). For all eight AGFs within a subject, average amplitudes were calculated across a common range of current levels for which eCAPs were measured (similar to Hughes et al., 2017). This process is illustrated in the bottom panel of Fig. 2. The normalized amplitudes at and between the vertical lines were averaged for each AGF. The lower boundary (left vertical line) was defined by the highest current level that yielded a zero-amplitude eCAP (Cath 0 AGF in the example shown in Fig. 2). The upper boundary (right vertical line) was defined by the highest common current level across all AGFs (Anod 54 in the example in Fig 2). Finally, linear regression was applied to each normalized AGF (entire function) to determine the slope of each function.
A two-way repeated-measures analysis of variance (RM ANOVA; SPSS v. 18, PASW Statistics, SPSS Inc., Chicago, IL) was used to evaluate the effects of polarity and IPG on threshold, average normalized amplitude, and AGF slope. Greenhouse-Geisser corrections for degrees of freedom were used when the assumption of sphericity (Mauchly’s Test of Sphericity) was not met. Bonferroni corrections were used to adjust alpha for multiple comparisons.
2.2. Results
Fig. 3 shows the mean (±1 SD) eCAP thresholds for both polarities across the four IPGs tested. Cathodic and anodic results are indicated by circles and triangles, respectively. Results showed no significant polarity effects (F(1, 11) = 0.013, p = 0.91). Mean thresholds (collapsed across IPG) were 50.96 and 50.94 dB for cathodic- and anodic-leading pulses, respectively. The effect of IPG was significant (F(3, 33) = 145.91, p < 0.001), as expected, with progressively lower thresholds for longer IPGs. Mean thresholds (collapsed across polarity) were 52.13, 51.04, 50.53, and 50.11 dB for IPGs of 0, 11, 27, and 54 μsec, respectively. The largest threshold decrease occurred between IPGs of 0 and 11 μsec. All pairwise comparisons for IPG were statistically significant (p < 0.002). Last, there was a small but statistically significant interaction between polarity and IPG (F(3, 33) = 3.08, p = 0.041). For the shorter IPGs, cathodic thresholds were slightly higher than anodic thresholds (52.23 dB versus 50.02 dB, respectively, for IPG 0 μsec); but at the longest IPG, cathodic thresholds were slightly lower than anodic thresholds (49.94 dB versus 50.28 dB, respectively). None of these polarity differences were statistically significant when tested separately by IPG (p > 0.1; individual paired t tests).
Fig. 3.
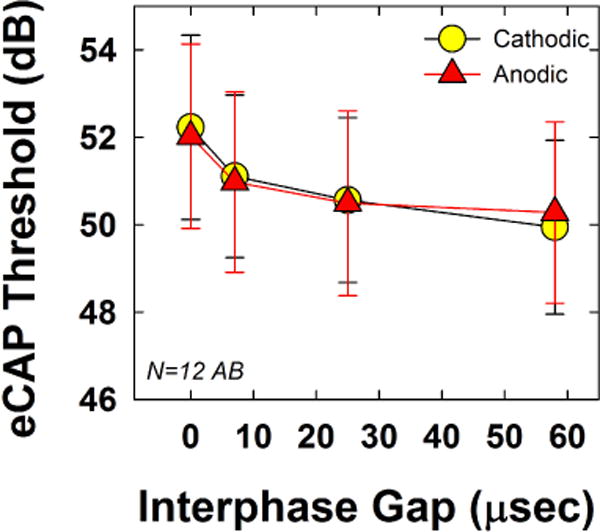
Mean (±1 SD) eCAP thresholds for both polarities (circles, cathodic; triangles, anodic), across IPGs of 0, 11, 27, and 54 μsec. Data are from a single mid-array electrode, averaged across 12 Advanced Bionics recipients participating in Exp. 1.
Fig. 4 shows the group mean (±1 SD) normalized average amplitudes for both polarities across the four IPGs tested. Data are plotted similar to Fig. 3. Results showed no significant polarity effects (F(1, 11) = 0.323, p = 0.58), which was consistent with our earlier study for biphasic pulses with no IPG (Hughes et al., 2017). Mean normalized amplitudes (collapsed across IPG) were 0.54 and 0.55 for cathodic- and anodic-leading pulses, respectively. The effect of IPG was significant (F(1.1, 11.7 = 30.11, p < 0.001), as expected, with progressively larger amplitudes for longer IPGs, given consistent current levels. Mean normalized average amplitudes (collapsed across polarity) were 0.30, 0.50, 0.64, and 0.74 for IPGs of 0, 11, 27, and 54 μsec, respectively. All pairwise comparisons for IPG were statistically significant (p ≤ 0.007). There was no statistically significant interaction between polarity and IPG (F(1.7, 18.3) = 0.28, p = 0.72).
Fig. 4.
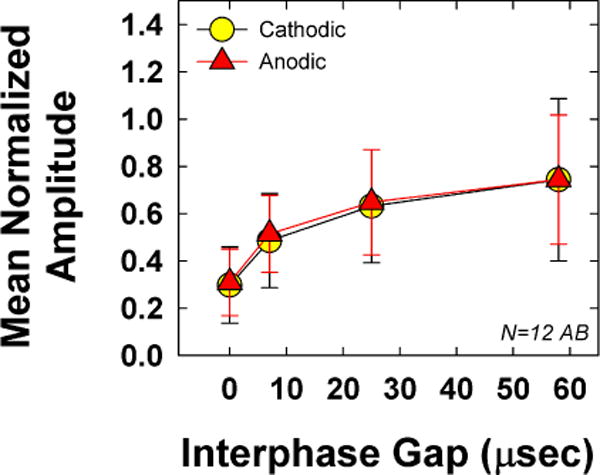
Mean (±1 SD) average normalized eCAP amplitude data for the 12 Advanced Bionics recipients participating in Exp. 1. Data are plotted similar to Fig. 3.
Fig. 5 shows the group mean (±1 SD) slope for both polarities across the four IPGs tested. Results showed no significant polarity effects (F(1, 11) = 3.60, p = 0.09), which was also consistent with our earlier study for Advanced Bionics recipients (Hughes et al., 2017). Mean slopes (collapsed across IPG) were 0.199 and 0.218 for cathodic- and anodic-leading pulses, respectively. The effect of IPG was not significant (F(3, 33)= 1.68, p = 0.19), with slightly steeper slopes for the two longest IPGs. Mean slopes (collapsed across polarity) were 0.203, 0.195, 0.218, and 0.217 for IPGs of 0, 11, 27, and 54 μsec, respectively. There was no statistically significant interaction between polarity and IPG (F(3, 33) = 2.22, p = 0.10).
Fig. 5.
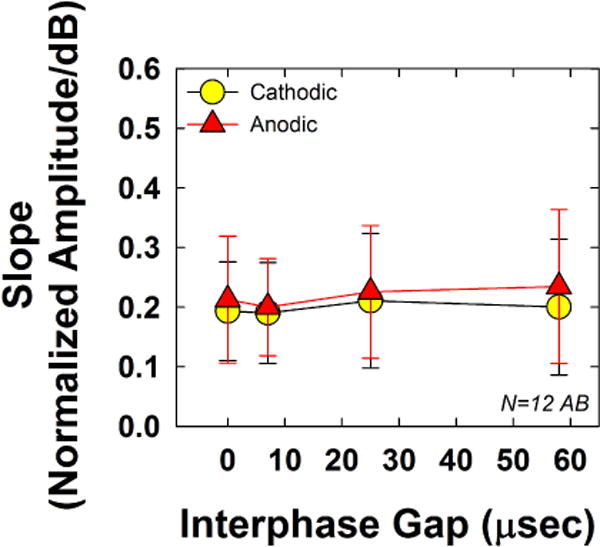
Mean (±1 SD) AGF slopes for the 12 Advanced Bionics recipients participating in Exp. 1. Data are plotted similar to Figs. 3 and 4.
Fig. 6 shows the relation between polarity effects and IPG effects for threshold (top), average normalized amplitude (middle), and AGF slope (bottom) for all AB recipients. The IPG effect was calculated for each participant and outcome measure (threshold, average normalized amplitude, and AGF slope) as the difference between the values obtained for the shortest and longest IPGs, averaged across both polarities. Likewise, the polarity effect for each participant and outcome measure was calculated as the difference in values obtained for each polarity, averaged across all four IPGs. In each panel, the IPG effect is plotted on the ordinate. With the exception of the top panel (threshold), the ordinate is labeled to show the hypothesized values representing better or poorer neural survival. (Recall that animal studies showed conflicting outcomes regarding IPG effects on threshold as a function of neural survival.) The polarity effect is plotted on the abscissa, with hypothesized values representing better or poorer neural survival plotted toward the left and right ends of the abscissa, respectively. Linear regression line fits to the data are shown on each graph. Pearson correlations were used to examine whether significant relations existed between IPG and polarity effects across the group. There were no significant correlations between IPG and polarity effects for threshold (r = 0.46, p = 0.13), average normalized amplitude (r = 0.14, p = 0.67), or slope (r = 0.28, p = 0.37).
Fig. 6.
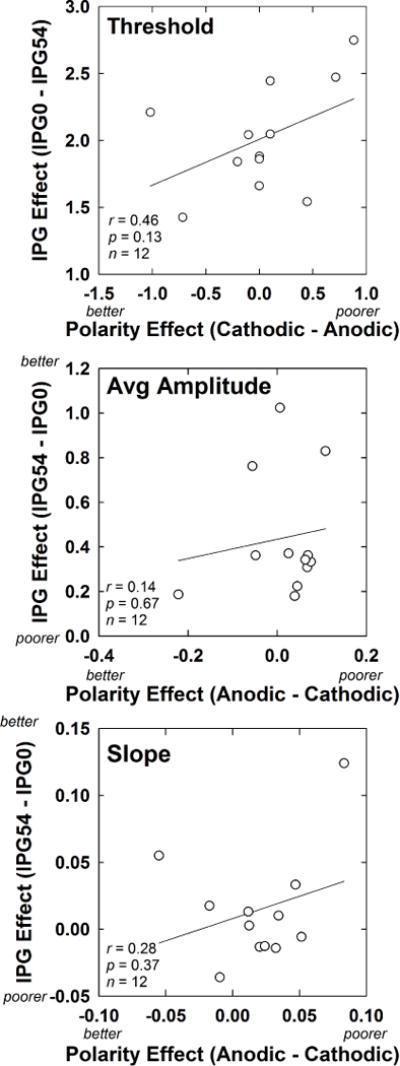
Scatter plots showing the relation between IPG and polarity effects for the 12 Advanced Bionics subjects participating in Exp. 1. For each subject, IPG effects are averaged across polarity, and polarity effects are averaged across IPG. Top: Results for eCAP thresholds (in dB). Middle: Results for average normalized eCAP amplitudes. Bottom: Results for AGF slope (normalized amplitude/dB). On each axis (with the exception of IPG for threshold), the hypothesized direction of results for better versus poorer neural survival is indicated.
3. Experiment 2: Polarity and IPG Effects across Cochlear Regions (Cochlear)
3.1. Materials and Methods
3.1.1. Participants
eCAP AGFs were obtained for 12 ears in 11 recipients with Cochlear Ltd. (Sydney, Australia) devices. One participant (F10/F11) had bilateral CIs, for which both ears were tested. Demographic details for the participants in Exp. 2 are summarized in the bottom portion of Table 1. The mean age at implantation was 43.4 years (range: 1.83 – 67.42). The mean duration of CI use was 6.0 years (range: 1.0–15.9), and the mean duration of deafness was 17.7 years (range: 4.4–63.4).
3.1.2. Equipment and Stimuli
eCAP measurements were obtained using Advanced Neural Response Telemetry (NRT) in the Custom Sound EP clinical software (v. 4.3; Cochlear Ltd., Sydney, Australia). Stimuli were delivered through a laboratory Freedom sound processor via a programming pod. All stimuli consisted of symmetrical, biphasic, cathodic-leading or anodic-leading current pulses presented in monopolar mode (re: MP1). Pulses were 25 μsec/phase in duration with IPGs of 7, 25, and 58 μsec (note that a 0-μsec IPG is not possible with Cochlear devices). As with Exp. 1, the masker and probe both consisted of the same stimulus, except that the level of the masker was offset by 10 current-level units (CL) above that of the probe to ensure adequate masking (Hughes et al., 2001). AGFs were obtained from four different electrodes from the basal (e1, 3, or 4), mid-basal (e8, 9, or 10), mid-apical (e12, 14, or 15), and apical (e22; e15 for F2) regions of the electrode array. The recording electrode was two positions apical to the stimulating electrode, relative to the extracochlear MP2 electrode (except for stimulation of e22, recording was from e20). The probe repetition rate was 80 Hz (software default). eCAP recordings were obtained with 50 dB gain and averaged across 100 sweeps over a 1.6-ms time window at a sampling rate of 20 kHz. The recording delay was optimized as needed to reduce stimulus artifact. The standard forward-masking subtraction method was used for artifact reduction (e.g., Abbas et al., 1999).
3.1.3. Procedures
First, impedances were measured in Custom Sound EP. Initial loudness judgments were then obtained using the “Stimulate Only” feature in Advanced NRT, following the procedures described for Exp. 1. Briefly, anodic-leading pulses were presented in an ascending fashion with a step size of 5 CL and 10 sweeps. Loudness estimates were obtained for all four test electrodes and all three IPG conditions using only the anodic-leading stimulus, as described in Exp. 1. eCAP AGFs were obtained for both leading polarities with all three IPGs (7, 25, and 58 μsec) on each of the four test electrodes. To obtain the eCAP AGFs, the starting stimulation level for the masker was set to equal that for the ‘8’ loudness rating, and the starting probe level was 10 CL below that of the masker. The current levels for the masker and probe (offset by 10 CL) were both systematically decreased by a step size of 5 CL (2-3 CL steps near threshold) until no eCAP responses could be visually identified from the noise floor (~2–4 μV; Patrick et al., 2006). For most subjects, test electrodes were 3, 8, 15, and 22 for the basal, mid-basal, mid-apical, and apical regions, respectively. The order in which AGFs were obtained (polarity, IPG, and test electrode) was randomized within each subject.
3.1.4. Data Analysis
The automatic N1 and P2 peak markers in Custom Sound EP were verified and adjusted as necessary by experienced testers. Stimulus levels in CL were converted to dB so the same analysis procedures were used as for Exp. 1. Within each subject, all AGFs were normalized to the highest amplitude of the AGF for the clinical default stimulus, which was cathodic-leading with 7 μsec IPG. An example is shown in Fig. 7 for e8 in participant FS20. Data are plotted similar to Fig. 2, with the raw data in the top panel and the normalized data in the bottom panel. The data points between the vertical lines in the bottom panel shows the range across which the average normalized amplitudes were calculated for this subject. All other data analysis procedures were the same as those described for Exp. 1, except that a third factor (electrode) was included with the factors polarity and IPG in the RM ANOVA.
Fig. 7.
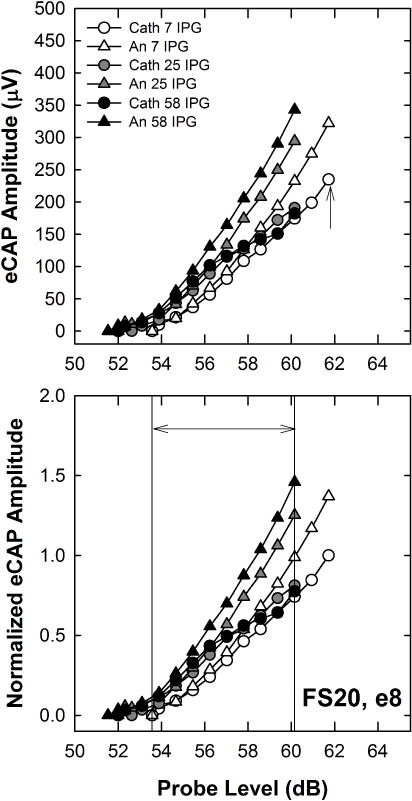
Top: Individual example of raw eCAP AGFs for both polarities (cathodic, circles; anodic, triangles) and all three IPGs (7, 25, and 58 μsec) for Cochlear subject FS20, electrode 8. Data are plotted similar to Fig. 2. Bottom: All AGFs were normalized to the highest amplitude of the AGF for the clinical default stimulus, which was cathodic-leading with 7-μsec IPG (Cath 7), indicated by the up-pointing arrow in the top panel. To obtain the average normalized amplitude for each polarity and IPG condition, normalized amplitudes within an AGF were averaged across a range of current levels that yielded eCAPs across all polarity/IPG conditions. This range is indicated by the double arrow between the two vertical lines in the bottom panel.
3.2. Results
Fig. 8 shows the mean (±1 SD) eCAP thresholds for both polarities across the three IPGs tested. Each panel shows data from a different electrode region. Cathodic and anodic results are indicated by circles and triangles, respectively. AGFs for two subjects were inadvertently collected with incorrect stimulus parameters (F15, basal, anodic, IPG-58; and F10, apical, anodic, IPG-25), so those subjects’ data have been excluded from Figs. 8–10. The three-factor RM ANOVA showed no significant polarity effects, as expected (F(1, 9) = 0.50, p = 0.50. Mean thresholds (collapsed across IPG and electrode) were 49.88 and 49.78 dB for cathodic- and anodic-leading pulses, respectively. The effect of IPG was significant (F(2, 18) = 174, p < 0.001), as expected, with progressively lower thresholds for longer IPGs. Mean thresholds (collapsed across polarity and electrode) were 50.58, 49.65, and 49.25 dB for IPGs of 7, 25, and 58 μsec, respectively. All pairwise comparisons for IPG were statistically significant (p ≤ 0.006). There was no significant effect of electrode (F(3, 27) = 2.04, p = 0.13), although thresholds were generally lowest in the apical region. Mean thresholds (collapsed across polarity and IPG) were 49.97, 50.70, 49.92, and 48.72 dB, for the basal, mid-basal, mid-apical, and apical regions, respectively. There was a significant interaction between polarity and IPG (F(2, 18) = 9.76, p = 0.001), where larger polarity effects were observed at the shortest IPG. Post-hoc testing showed significantly lower thresholds for anodic-leading stimuli than for cathodic at IPG-7 (t = 2.13, p = 0.039), with no significant polarity differences at IPG-25 or IPG-58. There were no significant interactions between any of the other main factors (electrode*polarity, electrode*IPG, or electrode*polarity*IPG). In general, these results were consistent with the Advanced Bionics data from Exp. 1 (see Fig. 3).
Fig. 8.
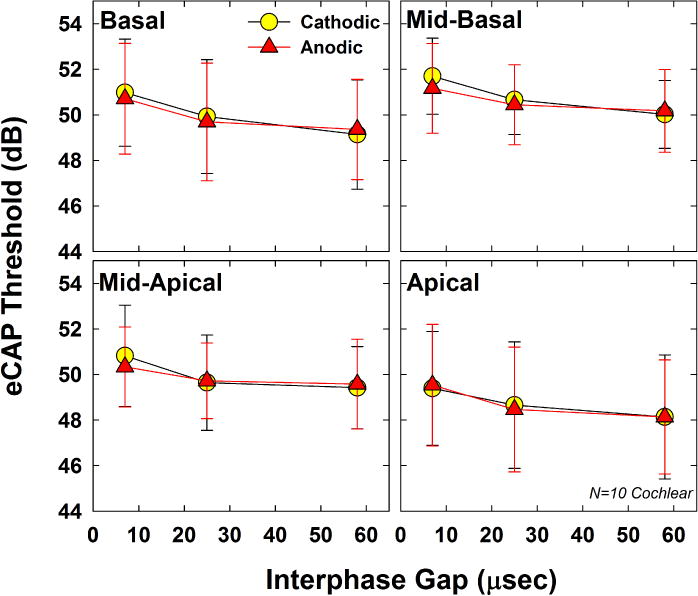
Mean (±1 SD) eCAP thresholds for both polarities (circles, cathodic; triangles, anodic), across IPGs of 7, 25, and 58 μsec. Each panel represents data from a different electrode. Data represent 10 Cochlear recipients participating in Exp. 2.
Fig. 10.
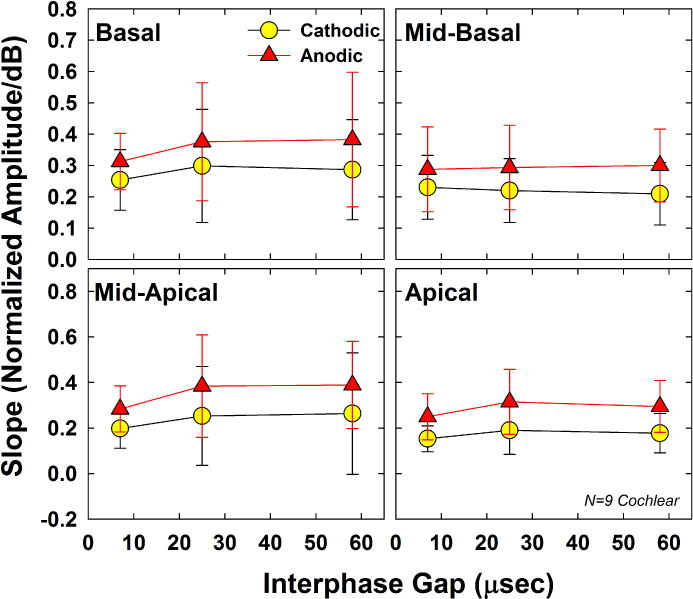
Mean (±1 SD) AGF slopes for 9 Cochlear recipients participating in Exp. 2. Data are plotted similar to Figs. 8 and 9.
Fig. 9 shows the group mean (±1 SD) normalized average amplitudes for both polarities across the three IPGs tested. Data are plotted similar to Fig. 8. Results showed significant polarity effects (F(1, 9) = 15.03, p = 0.004), with larger average amplitudes for anodic-leading stimuli than for cathodic-leading. Mean normalized amplitudes (collapsed across IPG and electrode) were 0.54 and 0.78 for cathodic- and anodic-leading pulses, respectively. The effect of IPG was also significant (F(1.0, 9.1) = 24.21, p = 0.001), as expected, with progressively larger normalized amplitudes for longer IPGs. Mean normalized amplitudes (collapsed across polarity and electrode) were 0.39, 0.69, and 0.90 for IPGs of 7, 25, and 58 μsec, respectively. All pairwise comparisons for IPG were statistically significant (p < 0.004). Although mean amplitudes decreased slightly from base to apex, there was no significant effect of electrode (F(1.5, 13.1) = 0.14, p = 0.80). Mean normalized amplitudes (collapsed across polarity and IPG) were 0.71, 0.67, 0.66, and 0.62, for the basal, mid-basal, mid-apical, and apical regions, respectively. There was a significant interaction between polarity and IPG (F(2, 18) = 6.92, p = 0.006), where larger polarity effects were observed for the two longer IPGs versus at the shortest IPG. There were no significant interactions between any of the other main factors (electrode*polarity, electrode*IPG, or electrode*polarity*IPG).
Fig. 9.
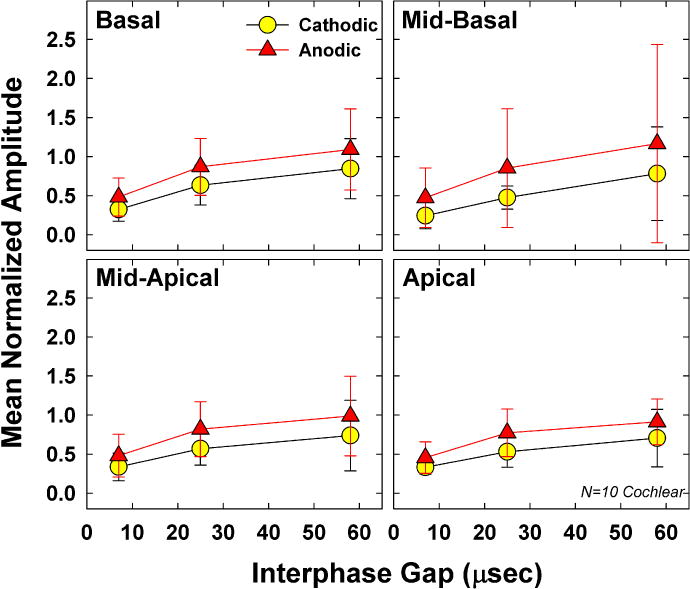
Mean (±1 SD) average normalized eCAP amplitude data for 10 Cochlear recipients participating in Exp. 2. Data are plotted similar to Fig. 8.
Fig. 10 shows the group mean (±1 SD) slope for both polarities across the three IPGs tested. For F27, the AGF for the mid-basal electrode (cathodic, IPG-7) only consisted of two points (including zero), so a valid slope could not be obtained. The RM ANOVA results showed significant polarity effects (F(1, 8) = 37.88, p < 0.001). Mean slopes (collapsed across IPG and electrode) were 0.228 and 0.322 for cathodic- and anodic-leading pulses, respectively. The effect of IPG was not significant (F(1.11,8.86) = 4.40, p = 0.063) Mean slopes (collapsed across polarity and electrode) were 0.246, 0.291, and 0.288 for IPGs of 7, 25, and 58 μsec, respectively. There was no significant effect of electrode (F(3, 24) = 1.27, p = 0.31). Mean slopes (collapsed across polarity and IPG) were 0.318, 0.257, 0.295, and 0.230 for the basal, mid-basal, mid-apical, and apical regions, respectively. There were no significant interactions between any of the main factors (polarity, IPG, and electrode; p > 0.14).
Fig. 11 shows the relation between polarity effects and IPG effects for threshold (top), average normalized amplitude (middle), and slope (bottom) for all electrodes and participants. The left column shows data points for all subjects and electrodes separately. Although this method of displaying the data violates the assumption of independence, we note that there was no significant effect of electrode on any of the dependent measures using RM ANOVAs. Data for each electrode region are indicated with different symbols, as detailed in the figure legend. The right column shows data from the left column averaged across electrodes within each subject so that each subject contributed only one data point to each correlation analysis. Data are plotted similar to Fig. 6. In all panels, the IPG effect was calculated for each participant and outcome measure (threshold, average normalized amplitude, and AGF slope) as the difference between the values obtained for the shortest and longest IPGs, averaged across both polarities. Likewise, the polarity effect for each participant and outcome measure was calculated as the difference in values obtained for each polarity, averaged across all three IPGs. For the two subjects with a single missing AGF (F15 and F10), IPG and polarity effects were calculated using the average across the remaining conditions. Pearson correlations were used to examine whether significant relations existed between IPG and polarity effects across the group. The r and p values are shown in each panel of Fig. 11. For the group data averaged across electrodes (right column), results showed a significant positive correlation between IPG and polarity effects for threshold (r = 0.62, p = 0.03). There was also a positive correlation between IPG and polarity effects for average normalized amplitude (r = 0.56, p = 0.056), which was opposite the direction hypothesized; however, the correlation was not significant. There was a significant negative correlation between IPG and polarity effects for slope (r = −0.75, p = 0.006), which supported the hypothesis. This correlation remained significant with the outlier removed (r = −0.62, p = 0.04).
Fig. 11.
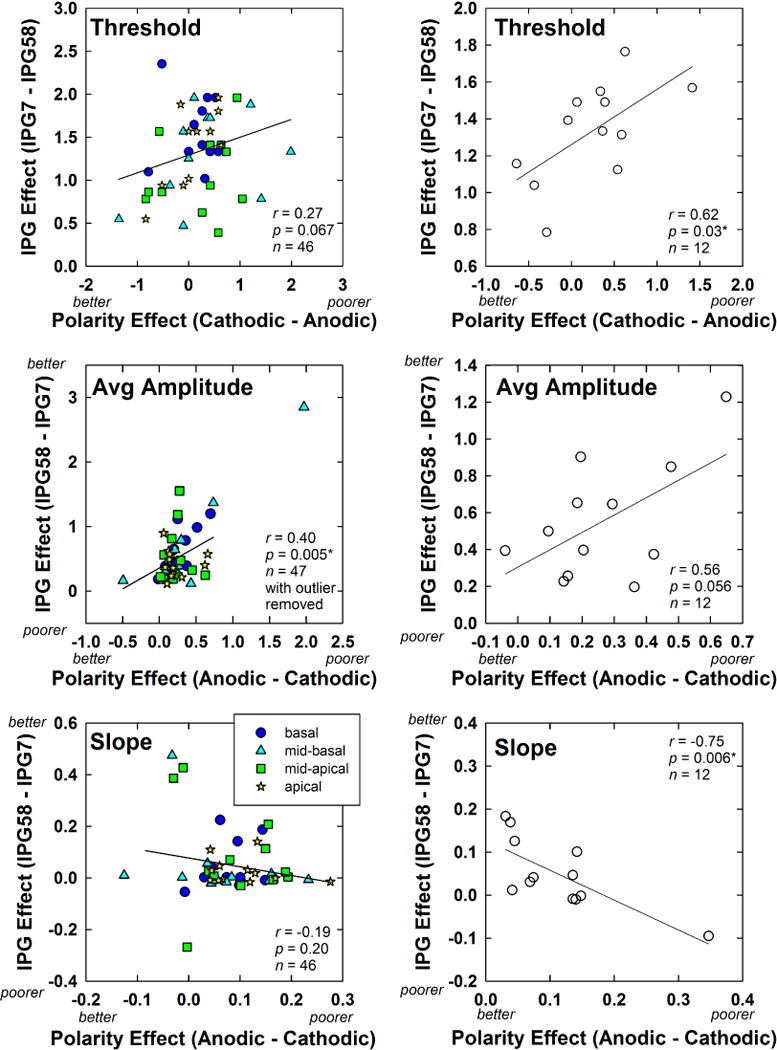
Scatter plots showing the relation between IPG and polarity effects for the 12 Cochlear subjects participating in Exp. 2. Data are plotted similar to Fig. 6. Left column: Individual data points for each electrode and subject are shown. Electrode regions are indicated by different symbols, as noted in the legend (color online). Right column: Data from the left column were averaged across electrodes within each subject so that each subject contributed only one data point. For each subject (all plots), IPG effects are averaged across polarity, and polarity effects are averaged across IPG. Top: Results for eCAP thresholds (in dB). Middle: Results for average normalized eCAP amplitudes. Bottom: Results for AGF slope (normalized amplitude/dB). On each axis, the hypothesized direction of results for better versus poorer neural survival is indicated, with the exception of IPG for threshold.
4. General Discussion
4.1. Threshold
The primary goal across both experiments was to compare polarity and IPG effects to determine whether both measures reflect similar underlying mechanisms related to auditory neural survival. For thresholds, we did not have a clear hypothesis because of conflicting results reported in animal studies (Prado-Guitierrez et al., 2006; Ramekers et al., 2014). In human CI recipients, polarity effects have primarily been observed only at supra-threshold levels for both physiological (Hughes et al., 2017) and perceptual (Macherey et al., 2006) measures, so no significant effect of polarity was expected for eCAP threshold. This would likely result in no significant correlation between polarity and IPG effects. The mean data consistently showed no significant polarity effects overall for both experiments (see Figs. 3 and 8). However, inspection of the individual-electrode data in Figs. 6 (top) and 11 (top left) shows that there are polarity effects for many of the test electrodes, with approximately equal positive and negative differences in threshold between polarities, which when averaged, yielded no net effect. This across-subject variation was also observed for behavioral thresholds in a recent study by Macherey et al. (2017). A negative difference between cathodic and anodic thresholds indicates that eCAP thresholds were lower (better) for cathodic-leading stimuli and higher (poorer) for anodic-leading stimuli. This result would suggest healthy or intact peripheral axons, based on modeling data that showed lower thresholds for cathodic than for anodic stimulation of healthy neurons (Rattay et al., 2001a). In contrast, a positive difference between cathodic and anodic thresholds indicates that eCAP thresholds were higher (poorer) for cathodic-leading stimuli and lower (better) for anodic-leading stimuli, which would be consistent with degenerated peripheral axons and more direct stimulation of the central axon with anodic-leading stimuli (see Fig. 1, bottom panel).
For IPG, we expected eCAP thresholds to decrease (improve) for longer IPGs (e.g., Prado-Guitierrez et al., 2006; Ramekers et al., 2014). Decreased thresholds were observed for longer IPGs in both experiments (see Figs. 3 and 8), consistent with the expected outcome. The largest mean threshold decrease was 1.085 dB, which occurred between the two shortest IPGs (0-IPG to 11-IPG) in Exp. 1. As a comparison, mean thresholds decreased by only 0.514 dB for the 11-IPG to 27-IPG conditions and 0.416 dB for the 27-IPG to 54-IPG conditions in Exp. 1, and by 0.927 dB for the 7-IPG to 25-IPG conditions and 0.404 dB for the 25-IPG to 58-IPG conditions in Exp. 2. These results suggest that IPG effects are largest between the shortest IPGs, and are consistent with perceptual effects reported by McKay and Henshall (2003). Modeling data and animal studies further support these results (Rubinstein et al., 2001; van den Honert & Mortimer, 1979). The model developed by Rubinstein et al. (2001) suggests there is a delay of 8.7–16 μsec between when the neural membrane reaches threshold voltage and when the neuron fires an action potential. van den Honert and Mortimer (1979) termed this the “vulnerable period.” By delaying the second phase of the biphasic pulse by at least this amount, time is allowed for the neuron to fire before the opposing phase has an opportunity to potentially abolish the action potential.
For both experiments, there was a significant interaction between polarity and IPG (see Figs. 3 and 8). Mean thresholds for cathodic-leading pulses were slightly higher than for anodic-leading pulses at the shortest IPG, but slightly lower at the longest IPG. This finding could be the result of differences in the effectiveness of the second phase to influence the “vulnerable period” at short IPGs. Let us assume, as the literature suggests, that the anodic phase is the more effective of the two polarities. If the anodic phase is first, a neuron will be more likely to achieve excitation, with less likelihood of the following cathodic phase to abolish the action potential. If the cathodic phase is first, the more effective anodic phase will be more likely to abolish an action potential, resulting in higher thresholds for cathodic-first pulses. Alternatively, if we assume that the cathodic phase is less effective in eliciting synchronized action potentials in human CI users (as suggested by Macherey et al., 2008 and Undurraga et al., 2010), then the cathodic-first phase will polarize the neural membrane in the opposite direction, making it more difficult for the anodic-second phase to elicit an action potential. Either way, the result will be higher thresholds for cathodic-first than for anodic-first pulses at short IPGs. As the IPG increased to 25–27 μsec, thresholds for both leading polarities were approximately equal (50.6 dB and 50.5 dB for cathodic and anodic, respectively for Exp. 1 and 49.7 dB and 49.6 dB for cathodic and anodic, respectively for Exp. 2). This time frame is longer than the vulnerable period of 8.7–16 μsec reported by Rubinstein et al. (2001), consistent with a reduced interaction between phases. It is unclear why thresholds were slightly lower with cathodic-leading stimuli at the longest IPG for both experiments; however, it is important to point out that there was no statistically significant difference in threshold between polarities at any of the individual IPGs tested, with the exception of the shortest IPG (7 μsec) in Exp. 2.
For Exp. 1 threshold data (single electrode, Advanced Bionics), there was no significant correlation between polarity and IPG effects (see Fig. 6, top panel). For this group, there were virtually no polarity effects for the majority of subjects. Only two participants exhibited negative polarity effects on threshold (cathodic lower than anodic) and three exhibited positive polarity effects. For Exp. 2 threshold data (Cochlear; Fig. 11, top right panel), there was a significant positive correlation between polarity and IPG effects. This result is consistent with guinea pig data from Ramekers et al. (2014) that showed larger threshold shifts with increased IPG for ears with reduced spiral ganglion cell packing density (poorer neural health). Their study suggested that the reduced packing density might provide a more direct current path to the central axon. Because auditory neurons are more tightly bundled at the central axon, direct stimulation at this level could result in lower thresholds due to recruitment of a larger number of neurons.
4.2. Amplitude and Slope
For neurons with degenerated peripheral axons, the anodic polarity presumably provides direct stimulation of the central axon where neurons are more tightly bundled. Excitation of these more tightly bundled neurons should lead to larger amplitudes and a steeper growth of response, either because more neurons are stimulated or because they respond more synchronously. Larger differences in amplitude between polarities could therefore reflect differences in site of excitation as a result of peripheral axonal degeneration. It is important to keep in mind, however, that the cathodic-first biphasic pulse still contains an anodic phase. Even if the cathodic phase is not effective at eliciting action potentials on its own (Macherey et al., 2008; Undurraga et al., 2010), the following anodic phase should still be excitatory. As discussed above, the cathodic-first phase will polarize the neural membrane in the opposite direction, making it more difficult for the anodic-second phase to elicit an action potential at the same current level that would elicit a response from an anodic-first pulse. Thus, at a given current level, we observed larger amplitudes and steeper slopes for anodic-leading pulses than for cathodic-leading pulses (Exp. 2, Figs. 9 and 10). This was not the case, however, for the Advanced Bionics data (Exp. 1, Figs. 4 and 5), which is further discussed next.
A secondary goal of Exp. 1 was to determine whether the lack of polarity effects for amplitude and slope observed in our previous study (Hughes et al., 2017) for Advanced Bionics recipients (in contrast to Cochlear recipients) could be attributed to the lack of an IPG. The results from Exp. 1 showed no significant polarity effects for mean normalized amplitude or slope across all IPGs. Further, there was no interaction between the factors of polarity and IPG. These findings suggest that the null polarity effects for amplitude and slope that were observed in our previous study for Advanced Bionics recipients cannot be attributed to the absence of an IPG. Other differences between manufacturers that might be responsible for the conflicting findings between device types in Hughes et al. (2017) and the present study include pulse duration, probe rate, and electrode array design. The impact of each of these factors is described in greater detail in the Discussion section of Hughes et al. (2017). Briefly, the results from Hughes et al. (2017) suggest that probe rate and array type were likely not responsible for the differences in outcomes between manufacturers. Pulse duration, however, could still be a factor. The pulse duration used for Advanced Bionics recipients in Hughes et al. (2017) and the present study was 32 μsec/phase (equal to the clinical default), whereas the pulse duration for Cochlear recipients was 25 μsec/phase. Short-duration pulses are more effective than long-duration pulses because the neural membrane is a leaky integrator (Loeb et al., 1983). As a result, it is possible that polarity effects are more pronounced for shorter-duration pulses than for longer-duration pulses. It is unclear whether a 7-μsec difference in phase duration is large enough to have a measurable impact on polarity effects; this remains to be investigated.
Regarding IPG effects, a recent study with adult CI recipients (Schvartz-Leyzac & Pfingst, 2016) found that eCAP amplitudes and AGF slope increased with IPG, with steeper slopes occurring for recipients with shorter durations of hearing loss. Those results are consistent with larger amplitudes (Prado-Guitierrez et al., 2006; Ramekers et al. 2014) and steeper slopes (Ramekers et al. 2014) observed for guinea pigs with greater spiral ganglion cell density. However, Schvartz-Leyzac and Pfingst (2016) found that the IPG effect, quantified as the average change in slope between short (7 μsec) and long (30 μsec) IPGs, was not correlated with duration of hearing loss. We performed correlation analyses on our data set to determine whether polarity effects or IPG effects were related to duration of deafness (from Table 1). No significant correlations (p > 0.05) were found for these comparisons. Although we used duration of deafness instead of duration of hearing loss as a comparison measure, our findings were consistent with Schvartz-Leyzac and Pfingst (2016). In contrast, Ramekers et al. (2014) found larger increases in slope with increased IPG for animals with better neural health. Last, data from the present study showed no significant effect of IPG on the slope of the AGF for either AB (Exp. 1, Fig. 5) or Cochlear (Exp. 2, Fig. 10) recipients, which was not consistent with data from Schvartz-Leyzac and Pfingst (2016). These inconsistencies might reflect the heterogeneity across CI recipients for factors such as etiology, duration of deafness, duration of hearing loss, or electrode placement.
For amplitude and slope, we expected a negative correlation between IPG and polarity effects, where small polarity effects and large IPG effects both presumably reflect better neural health. For the Advanced Bionics group, the amplitude and slope data shown in the middle and bottom panels, respectively, of Fig. 6 show no significant correlations between polarity and IPG effects, which do not support the hypotheses. For the Cochlear group, the amplitude data shown in the right middle panel of Fig. 11 demonstrate no significant correlation. In fact, the direction of the correlation was positive, which was in the direction opposite that hypothesized. The slope data, shown in the bottom panel of Fig. 11, demonstrate a significant correlation between IPG and polarity effects, which was the only comparison that supported any of the hypotheses relating polarity and IPG. Collectively, these findings suggest that polarity and IPG effects might arise from different underlying mechanisms, each of which might be impacted differently by deafness. Modeling studies by Rattay et al. (2001a,b) show that stimulus polarity can affect the site of action potential initiation. These effects are influenced by the degree of peripheral degeneration, modeled by reducing the number of nodes of Ranvier. Interphase gap, on the other hand, is influenced by integrative time constants of the neural membrane. These time constants are sensitive to fiber diameter, resistivity of the surrounding medium (which is likely not homogeneous), capacitance, and the kinetics of the voltage-gated sodium channels (e.g., Rubinstein et al., 2001). As a result, IPG and polarity might have different effects for neurons that suffer from severe retrograde degeneration (reduced length of the peripheral axon) versus demyelination of peripheral and/or central axons. It is also important to point out that the eCAP represents a convolution of single-fiber action potentials, and that not all of the contributing fibers will have the same degree of neural health or will necessarily respond in the same way to a given stimulus. Last, animal studies that have related IPG effects to neural survival have primarily focused on spiral ganglion cell density as the primary metric of neural health (Prado-Guitierrez et al., 2006; Ramekers et al. 2014). It is also possible that the assumptions that the hypotheses were based on – which were derived from animal studies – cannot be assumed for humans. Human CI users exhibit wide ranges in etiology and duration of deafness, two factors that are typically controlled in animal experiments. Electrode placement within the cochlea also tends to vary more in humans than in animals, the latter of which are typically implanted with arrays consisting of only a few electrodes (e.g., Prado-Guitierrez et al., 2006; Ramekers et al., 2014). Last, the anatomical differences between humans and animal models differ, such as cochlear geometry, length of the peripheral axon, and whether or not the soma and/or peripheral processes are myelinated (e.g., Rattay et al., 2001a,b).
A secondary goal of Exp. 2 was to examine polarity and IPG effects across four regions of the electrode array (basal, mid-basal, mid-apical, and apical) to determine whether smaller IPG effects and larger polarity effects would be observed for basal electrodes than for middle or apical electrodes, reflecting potentially poorer neural health in the basal region (Nadol, 1997; Nadol et al., 2001; Undurraga et al., 2010). Results showed no significant electrode effects for any of the three outcome measures (threshold, amplitude, or slope). These results were consistent with eCAP amplitude results obtained in three subjects by Undurraga et al. (2010). They found a significant effect of polarity but no significant effect of electrode location and no significant interaction between polarity and location. In guinea pigs, Ramekers et al. (2014) showed that the correlation between histological measures (SCG packing density or perikaryal area) and IPG effects did not generally vary across cochlear regions. In another study with guinea pigs, Macherey and Cazals (2016) found that polarity effects did not change systematically over time post deafening (up to one year), suggesting that polarity effects might not be mediated solely by neural degeneration. The lack of region effects observed in the present study could be due to the heterogeneity in neural survival patterns that accompanies a wide range of etiology and duration of deafness observed in humans (e.g., Fayad & Linthicum, 2006) and the relatively small sample size included here.
4.3. Summary and Conclusions
Mean data show that stimulus polarity exhibits larger effects for supra-threshold measures (eCAP amplitude and AGF slope) than for threshold, where anodic-leading stimuli typically yielded larger amplitudes and steeper slopes than for cathodic-leading pulses. However, polarity effects on supra-threshold measures were observed only for the Cochlear group (Exp. 2) and not for the Advanced Bionics group (Exp. 1). This device difference might be due to differences in the default pulse durations that were used; this remains an area for further investigation. In contrast to the polarity effects, IPG effects were observed at both threshold and supra-threshold levels (average amplitude, but not slope), and were consistent across both manufacturers’ devices. In general, longer IPGs yielded lower thresholds and larger amplitudes. Only one of the correlations between IPG effects and polarity effects were in the predicted direction, which suggests that polarity and IPG effects likely reflect different underlying mechanisms that might be impacted in different ways by deafness. Overall, the results from this study suggest that the underlying mechanisms that contribute to polarity and IPG effects in human CI recipients might be difficult to determine from animal studies that do not exhibit the same variance in etiology, duration of deafness, and electrode placement as humans.
Highlights.
Stimulus polarity primarily has supra-threshold effects on the eCAP
Anodic-leading pulses yield larger amplitudes and steeper slopes than cathodic
Longer interphase gaps yield lower thresholds and larger amplitudes
Interphase gap and polarity effects are generally not correlated
Acknowledgments
This research was supported by NIH/NIDCD grants R01 DC009595 and P30 DC04662. The content of this project is solely the responsibility of the authors and does not necessarily represent the official views of the National Institute on Deafness and Other Communication Disorders or the National Institutes of Health. Portions of this project were presented at the 2016 American Auditory Society Meeting. The authors thank Jenny Goehring for assistance with data collection and analysis.
Abbreviations
- AB
Advanced Bionics
- AGF
amplitude growth function
- BEDCS
Bionic Ear Data Collection System
- CI
cochlear implant
- CL
current level units
- eCAP
electrically evoked compound action potential
- IPG
interphase gap
- MPI
masker-probe interval
- NRT
Neural Response Telemetry
- PSP
Platinum Series Processor
- CPI II
Clinical Programming Interface
- RM ANOVA
repeated-measures analysis of variance
Footnotes
Publisher's Disclaimer: This is a PDF file of an unedited manuscript that has been accepted for publication. As a service to our customers we are providing this early version of the manuscript. The manuscript will undergo copyediting, typesetting, and review of the resulting proof before it is published in its final citable form. Please note that during the production process errors may be discovered which could affect the content, and all legal disclaimers that apply to the journal pertain.
References
- Abbas PJ, Brown CJ, Shallop JK, Firszt JB, Hughes ML, et al. Summary of results using the Nucleus CI24M implant to record the electrically evoked compound action potential. Ear Hear. 1999;20:45–59. doi: 10.1097/00003446-199902000-00005. [DOI] [PubMed] [Google Scholar]
- Fayad JN, Linthicum FH., Jr Multichannel cochlear implants: Relation of histopathology to performance. Laryngoscope. 2006;116:1310–1320. doi: 10.1097/01.mlg.0000227176.09500.28. [DOI] [PubMed] [Google Scholar]
- Hughes ML, Goehring JL, Baudhuin JL. Effects of stimulus polarity and artifact reduction method on the electrically evoked compound action potential. Ear Hear. 2017;38(3):332–343. doi: 10.1097/AUD.0000000000000392. [DOI] [PMC free article] [PubMed] [Google Scholar]
- Hughes ML, Vander Werff KR, Brown CJ, Abbas PJ, Kelsay DMR, Teagle HFB, Lowder MW. A longitudinal study of electrode impedance, the electrically evoked compound action potential, and behavioral measures in Nucleus 24 cochlear implant users. Ear Hear. 2001;22:471–486. doi: 10.1097/00003446-200112000-00004. [DOI] [PubMed] [Google Scholar]
- Kim JR, Abbas PJ, Brown CJ, Etler CP, O’Brien S, Kim LS. The relationship between electrically evoked compound action potential and speech perception: A study in cochlear implant users with short electrode array. Otol Neurotol. 2010;31(7):1041–1048. doi: 10.1097/MAO.0b013e3181ec1d92. [DOI] [PMC free article] [PubMed] [Google Scholar]
- Loeb GE, White MW, Jenkins WM. Biophysical considerations in electrical stimulation of the auditory nervous system. Ann NY Acad Sci. 1983;405:123–136. doi: 10.1111/j.1749-6632.1983.tb31625.x. [DOI] [PubMed] [Google Scholar]
- Macherey O, Carlyon RP, Chatron J, Roman S. Effect of pulse polarity on thresholds and on non-monotonic loudness growth in cochlear implant users. J Assoc Res Otolaryngol. 2017;18(3):513–527. doi: 10.1007/s10162-016-0614-4. [DOI] [PMC free article] [PubMed] [Google Scholar]
- Macherey O, Carlyon RP, van Wieringen A, Deeks JM, Wouters J. Higher sensitivity of human auditory nerve fibers to positive electrical currents. J Assoc Res Otolaryngol. 2008;9:241–251. doi: 10.1007/s10162-008-0112-4. [DOI] [PMC free article] [PubMed] [Google Scholar]
- Macherey O, Cazals Y. Effects of pulse shape and polarity on sensitivity to cochlear implant stimulation: A chronic study in guinea pigs. In: van Dijk P, et al., editors. Physiology, Psychoacoustics and Cognition in Normal and Impaired Hearing. Vol. 894. Springer: Advances in Experimental Medicine and Biology; 2016. pp. 133–142. [DOI] [PubMed] [Google Scholar]
- Macherey O, van Wieringen A, Carlyon RP, Deeks JM, Wouters J. Asymmetric pulses in cochlear implants: effects of pulse shape, polarity, and rate. J Assoc Res Otolaryngol. 2006;7:253–266. doi: 10.1007/s10162-006-0040-0. [DOI] [PMC free article] [PubMed] [Google Scholar]
- McKay CM, Henshall KR. The perceptual effects of interphase gap duration in cochlear implant stimulation. Hear Res. 2003;181:94–99. doi: 10.1016/s0378-5955(03)00177-1. [DOI] [PubMed] [Google Scholar]
- Miller CA, Abbas PJ, Hay-McCutcheon MJ, Robinson BK, Nourski KV, Jeng FC. Intracochlear and extracochlear eCAPs suggest antidromic action potentials. Hear Res. 2004;198:75–86. doi: 10.1016/j.heares.2004.07.005. [DOI] [PubMed] [Google Scholar]
- Nadol JB., Jr Patterns of neural degeneration in the human cochlea and auditory nerve: Implications for cochlear implantation. Otolaryngol Head Neck Surg. 1997;117:220–228. doi: 10.1016/s0194-5998(97)70178-5. [DOI] [PubMed] [Google Scholar]
- Nadol JB, Jr, Shiao JY, Burgess BJ, Ketten DR, Eddington DK, et al. Histopathology of cochlear implants in humans. Ann Otol Rhinol Laryngol. 2001;110(9):883–891. doi: 10.1177/000348940111000914. [DOI] [PubMed] [Google Scholar]
- Patrick JF, Busby PA, Gibson PJ. The development of the Nucleus Freedom cochlear implant system. Trends Amplif. 2006;10:175–200. doi: 10.1177/1084713806296386. [DOI] [PMC free article] [PubMed] [Google Scholar]
- Prado-Guitierrez P, Fewster LM, Heasman JM, McKay CM, Shepherd RK. Effect of interphase gap and pulse duration on electrically evoked potentials is correlated with auditory nerve survival. Hear Res. 2006;215:47–55. doi: 10.1016/j.heares.2006.03.006. [DOI] [PMC free article] [PubMed] [Google Scholar]
- Ramekers D, Versnel H, Strahl SB, Smeets EM, Klis SFL, Grolman W. Auditory-nerve responses to varied inter-phase gap and phase duration of the electric pulse stimulus as predictors for neuronal degeneration. J Assoc Res Otolaryngol. 2014;15:187–202. doi: 10.1007/s10162-013-0440-x. [DOI] [PMC free article] [PubMed] [Google Scholar]
- Rattay F, Lutter P, Felix H. A model of the electrically excited human cochlear neuron. I. Contribution of neural substructures to the generation and propagation of spikes. Hear Res. 2001a;153:43–63. doi: 10.1016/s0378-5955(00)00256-2. [DOI] [PubMed] [Google Scholar]
- Rattay F, Leao RN, Felix H. A model of the electrically excited human cochlear neuron. II. Influence of the three-dimensional cochlear structure on neural excitability. Hear Res. 2001b;153:64–79. doi: 10.1016/s0378-5955(00)00257-4. [DOI] [PubMed] [Google Scholar]
- Rubinstein JT, Miller CA, Mino H, Abbas PJ. Analysis of monophasic and biphasic electrical stimulation of nerve. IEEE Trans Biomed Eng. 2001;48(10):1065–1070. doi: 10.1109/10.951508. [DOI] [PubMed] [Google Scholar]
- Schvartz-Leyzac KC, Pfingst BE. Across-site patterns of electrically evoked compound action potential amplitude-growth functions in multichannel cochlear implant recipients and the effects of the interphase gap. Hear Res. 2016;341:50–65. doi: 10.1016/j.heares.2016.08.002. [DOI] [PMC free article] [PubMed] [Google Scholar]
- Shepherd RK, Javel E. Electrical stimulation of the auditory nerve: II. Effect of stimulus waveshape on single fibre response properties. Hear Res. 1999;130:171–188. doi: 10.1016/s0378-5955(99)00011-8. [DOI] [PubMed] [Google Scholar]
- Undurraga JA, Carlyon RP, Wouters J, van Wieringen A. The polarity sensitivity of the electrically stimulated human auditory nerve measured at the level of the brainstem. J Assoc Res Otolaryngol. 2013;14:359–377. doi: 10.1007/s10162-013-0377-0. [DOI] [PMC free article] [PubMed] [Google Scholar]
- Undurraga JA, van Wieringen A, Carlyon RP, Macherey O, Wouters J. Polarity effects on neural responses of the electrically stimulated auditory nerve at different cochlear sites. Hear Res. 2010;269:146–161. doi: 10.1016/j.heares.2010.06.017. [DOI] [PubMed] [Google Scholar]
- van den Honert C, Mortimer JT. The response of the myelinated nerve fiber to short duration biphasic stimulating currents. Ann Biomed Eng. 1979;7:177–125. doi: 10.1007/BF02363130. [DOI] [PubMed] [Google Scholar]


